

Historians now use business networks as a common tool for analysis. In the past, historiography posited these networks as an inherent positive within the commercial context. This was certainly the case when historians discussed ascribed trust networks based on kinship, religion, or ethnicity. Footnote 1 Recently, however, historians have considered the potential problems associated with networks, which includes recognition that ascribed trust networks can be the most abused. Footnote 2 Others have considered issues such as rent-seeking and lobbying behavior, as well as how time-consuming and difficult networks can be to construct and maintain. Footnote 3 This reassessment has included formal networking institutions such as guilds and trade associations. Such “metropolitan business networks” Footnote 4 should promote the interests of their members and the local and national economies through the easy transference of information. This is because they consist of a web of overlapping memberships of participatory organizations, formally independent of the state, acting on behalf of a collective and public interest. Footnote 5 However, such formal networking institutions were far from always successful. Guilds often retarded progress, and trade associations and town councils were often counter-productive and inward looking. Footnote 6 Sometimes they were used for social reasons rather than commercial purposes. Footnote 7 Indeed, it has been suggested that such networks are a “micro-social order” Footnote 8 in which members often form an affective commitment to the institution over and above that which they feel toward other individual members. Therefore, while a business network can be defined as “a group or groups of people that form associations with the explicit or implicit expectation of mutual long-term economic benefit,” Footnote 9 it can no longer be assumed that metropolitan business networking institutions were a positive economic good for every member (let alone the wider community) or even that members joined and used that institution for the purpose of networking with a view to economic gain.
This article questions the role of metropolitan business networks through the case study of the Committee of Merchants Trading to Africa from Liverpool (hereafter, African Committee). It brings together history, regression analysis, and visual analytics in a novel interdisciplinary methodology to investigate how and why actors used formal networking institutions such as trade associations. In doing so, it is not as interested in the relationship between actors as the relationship of the actors with the institution. This article first outlines the formation, role, and membership of the African Committee. It then explains the methodology used and discusses in detail how Liverpool merchants networked with this networking institution. The conclusion argues that actors used the Liverpool African Committee in both instrumental and affective ways but not necessarily when and how might be expected. It also outlines the potential wider implications and uses of this methodology.
The Liverpool African Committee
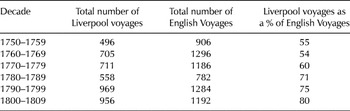
Liverpool from 1750 to 1810 provides an excellent prism through which to study networking via formal trade associations. During this period the port was well connected to the hinterland as well as international markets and fulfilled various port town functions, such as being an entrepôt and an insurance and financial center. Footnote 10 Liverpool benefitted greatly from Britain’s Atlantic trade, and by 1804 it was hailed as the second seaport of the realm. Footnote 11 The town was also the leader in the transatlantic slave trade by 1750 and remained so until its abolition in 1807 (table 1). Footnote 12
Number of Liverpool slave ships by decade, 1750–1809

Source: Eltis et al., “Transatlantic Slave Trade Database.”
Note: A simple query on vessels leaving Liverpool per decade is available at www.slavevoyages.org. The total numbers of enslaved Africans embarked were: 121,003 (1750–1759); 175,181 (1760–1769); 190,449 (1770–1779); 185,121 (1780–1789); 268,405 (1790–1799); and 260,670 (1800–1809).
The port also had a variety of formal and informal institutions as befitted its urban status. Footnote 13 Given the important role Liverpool played in the slave trade, there was also the Liverpool African Committee. The African Committee was part of a national Company of African Traders set up in 1750 (London and Bristol were the other two ports involved). Footnote 14 The Company of African Traders was set up by An Act for Extending and Improving the Trade to Africa, which was designed to promote and regulate the British slave trade in West Africa in response to the forthcoming demise of the Royal African Company in 1752. Footnote 15 Liverpool by then was the leader of the slave trade, so clearly this was an important institution for the town and especially for those merchants trading to Africa. Furthermore, the fact that the slave trade was highly capitalized meant that many of the members of the African Committee were successful, and often leading, merchants. It might be assumed that with the rise of the abolition movement from the 1780s, and especially with the regulation of the slave trade with Dolben’s Bill (and subsequent Act) of 1788, that the African Committee would also be important in the defense of the trade. Footnote 16 It might also be expected that given that the African Committee represented Liverpool’s interest in extending and improving the slave trade to Africa, actors would join and engage positively throughout the period, but perhaps more so in the late 1780s and early 1800s in order to defend the trade. Footnote 17
Over this period, the total membership of the African Committee was 280; however, only those actors who had a firm record of attendance in Liverpool were included, a subtotal of 245. Of these, not all were slave traders (for example, Edgar Corrie), but the majority of them were, and most were also on the town council. Footnote 18 Indeed, William Davenport is noticeably absent. Footnote 19 As discussed later, active members also included merchants who had previously been (part) owners of slave trade vessels but who had subsequently withdrawn from the slave trade or belonged to families involved in the trade while that individual was not. Noticeable actors in this category included Jonathan Blundell, the Manesty family, and Ralph Earle. The Liverpool African Committee members first met on July 3, 1750, and, as per the provisions of the act setting up the African Company, came together annually to elect three members to represent their interests in London. Those wanting to trade to Africa became “free” of the African Company for a fee of forty shillings, paid to Liverpool’s town clerk. The African Committee met in the exchange, within the town hall, except in the later years when they met in the court room of the town hall. In the early years, the Liverpool members met in July and February of each year, although they met only annually from July 1754 until the African Company of Merchants was abolished in 1821. Footnote 20 Unfortunately, the Committee Book only records attendance and the annual election of the London representatives: particular roles (such as secretary or treasurer), agenda items, or a record of discussions were not normally given. Exceptions to this are only found early on, when a couple of resolutions were recorded that noted that the governor and other officers on the African coast should not trade in slaves on their own account or use African Company property for their own private trade. Footnote 21 It is likely that members discussed the upkeep of forts on the African coast, French competition, regulation of the slave trade, the abolition movement, and the effects of war, but it is not possible to know for certain.
Methodology
As mentioned above, historians have started to complicate their understanding of networks, including personal and institutional networks, through the adoption of methodologies from socioeconomics, mathematics, and computer science, as well as from the use of visual analytics. Footnote 22 Scholars have investigated organizational commitment through the use of networks, but the understanding between “actual social relationships and organizational commitment is quite limited.” Footnote 23 Indeed, we are not aware of any attempt to measure the strength or type of relationships that actors had with a networking institution. This article brings together history, regression analysis, and visual analytics to achieve this goal. The resulting visualizations elucidate and quantify the actors’ relationships with an institution in a visually appealing and easily accessible way.
The case study of the African Committee helps to answer questions about the historical relationships of actors with networking institutions. Individuals join institutions for a variety of reasons but do so under two main categories: instrumental purposes (to access tangible resources and information) and expressive or affective reasons (social support, pleasure, and identity conferral). Footnote 24 These are not necessarily mutually exclusive, but it might be expected that more actors joined a trade association such as the African Committee for instrumental reasons, with affective ties being a beneficial consequence, rather than vice versa. The model posited here seeks to assess actors’ relationships with the African Committee under these two categories. These are, therefore, derived from one (single-mode) network, which represents a reversal of the two-mode (or bipartite) network often used to establish links between two different networks (or sets). Footnote 25 Using a single-mode network also facilitates the use of a variety of network measures that are mostly designed for use on single-mode (set) networks. Footnote 26
An important assumption in the identification of the two groups here is that if an actor joined and left at the same time as others (that is, “with the herd”), that actor was less committed to the economic aims of the African Committee and more likely to have joined for affective ties, or at the very least the actor did not demonstrate strong long-term commitment to the network. If however, an actor joined and left on his own independent timing, it can be assumed that that actor joined for more instrumental reasons concerned with his economic aims. It should be noted that the identification of interpersonal relationships (that is, friendships) is not the aim of this study. However, as discussed later, we identify the relationships actors had with the network.
The period covered by the case study is from 1750, when the African Committee was formed, until 1810, which is just after abolition of the British transatlantic slave trade. There are, therefore, a self-limiting number of actors due to a finite membership and historical context. This means that we did not need to use a name generator, which also solved issues of egocentricity and the tendency to reflect stronger ties often found in such methodologies. Footnote 27 This sample represents 100 percent of active membership from 1750 to 1810. Membership was organized by decade to allow for the analysis of medium-term trends.
In order to assess the types of ties actors had with the African Committee, two simple ordinary least squares (OLS) regression models were applied to the attendance data using GRETL. Footnote 28 The attendance data was entered in a simple matrix, with attendance being noted as numerical 1 and absence 0. In order to avoid multicolinearity, control years and control actors were chosen for each decade. Footnote 29
Statistically significant actors who most regularly interacted with the network (propensity to attend) were identified, and if they did so when most other people attended (“with the herd”) (model 1). Actors with a positive result in the regression and visual analytics are highlighted. Those actors who did not attend with the general swell produced a negative result are also highlighted. Actors with positive results are assumed to have been those with commitment via predominantly affective ties (social support, pleasure, and identity conferral), while those with negative results are assumed to have been more independent of the general membership and therefore had commitment via predominantly instrumental ties (access to tangible resources and information).
A panel regression model is specified in which the probability that individual i interacts in period t is
 $${\rm{prob}}\left( {{y_{it}}\, = \,1} \right)\, = \,c\, + \,{a_t}\, + \,{b_i}\, + \,{u_{it}}$$
where y it is the binary element in the ith column and tth row; c is a constant, measuring the relative frequency with which an actor, on average, interacts with the network; a t is a period-specific factor reflecting the above-average popularity of the network at time t; and b i is an actor-specific factor reflecting the disposition of the ith actor to interact more frequently than average. The variable u it represents an unobservable random disturbance that can either be positive or negative; it is assumed to have zero mean and a constant variance, independent of i and t. Model 1 does not address time patterns in attendance.
Under this model, therefore, it would be expected that people attended together if there was an affective (positive) relationship and more independently if there was an instrumental (negative) relationship. Those actors who used the African Committee for purely social (affective) reasons might be expected to have attended less when trade was difficult and might have had to contribute in a more meaningful way. In contrast, it is expected that merchants who joined for more instrumental reasons would have attended more regularly, and especially so when the slave trade was under threat. Of course, there may be actors who had both affective and instrumental ties with the network at the same time or with no discernible pattern observed using this methodology. Footnote 30 These actors fall into a third category in our results: statistically not significant.
Particular time patterns in attendance at meetings were identified (model 2). Model 2 tests for whether attendance increased or decreased over time at a constant rate. It also tests for persistence in attendance; that is, in which attendance in one year increased the probability of attendance in the next, or attendance in one year increased the possibility of attendance in the next but one (a delayed but persistent attendance). Another way of seeing this is as alternation, in which attendance in one year discouraged attendance in the next. Time dummies were replaced with meaningful variables: a linear time trend, t, whose values range from 0 at the start of the period to T at the end, as well as lagged values of the dependent variable, was used to identify attendance in previous years.
 $${\rm{prob}}\left( {{y_{it}}\, = 1} \right) = c + {a_0}t\, + \,{a_1}{y_{it - 1}}\, + \,{a_2}{y_{it - 2}}\, + \,{b_i}\, + \,{u_{it}}$$
A time trend variable, t, is formed by stacking N sequences on top of each other. Variable y -1, representing a single lag in the dependent variable, is generated by taking the values of the dependent variable for each individual for periods from 0 to T–1, adding an empty cell at the beginning and then stacking them as before (equation 3.1). A double lag variable, y -2, is captured by taking the values of the dependent variable for each individual for periods 0 to T–2, adding two empty cells at the beginning and then stacking them in the same way (equation 3.2). The estimated regression is
 $$y\, = \,c\, + \,{\sum _t}{a_t}{w_t}\, + \,{a_0}\,t\, + \,{a_1}\,{y_{ - 1}}\, + \,{a_2}\,{y_{ - 2}}\, + \,{\sum _\iota }\,{b_i}\,{x_i}$$
 $${\rm{where}}\,{\rm{for}}\,{\rm{some}}\,i\, = \,j,$$
b j = 0;
The parameters a 0, a 1, a 2, and b i are estimators of the parameters of the model represented by model 2.
As with model 1, actors with positive regression results were identified as having predominantly affective ties, while those with negative results were identified as having predominantly instrumental ties. This is as a result of the regression model starting from the point of the general up- and down-swell of attendance. It might be expected that those with a more instrumental relationship with the African Committee attended more regularly and independently “of the herd,” and particularly so when the slave trade was under threat, such as during war time, the abolition movement, or competition from the French.
The results of this panel regression are shown using visual analytics (bar charts, linear plots, and network cluster graphs), ensuring the results are easily accessible and readable. Footnote 31 The historical context is used to analyze these results.
Networking with a Network
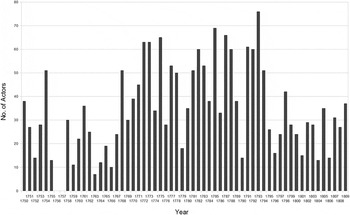
The number of active attendees from 1750 to 1809 by year is shown in figure 1. Footnote 32 It is clear that attendance was quite volatile and also relatively low in the 1750s and 1760s, just as Liverpool became dominant in the slave trade. There was much higher attendance in the 1770s and 1780s with the crises of the American War of Independence and the start of the abolition movement— which is what might be expected (although note that attendance was not as high during the Seven Years’ War [1756–1763]). Attendance was at its highest in 1793 with the outbreak of the French Wars and the credit crisis of that year. Footnote 33 What was not expected, however, was the relatively low attendance in the late 1790s, and especially the 1800s, when abolition became a real threat once more. What is interesting to note is the increasing attendance in 1808 and 1809, after abolition.
Number of active African Committee members, 1750–1809.
Source: 352/MD1, Committee Book of the African Company of Merchants.

Model 1
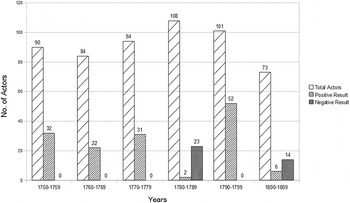
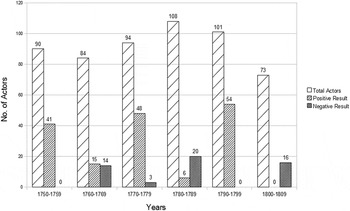
Applying model 1 to the attendance figures above immediately highlights that most statistically significant actors had affective (positive) ties with the African Committee over the entire period. Indeed, as highlighted in figure 2, actors had instrumental (negative) relationships only in the 1780s and 1800s. Given that the African Committee was primarily a trade association, this is surprising. In the early decades there were other outlets for socializing, such as the Ugly Face Club and the Mock Corporation of Sephton, which were used by many slave trade captains and merchants. However, these were also used for career progression to the town council, for example by William Boates or Ralph Earle, so perhaps the African Committee was not used instrumentally at this time. Footnote 34 Individuals clearly used the various institutions in very personal ways.
Total, affective, and instrumental ties with the African Committee, by decade.
Source: 352/MD1, Committee Book of the African Company of Merchants; model 1.
Note: The difference between the total and negative and positive actors are the nonstatistically significant actors identified in the regression analysis.

The crises of the 1780s severely affected members’ relations with the African Committee. Thirty-one members had affective ties in the 1770s but only two had such ties in the 1780s. In contrast, no actors had instrumental ties in the 1770s while twenty-three members had such ties in the 1780s. Clearly, more members were attending meetings more regularly and independently during the 1780s. The meetings were well attended in 1781, 1782, and 1783 during the American War of Independence, as might be expected (see figure 1). Attendance then fell in 1784 before rising again in 1785. The very high attendance of 1787 coincides with the formation of the Committee for the Abolition of the Slave Trade and the enactment of Dolben’s Bill in 1788. Others, however, have argued that the Liverpool Slave Traders were slow to react to abolition. Footnote 35 Fewer actors had instrumental ties in the 1790s when the abolition movement waned slightly, the French Wars began, and the 1793 credit crisis occurred. Footnote 36 However, the credit crisis was mitigated in Liverpool by the town council, on which many of those on the African Committee also served, so perhaps the latter did not need to be used in an instrumental way. Footnote 37 This may explain why fifty-two members used the African Committee through affective ties in the 1790s, which is more than in any other decade. That trend reversed drastically in the 1800s, when only six members used the African Committee for affective ties. Other opportunities did exist for more social networking; for example, the Lyceum was popular by the end of the period discussed here. However, drinking clubs, such as the Ugly Face Club and the Mock Corporation of Sephton, were in decline, and there was never much crossover between the Lyceum and the African Committee, so it is unlikely that African Committee members attended these institutions instead. Footnote 38 What is interesting is that so few members used the African Committee for instrumental reasons just as abolition was becoming a reality. However, it is possible that the elite slave traders had by then become an isolated clique, which discouraged others from attending. Footnote 39 Another explanation is that many merchants had varied business portfolios and were already redirecting their trade, having realized that abolition was a distinct possibility. Footnote 40
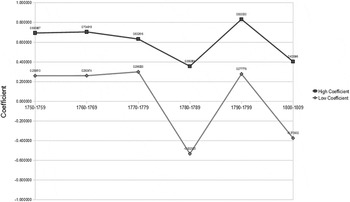
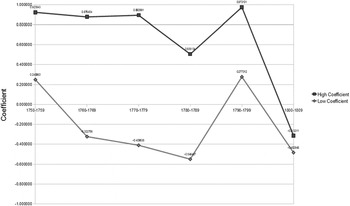
Another way to visualize the regression analysis is through the actors with the “most” affective or instrumental ties being shown as coefficients (that is, the strength of those ties). This is shown in figure 3, as those with the highest coefficient (most affective) and lowest coefficient (most instrumental) ties. Footnote 41 Both groups of actors followed a similar trend, thereby providing a subtler view. Figure 3 also demonstrates that both sets of actors used their ties in a relatively more instrumental way in the 1780s and 1800s, with both groups using their ties in a far more affective way in the 1790s. This highlights that actors accessed a networking institution for social and commercial reasons at the same time. It also supports the overall trend demonstrated in figure 2: some actors used the African Committee in times of crises. What is also interesting is that only six actors used the African Committee in a mostly affective way in the 1800s, while fourteen members exploited it for instrumental purposes. However, those few actors using it instrumentally did so to a far greater degree in the 1800s, and especially so in the 1780s. These actors may have been those with a greater (including proportional) investment in the slave trade and thus had more to defend, which might be expected. However, the lower number of actors who defended the trade in this period is surprising, given that Liverpool still dominated the British slave trade at this time. It is also possible, with reference to the higher attendance figures of 1808 and 1809 (see figure 1) that traders such as James Penny were trying to take advantage of other trading opportunities, such as palm oil, in West Africa. Footnote 42
Actors with the most affective and most instrumental ties, by decade.
Source: 352/MD1, Committee Book of the African Company of Merchants, and model 1.

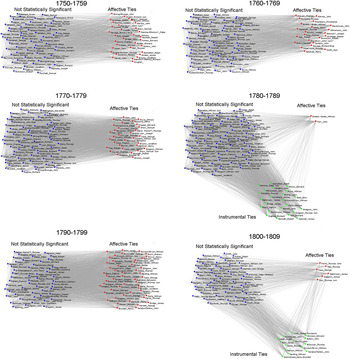
Another way to visualize regression analyses in this instance is by clustering the names of the individual actors by their type of use of the networking institution and by decade (figure 4). Actors on the left of figure 4 are statistically insignificant; actors on the top right had an affective (positive) relationship with the African Committee; and actors on the bottom right (where they exist) had an instrumental (negative) relationship.
Cluster analysis of actors with affective and instrumental ties, by decade.
Source: 352/MD1, Committee Book of the African Company of Merchants, and model 1.
Note: Network graphs produced using software developed by the authors (Haggerty and Haggerty, “Temporal Social Network Analysis for Historians”). Software such as Pajek or Gephi may also be used to make this approach more accessible to historians.

It is not possible here to analyze all these actors individually, but highlighting some key actors demonstrates the complexity of their relationships with this networking institution. One significant point is that not all of the major slave traders were found in the groupings of statistically significant actors. Moreover, major slave trading families were often split between those with affective and instrumental ties. For example, in the 1780s, Jonathon Blundell (zero voyages), the Gregsons (William Gregson, twenty-one voyages; William Gregson Jr., nineteen voyages; and William Gregson Sr., one voyage), and Peter Kennion Sr. (zero voyages) were not statistically significant actors, yet Thomas Hodgson Jr. (twenty-two voyages) and Ralph Earle (zero voyages) used the African Committee instrumentally. Footnote 43 Thomas Golightly (zero voyages) and Peter Kennion Jr. (zero voyages) each had instrumental (negative) relationships. The only two actors with affective (positive) ties in the 1780s were John Parr (zero voyages) and our old friend William Boates (twenty-nine voyages). What is interesting about William Boates is that he never used the African Committee in an instrumental way (he vacillated between affective ties and being nonstatistically significant), despite investing in at least 150 voyages as either captain or investor from the 1750s to the 1790s. We cannot say, therefore, that slave traders of a certain status or of a particular family used the African Committee in a certain way. Another example is the Blundells, leading slave traders before the American War of Independence, who did not use their ties with the African Committee in an instrumental manner, yet they were active members even after their investment in the slave trade (if not trade with the West Indies) had ended. Footnote 44 Similarly, the Peter Kennions are interesting because neither of them appeared to have ever invested in a slave trade voyage, although a John Kennion was involved in twenty-four voyages in the 1750s and 1760s, yet he only attended a meeting in 1753. Footnote 45 Edgar Corrie was not a slave trader and his Unitarianism inhibited him only so far in having links with related commercial activities. It did not stop him from trading in West Indian cotton or networking and owning shares in a privateering vessel with prominent slave traders Thomas Earle and Francis Ingram. Footnote 46 This shows that there was no straightforward link between the apparent raison d’etre of the African Committee and the way in which its members interacted with it.
At the same time, many members of the African Committee had affective ties with other institutions. In the 1750s, ten African Committee members, none of whom were statistically significant actors, were also members of drinking clubs. Footnote 47 In the 1760s, another eleven actors also used drinking clubs, but, of these, five had significant affective ties with the African Committee: William Boates (forty-two voyages), Thomas Hodgson Jr. (three voyages), Thomas Rumbold (thirty-five voyages), Robert Seel (zero voyages), and John Backhouse (six voyages). Footnote 48 The African Committee was neither their only institutional social outlet nor used for primarily instrumental reasons. This was not the case for all members, of course. In the 1800s, the Tarletons (John Tarleton Jr. (two voyages); John Tarleton (thirteen voyages) and Thomas Earle (eight voyages) moved from using the African Committee for affective ties to using it for instrumental ties. Some actors also moved from being nonstatistically significant to using the African Committee instrumentally. For example, Ralph Earle was statistically insignificant in the 1760s and 1770s but by the 1780s he was using the African Committee instrumentally. Another example is John Tarleton, who from the 1770s through to the 1790s was not statistically significant but in the 1800s was using the African Committee instrumentally. These actors were more likely to use the African Committee for commercial reasons throughout their membership and even more so in periods of crises, such as in the 1780s and 1800s. What these examples show is that it is not possible to simply say that those highly invested or involved in the slave trade were more likely to have instrumental ties with the African Committee. Clearly, these relationships were complex and individual.
Model 2
When regular persistence or intermittence in attendance is allowed, it becomes apparent that more members were using the African Committee in an instrumental way, and in more decades (figure 5). While in most decades there were more actors using the African Committee for affective ties, we again see a reversal in the crisis decades of the 1780s and 1800s. However, we also now see actors using the African Committee for instrumental ties in the 1760s and 1770s as well as the 1780s and 1800s. Testing for persistence highlights that more actors used the African Committee for commercial purposes by attending regularly, if intermittently, which is what might be expected from members of a trade association. If they did not attend one year, they were more likely to attend the next or the year after.
Total, affective, and instrumental ties with the African Committee, by decade.
Source: 352/MD1, Committee Book of the African Company of Merchants, and model 2.
Note: The difference between the total and negative and positive actors are the nonstatistically significant actors identified in the regression analysis.

The absence in the 1750s of instrumental ties, just as Liverpool became dominant in the slave trade, is still remarkable, especially when there were drinking clubs available for affective ties. However, in the 1760s, coinciding with the problems caused by the Seven Years’ War, there were nearly as many actors using the African Committee for commercial purposes as for social reasons. Attendance did increase during the war years (see figure 1) because commodities such as guns and ammunition, which were used for barter on the African coast, were banned from export, thereby causing problems for the slave traders. Footnote 49 This trend was reversed again in the 1770s, when far fewer members were using the African Committee instrumentally, despite the far higher attendance of that decade. With the continuance of the American Revolution and the onset of abolition during the 1780s, actors once again felt the need to attend more regularly in order to defend the trade and to deal with the adverse trading conditions. It is strange that actors used the African Committee only for affective ties in the 1790s, given the French Wars. However, at the same time, reduced calls for abolition resulted in the slave traders feeling more confident in their position. What is perhaps most interesting is that during the 1800s all statistically significant actors used the African Committee for instrumental ties. It could be that members were rallying in defense of the slave trade. Nonetheless, attendance remained high in 1808 and was even higher in 1809, which supports the supposition that a small number of actors came together to strategize trading with Africa following abolition.
This more nuanced relationship, highlighted in model 2, is also evident among actors with the most affective or instrumental ties (figure 6). These groups follow the same trend as in model 1 but they are more divergent—except in the 1800s, when all actors used their relationship with the African Committee instrumentally (all have a coefficient of < 0). It is worth noting that in the 1750s and 1790s, even actors with the most instrumental ties used them affectively (they had a coefficient of > 0). Again, the adverse trading conditions provided by the American War of Independence and the start of the abolition movement pushed both groups of actors to use their ties relatively more instrumentally in the 1780s and 1800s. The 1800s are particularly interesting because actors that previously used their ties instrumentally did so not only to a greater extent, but also some actors that previously used their ties affectively moved to using them instrumentally. No statistically significant actors are noted as using the African Committee affectively. The African Committee was no longer used for social purposes; it was now used for its proper purpose: as a trade association. How actors used the African Committee certainly changed over time.
Actors with the most affective and most instrumental ties, by decade.
Source: 352/MD1, Committee Book of the African Company of Merchants, and model 2.
Note: The lowest coefficients represent five actors (1750s), nine actors (1760s), two actors (1770s), one actor (1780s), one actor (1790s), and five actors (1800s). The highest coefficients represent one actor in each of the decades.

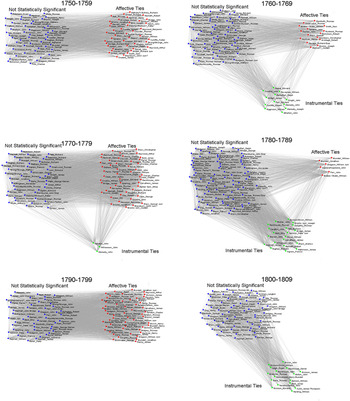
Looking at some case studies through cluster analysis further elucidates the complicated and personal nature of actors’ ties with the African Committee (figure 7). Being a major slave trader or part of a slave trading family did not necessarily mean that those actors accessed the African Committee for instrumental ties. In the 1760s, Thomas Gildart (zero voyages) was a statistically insignificant actor, while James Gildart (fourteen voyages) had instrumental ties. In the 1780s, William and Jonathon Blundell (zero and one voyages, respectively) had affective ties with the African Committee, yet Henry Blundell (zero voyages) was a statistically insignificant actor. Footnote 50 Only the Manesty family had a reasonably consistent relationship with the African Committee. One member of the family (John Manesty, Liverpool’s representative in London) used the African Committee instrumentally in the 1760s, 1770s, and 1780s. The Manestys were not identified as using the African Committee instrumentally under model 1, allowing for persistence identified different actors as well as in more decades.
Cluster analysis of actors with affective and instrumental ties, by decade.
Source: 352/MD1, Committee Book of the African Company of Merchants, and model 2.

A number of actors continued to actively interact with the African Committee even after they were no longer involved in the slave trade. Edward Deane (nine voyages), Robert Cunliffe (twenty-two voyages), and the Manestys (a combined seventeen voyages) were involved in slave trading in the 1750s but not after 1761. These men appear to be the old guard who had a strong affinity with the African Committee and so continued to access it for affective ties. Alternatively, they could have provided goods for barter on the Slave Coast and yet not invest in slave trade vessels. In contrast, William Devaynes, who was never involved in the slave trade, had an instrumental relationship with the African Committee in the 1760s.
Only three actors were identified as having an instrumental relationship in the 1770s. Of these, John Manesty was the only one who attended during the American War of Independence, presumably to report on discussions in the capital. John Williamson (zero voyages) and John Tarleton (eight voyages) did not attend during the war when the slave trade was curtailed, even though Tarleton was involved in voyages in 1775 and 1779. This confirms that their attendance was firmly linked to their commercial activities. As previously noted, some actors moved from being statistically insignificant to using the African Committee instrumentally. One such actor was John Knight, who moved from the former in the 1750s to the latter in the 1760s. It is clear that actors moved as a group toward instrumental ties in times of crises, especially in the 1780s and the 1800s. The use of the African Committee in the latter decade is especially interesting. Of those using it instrumentally, only John Tarleton showed a proclivity to attend in the second half of the decade, particularly in 1807, 1808, and 1809. Indeed, James Cukit (zero voyages) joined only in 1805 and attended in 1807 and 1809. Roger Leigh (four voyages) attended in 1803 and again in 1808 and 1809. It is ironic that in the decade of abolition, and especially after 1807, the African Committee was used mainly for instrumental purposes, after its original raison d’etre had passed. No doubt those actors were trying to develop new trades on the African coast. Overall, however, it is clear that actors used the African Committee in different ways in different periods of time, depending on their need within the wider context.
Conclusion
The role of a metropolitan business network changes over time, and this is reflected in the relationships that actors had with the African Committee. Previous research has focused on the relationships within such networks between actors using social network analysis tools and techniques. This article brings together history, regression analysis, and visual analytics in a novel interdisciplinary methodology to investigate how and why actors use formal networking institutions such as trade associations. In doing so, it identifies that actors have two types of relationship with a network; those with instrumental ties principally use a network to access tangible resources and information, while those with affective ties use it primarily for social support, pleasure, and identity conferral. We understand, of course, that many actors may use trade associations for both types of ties and to differing degrees.
Although it might be expected that members of the African Committee would mostly have instrumental ties with this trade association, in fact most actors had affective ties between 1750 and 1810. A smaller number of actors had primarily instrumental ties, which grew relatively stronger in periods of crisis, and some actors even moved to having instrumental ties during these periods. However, many actors moved between strong ties in both directions and being statistically insignificant. It is clear that how actors use such institutions for commercial networking must be further researched. It is no longer correct to accept that such institutions were always a simple economic good; indeed, many actors stopped attending just when the slave trade was under threat. It must also be acknowledged that individual actors used these institutions in a variety of ways and according to their individual needs and the prevailing economic context. Of course, many actors may have joined the African Committee for both social and commercial reasons, and their wavering attendance patterns highlight these overlapping ties.
This methodology and case study has highlighted certain broad features of actors’ networking with commercial networking institutions:
-
• Many actors have predominantly affective ties, engaging with an institution only in popular periods.
-
• Therefore, many actors use such institutions for social rather than commercial reasons.
-
• As a group, actors may respond positively to crises and thereby use institutions more instrumentally; this may be by attending more often with the herd or more independently.
-
• Many actors also desert such organizations during periods of crises because they do not want to contribute more instrumentally, just when they are needed most.
-
• Kinship or family ties do not determine how actors will use an institution.
-
• A wide range of factors determine how individual actors interact with an institution.
We believe that the methodology presented here demonstrates for the first time that it is possible to measure actors’ relationships with a networking institution rather than with each other. Two models were presented, one which measures the propensity to attend when others did, and one which added a time lag factor that measured a delayed but persistent attendance (or, possibly, alternation). Bringing together economics, visual analytics, and history means that the results were produced in a visually appealing and easily accessible way. This methodology also recognized the complexity and individuality of institutional networking.
This methodology can easily be used to measure not only actors’ relationships with other commercial institutions, such as guilds, chambers of commerce, or town councils, but also to measure relationships with social and cultural institutions, such as libraries or religious societies. It can also be used where long-run membership of an institution is available and is suitable for either small or large datasets. Membership attendance data can readily be transferred into a panel data format (whether members were present or absent). Such data can be analyzed within existing and freely available statistical packages, such as GRETL. The regressions can then easily be exported for visual analysis to other available software, such as Microsoft Excel, Pajek, or Gephi. Using regression analysis in this manner means that this methodology can be used as part of iterative and explorative processes.