INTRODUCTION
Anthropogenic disturbance has severely reduced forest cover worldwide, and such habitat loss and associated fragmentation is widely recognized as the major cause of global biodiversity loss (Murcia Reference Murcia1995; Veldman et al. Reference Veldman, Mostacedo, Peña-Claros and Putz2009; Ahrends et al. Reference Ahrends, Burgess, Milledge, Bulling, Fisher, Smart, Clarke, Mhoro and Lewis2010; Laurance et al. Reference Laurance, Camargo, Luizao, Laurance, Pimm, Bruna, Stouffer, Williamson, Benitez-Malvido, Vasconcelos, Van Houtan, Zartman, Boyle, Didham, Andrade and Lovejoy2011). Much of the remaining habitat, however, experiences chronic anthropogenic disturbance (CAD sensu Singh Reference Singh1998) that does not result in habitat loss and fragmentation. Such disturbance includes firewood collection, exploitation of non-timber products, hunting, overgrazing by livestock and intentional introduction of invasive plant species (Martorell & Peters Reference Martorell and Peters2005). Moderate levels of CAD can actually promote diversity (Connell Reference Connell1978; Grime Reference Grime1979), but high levels typically have negative impacts (Singh Reference Singh1998).
The ecological impacts of CAD have received far less research attention than those associated with acute disturbances that lead to extensive habitat loss. CAD can have a major effect on vegetation structure (Sagar et al. Reference Sagar, Raghubanshi and Singh2003; Shaanker et al. Reference Shaanker, Ganeshaiah, Krishnan, Ramyar, Meera, Aravind, Kumar, Rao, Vanaraj, Ramachandra, Gauthier, Ghazoul, Poole and Chinappa Reddy2004; Ribeiro et al. Reference Ribeiro, Arroyo-Rodríguez, Santos, Tabarelli and Leal2015), and can also disrupt key ecological processes such as seed dispersal (Leal et al. Reference Leal, Andersen and Leal2014) and plant-protection against herbivores (Leal et al. Reference Leal, Andersen and Leal2015). Disruptions of such processes cause shifts in the functional composition of trees, from long-lived, highly specialized species to disturbance-tolerant, short-lived generalized species (Sagar et al. Reference Sagar, Raghubanshi and Singh2003; Uniyal et al. Reference Uniyal, Pokhriyal, Dasgupta, Bhatt and Todaria2010; Ribeiro et al. Reference Ribeiro, Arroyo-Rodríguez, Santos, Tabarelli and Leal2015; Ribeiro et al. Reference Ribeiro, Santos, Arroyo-Rodríguez, Tabarelli, Souza and Leal2016). However, there have been few studies of the impact of chronic disturbances on faunal diversity (Ribeiro-Neto et al. Reference Ribeiro-Neto, Arnan, Tabarelli and Leal2016).
Ants have attracted considerable attention in disturbance studies because they are such a globally dominant faunal group and a popular bio-indicator in land management (Hoffmann & Andersen Reference Hoffmann and Andersen2003; Andersen & Majer Reference Andersen and Majer2004). CAD can cause major shifts in ant species and functional composition, even with little or no change in overall species richness (Hoffmann Reference Hoffmann2010; Franklin Reference Franklin2012). Such shifts can be directly caused by habitat change, but can also be mediated by changes in the abundance of dominant species, which result in cascading indirect effects on subdominant and subordinate groups (Bestelmeyer & Wiens Reference Bestelmeyer and Wiens1996; Hoffmann & Andersen Reference Hoffmann and Andersen2003; Andersen & Majer Reference Andersen and Majer2004) and on ecological interactions (Leal et al. Reference Leal, Andersen and Leal2014; Leal et al. Reference Leal, Andersen and Leal2015). Ant communities show predictable replacement of disturbance ‘losers’ (disturbance-sensitive taxa) by disturbance ‘winners’ (disturbance-adapted taxa; see Tabarelli et al. Reference Tabarelli, Peres and Melo2012), with disturbance typically favouring open-adapted taxa at the expense of highly specialized, forest-associated functional groups (Andersen Reference Andersen, Agosti, Majer, Alonso and Shultz2000; Hoffmann & Andersen Reference Hoffmann and Andersen2003; Beaumont et al. Reference Beaumont, Mackay and Whalen2012; Leal et al. Reference Leal, Filgueiras, Gomes, Iannuzzi and Andersen2012). At a regional scale, disturbance is a secondary driver of variation in ant communities that is determined primarily by soil type, and ant responses to disturbance can vary markedly with soil type (Hoffmann & Andersen Reference Hoffmann and Andersen2003; Hoffmann Reference Hoffmann2010; Ribeiro-Neto et al. Reference Ribeiro-Neto, Arnan, Tabarelli and Leal2016).
We examined ant community responses to CAD and its interaction with soil type in semi-arid Caatinga of north-eastern Brazil. We assessed the effects of CAD on both species and functional diversity, focusing on three key questions. First, what is the magnitude of effects of disturbance compared with those of soil type as the putative primary driver of local variation in ant communities? Second, to what extent do the effects of disturbance vary with soil type? Third, to what extent does functional composition show predictable winner–loser replacement involving the loss of highly specialized, forest-associated functional groups?
MATERIALS AND METHODS
Study site
Caatinga vegetation consists of mosaics of seasonally dry tropical forest (sensu Pennington et al. Reference Pennington, Lavin and Oliveira-Filho2009) and scrub (Velloso et al. Reference Velloso, Sampaio and Pareyn2002) covering 826 411 km² of north-eastern Brazil (Brasil-MMA 2011). It is one the world's most biodiverse and densely populated semi-arid regions, with more than 23 million people at a density of 26 inhabitants/km² (INSA 2012). Nearly 10 million m3 year−1 of firewood and charcoal are obtained via exploitation of native vegetation (Gariglio et al. Reference Gariglio, Sampaio, Cestaro and Kageyama2010), and there are more than 16 million goats (IBGE 2010). Collectively, slash-and-burn agriculture, firewood collection, overgrazing and hunting impose a continuum of degradation varying from relatively minor biomass reduction to complete desertification (Leal et al. Reference Leal, Silva, Tabarelli and Lacher2005; Brasil-MMA 2011; Ribeiro et al. Reference Ribeiro, Arroyo-Rodríguez, Santos, Tabarelli and Leal2015).
Our study was conducted in a continuous patch of Caatinga vegetation near Parnamirim city (8°5’S; 39°34’W; 393 m asl) in Pernambuco state. The climate is semi-arid, with an average temperature of 26°C and most of the 550 mm mean rainfall falling between January and May (IBGE 1985). The soils are predominantly non-calcic brown soils, planosols (clay soils) and regosols (a sandy soil; IBGE 1985). The human population size in the immediate Parnamirim region is approximately 20 000, with about half living in rural areas (IBGE 2011).
We established 47 plots (average ± standard deviation distance between plots 7 ± 4.4 km) on two soil types (26 on sand and 21 on clay) and representing a range of intensities of anthropogenic disturbance. Areas that had experienced acute rather than chronic disturbance, such as slash-and-burn agriculture, were not included. Vegetation cover tended to be higher on clay than on sandy soil (t = 2.7026, df = 23, p = 0.006).
Measurement of disturbance
We used the five measurements of disturbance that have been previously described for the study plots (Leal et al. Reference Leal, Andersen and Leal2014), based on surrogates related to population density and intensity of land use, which tend to decrease with increasing distance from cities and roads (Ahrends et al. Reference Ahrends, Burgess, Milledge, Bulling, Fisher, Smart, Clarke, Mhoro and Lewis2010). These surrogates were: the number of people (‘people’) and combined number of cattle and goats (‘stock’) in the farms within 2 km of each plot; the distance to the nearest road (‘distance to road’); the distance to the nearest farm (‘distance to farm’); and the distance to Parnamirim (‘distance to city’) (Leal et al. Reference Leal, Andersen and Leal2014; Ribeiro et al. Reference Ribeiro, Arroyo-Rodríguez, Santos, Tabarelli and Leal2015). People (W = 315, p = 0.824), stock (W = 268.5, p = 0.466) and distance to road (W = 289.5, p = 0.366) did not vary with soil type (Wilcoxon matched-pair tests), whereas distance to farm (W = 451, p < 0.001) and distance to city (W = 199, p = 0.050) tended to be lower for sites with clay soils.
Ant sampling and functional classification
Ants were sampled using six pitfall traps (13 cm height and 12 cm diameter) with 10 m spacing in each plot. Traps were partly filled with a 90% ethanol solution, and were operated for a 48-hr period. Twenty-four of the plots (13 on clay and 11 on sand) were sampled from February to May 2010, and the remaining 23 (eight on clay and 15 on sand) were sampled from March to May 2013. All ants were sorted into species and, where possible, named. Unnamed species were assigned code numbers that apply only to this study. A complete set of mounted voucher specimens is held in the ant collection at Universidade Federal de Pernambuco (Pernambuco, Brazil).
For classifying ant species into functional groups we adapted Andersen's (Reference Andersen1995) widely used scheme based on global-scale responses of ants to environmental stress and disturbance (see also Andersen Reference Andersen1997; Hoffmann & Andersen Reference Hoffmann and Andersen2003) to be more specific to the regional fauna. Our groups were: Army Ants (species of Neivamyrmex and Nomamyrmex); Dominant Dolichoderinae (primarily Dorymyrmex), Fire Ants (Solenopsis subgenus Solenopsis); Generalized Myrmicinae (Pheidole, Crematogaster, Monomorium and Solenopsis subgenus Diplorhoptrum), Lower Attini (Cyphomyrmex); higher Attini (Acromyrmex); Opportunists (Brachymyrmex, Ectatomma, Gnamptogenys, Nylanderia and Tapinoma); Specialist Predators (Dinoponera, Leptogenys, Ponera and Thaumatomyrmex); Subordinate Camponotini (Camponotus); and Tree Specialists (Myrmelachista, Cephalotes and Pseudomyrmex; see Table S1 for a comprehensive classification).
For each plot, we quantified the abundance of each species as the number of traps in which they occurred (i.e., frequency of occurrence), ranging from one to six per plot. For functional groups we combined frequencies of occurrence of their constituent species.
Statistical analysis
To avoid multi co-linearity between the predictor variables, we first ran an analysis of variance inflation factor (VIF) of each predictor using the car package for R version 3.2.4 (R Core Team Reference Core Team2015). The highest VIF was 2.7, which indicates no co-linearity (Neter et al. Reference Neter, Wasserman and Kutner1990) and therefore allowing them all to be included in our models.
To test the effects of soil type and the five disturbance measures on each response variable we used a multi-model inference approach (Burnham & Anderson Reference Burnham and Anderson2002) that ranks all mathematical models (i.e., models built with all possible combinations of the six explanatory variables excluding interactions) according to the Akaike Information Criterion (AIC). To evaluate the strength and relative importance of soil type and the various disturbance measures we then computed model averaged parameter estimates (averaged across the whole set of models) based on the Akaike weights (W), which represent the probability that a given model is the best model for the data. Then, for each of the six explanatory variables (averaged across the whole set of models), we calculated: (1) β as a measure of effect direction and size (Grueber et al. Reference Grueber, Nakagawa, Laws and Jamieson2011); (2) sum of W (∑W), which represents the probability that a predictor variable affects the response variable; and (3) the relative importance of the variables (which combines effect size and the weights of a predictor). A multi-model inference approach (with averaged parameters) is more stable and reliable than inference based on a unique best model chosen among the several possible candidates (Burnham & Anderson Reference Burnham and Anderson2002; Grueber Reference Grueber, Nakagawa, Laws and Jamieson2011).
For the count data, we used generalized linear models with a Poisson error distribution and log-link function, and the AIC for overdispersed count data corrected for small sample sizes (QAICc) instead of AIC (Burnham & Anderson Reference Burnham and Anderson2002; Grueber et al. Reference Grueber, Nakagawa, Laws and Jamieson2011). We also transformed data to a mean of zero and standard deviation of 0.5 (Gelman Reference Gelman2008). Using this transformation, all parameter estimates are set to the same scale allowing the comparison between categorical and continuous predictors (Hereford et al. Reference Hereford, Hansen, Houle and Fenster2004; Gelman Reference Gelman2008; Schielzeth Reference Schielzeth2010). We also estimated the goodness-of-fit of the models by calculating the adjusted R2 considering log likelihood for the full model (soil type and five disturbance measures) and the null model (only the intercept) according to Magee (Reference Magee1990) and Nagelkerke (Reference Nagelkerke1991). All analyses were performed using the packages arm and MuMIn for R (R Core Team Reference Core Team2015).
We evaluated variation in ant species composition in relation to soil type and disturbance using Canonical Correspondence Analysis (CCA) (Ter Braak Reference Ter Braak1986; Legendre et al. Reference Legendre, Oksanen and ter Braak2011). The analysis was performed for all sites combined to assess soil type and disturbance effects, and also separately for each soil type to assess differential disturbance effects according to soil type, and was based on frequency data, considering only those species that occurred in at least five plots to avoid any bias caused by rare species. We performed a randomization test (10 000 aleatorizations) to obtain the statistical significance of our explanatory variables (Legendre et al. Reference Legendre, Oksanen and ter Braak2011). These analyses were repeated for functional group composition (based on functional group abundance), again considering only those functional groups with more than one constituent species. The analyses were performed using the packages Vegan and BiodiversityR for R (R Core Team Reference Core Team2015).
RESULTS
We recorded 53 ant species from 27 genera and seven subfamilies. Myrmicinae (24 species) and Formicinae (12) were the richest subfamilies, and Pheidole (11) and Camponotus (eight) the richest genera (Table S1). Thirteen (25%) species were recorded in only one plot and 10 (21%) were found in more than 30 plots, with Solenopsis globularia the most frequent (46 plots). The richest functional groups were Generalized Myrmicinae (16 species), Subordinate Camponotini (eight) and Opportunists (seven). Ant species richness was slightly higher on sandy (14.5 ± 2.98, mean ± standard deviation) than clay soils (12.6 ± 3.2; t = 2.1605, df = 45, p = 0.036). Twelve species occurred only on sandy and six species only on clay soil.
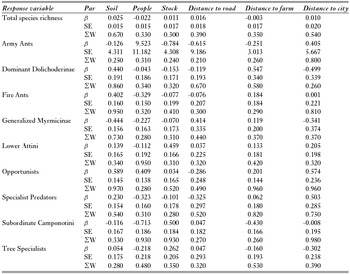
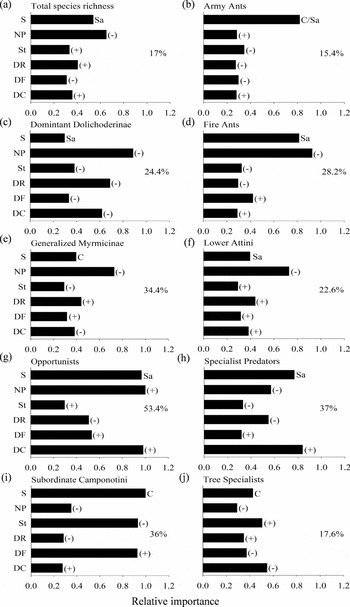
Our full model explained 17% of the variance in ant species richness. Soil type showed the strongest effect on total species richness and, amongst the five CAD metrics, only human population size and distance to farm exerted a significant (in both cases negative) effect on total ant species richness (Table 1). Soil type was a more important predictor of total ant species richness than any disturbance measure (Table 1 and Fig. 1 (a)). Among disturbance measures, human population size was the most important predictor, and livestock and distance to farm the least important (Fig. 1 (a)).
Model-averaged effect size (β), unconditional standard error (SE) and the sum of Akaike weights (∑W) for the effects of soil type and five chronic anthropogenic disturbance metrics on ant total species richness and ant functional group abundance in Caatinga ecosystems. Par = Averaged parameter of the model.

Relative importance of soil type and five chronic anthropogenic disturbances as predictors of total ant species richness and ant functional group abundance in Caatinga ecosystems from northeast Brazil. Signal (+/−) depicts the direction of model-averaged effect size (β) for each variable and percentage alongside each graph depicts the proportion of variation on data explained by the full model. Total species richness was higher on sand than clay. The letter (C = clay soil; Sa = sandy soil) next to the column for soil effect depicts the soil type with higher functional group abundance. DC = Distance to Parnamirim city; DF = Distance to the nearest farm; DR = Distance to the nearest road; NP = Number of people; S = Soil type; St – Stock (goats and cattle summed).

For functional groups, full models explained between 15.4% (Army Ants) and 53.4% (Opportunists) of the variation in functional group abundance. Soil type was the strongest predictor of the abundance of three functional groups (Fire Ants, Generalized Myrmicinae and Opportunists), human population size and distance to city were each the strongest predictors for two functional groups, and distance to farm and stock size were each the strongest predictor of one functional group each (Table 1). Soil type presented higher ∑W than any disturbance measure in four out of the nine functional groups considered. For the five remaining functional groups, distance to city (for Army Ants and Subordinate Camponotini), distance to farm (for Specialist Predators and Tree Specialists) and human population size (for Lower Attini) presented higher ∑W than soil type (Table 1). The relative importance (which combines effect size and the weights of a predictor) of predictor variables for functional group abundance varied markedly (Fig. 1 (b)–(j)). For example, soil was the most important factor in models for Dominant Dolichoderinae, Fire Ants, Generalized Myrmicinae, Lower Attini and Opportunists, while distance to city (for Specialist Predators and Tree Specialists) and distance to farm (for Army Ants and Subordinate Camponotini) achieved higher relative importance than soil type for two functional groups each (Fig. 1 (b)–(j)).
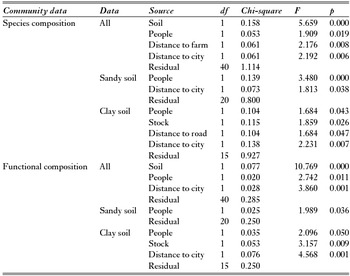
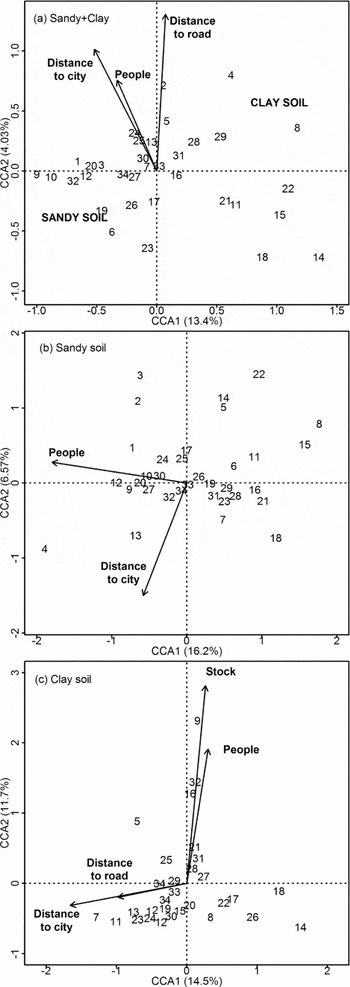
CCA showed that sandy and clay soils supported distinct ant communities (F = 5.659, df = 1, p < 0.001) and, orthogonal to the soil effect, variation in species composition was significantly correlated with human population size and distance to roads and city (see Table 2 for significant results and Table S2 for complete CCA results; Fig. 2 (a) and Fig. S1 (a)). The abundances of Pseudomyrmex termitarius and Pheidole obscurithorax were negatively related to human population size and to the distances to road and city. Different sets of disturbance surrogates were related to ant communities from each soil type (Table 2). At sandy sites (Fig. 2 (b) and Fig. S1 (b)), communities varied in relation to human population size (positively related to Gnamptogenys sulcata abundance) and distance to city (negatively related to the abundance of several species of Pheidole). At clay sites (Fig. 2 (c) and Fig. S1 (c)), communities varied in relation to human population size and stock size (with Gnamptogenys sulcata, Ectatomma muticum and Cyphomyrmex sp. increasing in abundance), and to distances to road and city (with Gnamptogenys moellery and Solenopsis tridens increasing in abundance).
Influence of soil type and the five chronic disturbance metrics on species and functional composition (based on 10 000 randomizations in a Canonical Correspondence Analysis). Only significant results are shown.

Associations between soil type and five anthropogenic disturbance metrics and species composition considering both sand and clay soil types combined (a; centroids for soil types are depicted as sandy soil and clay soil) and separately for sand (b) and clay (c) according to CCA. Only variables significantly related to ant species composition according to a randomization test based on 10 000 randomizations are shown. 1 = Nylanderia sp. 1; 2 = Pheidole sp. 7; 3 = Cyphomyrmex transversus; 4 = Pheidole sp. 9; 5 = Pheidole radoskowiskii; 6 = Camponotus atriceps; 7 = Gnamptogenys moellery; 8 = Crematogaster sp. 1; 9 = Gnamptogenys sulcata; 10 = Acromyrmex rugosus; 11 = Pheidole sp. 8; 12 = Pheidole sp. 4; 13 = Camponotus cingulatus; 14 = Pseudomyrmex termitarius; 15 = Pheidole sp. 3 grupo flavens; 16 = Cyphomyrmex sp. 1; 17 = Dorymyrmex spurius; 18 = Pheidole obscurithorax; 19 = Dorymyrmex thoracicus; 20 = Solenopsis geminata; 21 = Camponotus (Myrmaphaenus) sp. 2; 22 = Crematogaster sp. 2; 23 = Solenopsis tridens; 24 = Pheidole sp. 5; 25 = Brachymyrmex patagonicus; 26 = Forelius pusillus; 27 = Pheidole diligens; 28 = Camponotus crassus; 29 = Pheidole prox jelskii; 30 = Camponotus blandus; 31 = Camponotus (Tanaemyrmex) sp. 1; 32 = Ectatomma muticum; 33 = Solenopsis globularia; 34 = Dinoponera quadriceps.

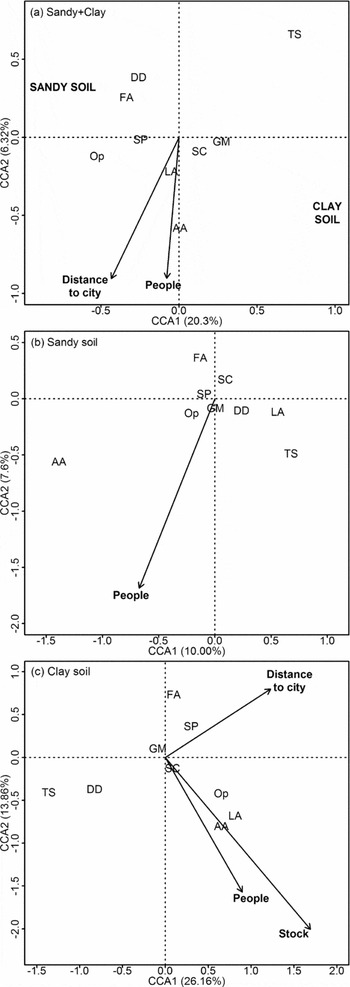
The two soil types also supported very distinct ant communities in terms of functional group composition, with Dominant Dolichoderinae, Fire Ants, Opportunists and Specialist Predators all having higher abundance on sandy soils (Table 2 for significant results and Table S2 for complete CCA results; Fig. 3 (a) and Fig. S2 (a)). The relationship between functional group composition and disturbance metrics varied markedly between the two soil types. On sandy soils, the abundances of different functional groups showed very weak relationships with disturbance surrogates (Fig. 3 (b) and Fig. S2 (b)). However, on clay soils the abundances of Opportunists, Lower Attini and Army Ants were positively related to the local densities of people and stock, and the abundances of Dominant Dolichoderinae and Tree Specialists were negatively, and that of Specialist Predators positively, related to distance to city (Fig. 3 (c) and Fig. S2 (c)).
Associations between soil type and five anthropogenic disturbance metrics on functional group composition considering both sand and clay soil types combined (a; centroids for soil types are depicted as sandy soil and clay soil) and each separately (b and c), according to CCA. Only variables that were significantly related to functional group composition according to a randomization test based on 10000 randomizations are shown. AA = Army Ants; DD = Dominant Dolichoderinae; FA = Fire Ants; GM = Generalized Myrmicinae; LA = Lower Attini; Op = Opportunist; SP = Specialist Predator; SC = Subordinate Camponotini; TS = Tree Specialists.

DISCUSSION
Our study sought to examine ant community responses to CAD and its interaction with soil type in a densely populated semi-arid ecosystem. We found that CAD has a secondary effect on patterns of ant diversity and composition in Caatinga, which are influenced primarily by soil type. Ant communities on the two soil types were different functionally as well as taxonomically, with Dominant Dolichoderinae, Fire Ants, Opportunists and Specialist Predators all more abundant at sandy sites.
Soil has important direct effects on ant communities through its role as a nesting and foraging substrate (Hölldobler & Wilson Reference Hölldobler and Wilson1990; Kaspari & Weiser Reference Kaspari and Weiser1999; Hoffmann Reference Hoffmann2010). Clay soils typically support distinct ant communities because of their poor drainage and propensity for waterlogging (Andersen et al. Reference Andersen, Del Toro and Parr2015). Soil also has important indirect effects on ant communities as a primary driver of vegetation structure. In Caatinga, sandy soils harbour plant communities that are less diverse and have lower vegetation cover than those of clay soils (Silva et al. Reference Silva, Santos, Tabarelli, Leal, Tabarelli and Silva2003). Notably, Dominant Dolichoderinae were more species rich on sandy soils, which reflects its strong preference for open habitats (Andersen Reference Andersen1995). By contrast, Generalized Myrmicinae and Subordinate Camponotini were more diverse and abundant on clay soils. These two groups are behaviourally subordinate to Dominant Dolichoderinae and are competitively limited by them (Andersen & Patel Reference Andersen and Patel1994; Arnan et al. Reference Arnan, Gaucherel and Andersen2011); it is therefore possible that the association of generalized Myrmeicinae and Subordinate Camponotini with clay soils reflects competitive interference from Dominant Dolichoderinae on sandy soils.
CAD had complex effects on ant richness and composition, and these effects varied markedly between soil types. Ant communities on clay soils had stronger associations with disturbance measures than those on sand. Although this may reflect intrinsic differences in ecosystem resilience between the soil types given the differences in plant and ant composition, we suspect that it more likely reflects higher levels of disturbance on clay. Clay soils have higher fertility than sandy soils, and are therefore likely to be preferentially selected for use. They also tended to be closer to farms and to Parnamirim city, which would also tend to make them more intensely used.
Previous studies of ant responses to disturbance in other biomes show predictable winner–loser replacement in relation to disturbance, typically involving the proliferation of highly generalized species and loss of highly specialized, forest-associated taxa (Andersen Reference Andersen1997; Hoffmann & Andersen Reference Hoffmann and Andersen2003; Leal et al. Reference Leal, Filgueiras, Gomes, Iannuzzi and Andersen2012). In our study, ant functional composition was only weakly related to CAD on sandy soils. However, on clay soils it showed winner–loser replacement that is consistent with previous studies (Ribeiro-Neto et al. Reference Ribeiro-Neto, Arnan, Tabarelli and Leal2016), with the abundance of Opportunist (disturbance winners) increasing with CAD, and that of Specialist Predators (disturbance losers) decreasing.
In conclusion, we have shown that CAD reduces ant species richness in Brazilian Caatinga, and can also substantially re-organize the functional composition of ant communities. However, this varies markedly with soil type. Soil type therefore not only affects ant communities directly as a nesting and foraging substrate, and indirectly through vegetation type, but also indirectly by determining the level of disturbance experienced. Our study more generally highlights the importance of considering context dependence when evaluating biodiversity responses to disturbance.
ACKNOWLEDGEMENTS
This study was funded by Fundação de Amparo a Pesquisa à Ciência e Tecnologia do Estado de Pernambuco (FACEPE, n° 0140–2.05/08) and Conselho Nacional de Desenvolvimento Científico e Tecnológico (CNPq, n° 772902009-4). The authors acknowledge the Estação de Agricultura Irrigada de Parnamirim for logistic support, the landowners for providing the permits for working on their properties. E. M. S. Santos, K. Demétrio, K. R. Pereira, L. C. Leal and G. B. Arcoverde provided essential help during the fieldwork. F. M. P. de Oliveira and J.D. Ribeiro-Neto thank CNPq for their scholarship and I.R. Leal thanks CNPq for research grants and ‘Coordenação de Aperfeiçoamento de Pessoal de Nível Superior’ (CAPES) for a post doctorate fellowship.
Supplementary material
To view supplementary material for this article, please visit http://dx.doi.org/10.1017/S0376892916000291