





1. Introduction
Starting from the end of 2019, the coronavirus (COVID-19) outbreak, caused by a novel coronavirus known as the Severe Acute Respiratory Syndrome Coronavirus 2 (SARS-CoV-2) (Gorbalenya et al. Reference Gorbalenya2020), has been rapidly spreading in almost every country around the world. The SARS-CoV-2 pandemic has intensified preventive measures such as keeping social distancing, using masks and other personal protective equipment (PPE). However, the debate and discussions on the various prevention guidelines have been going on for more than two years now. Therefore, understanding the main transmission mechanism of SARS-CoV-2 is very important to control the pandemic and to combat future respiratory disease outbreaks. In addition to direct human contact or indirect contagion through other intermediate objects, airborne transmission through respiratory droplets plays a crucial role in spreading infectious diseases. The viruses in these respiratory droplets can reach susceptible people directly or indirectly.
It is now a general consensus that aerosol is one of the main source media for pathogen transmission, as the concentration of SARS-CoV-2 RNA appears significant in the range of airborne aerosol size below  $2.5\ \mathrm {\mu } {\rm m}$ (Liu et al. Reference Liu2020). The dynamics and mechanism of virus transmission by aerosol have not been fully understood yet, as much effort has been devoted to study the dynamics of microscale droplets in air since the SARS-CoV-1 pandemic (Wang et al. Reference Wang, Zhang, Sun, Liu, Hu and Xu2005) broke out. Since then, researchers have focused on the virus transmission dynamics through droplet dispersion and aerosol transport, including exhale velocity, droplet size, turbulent flows, temperature, humidity and droplet-nucleus dynamics (e.g. Gupta, Lin & Chen Reference Gupta, Lin and Chen2009; Jiang et al. Reference Jiang, Zhao, Li, Yang, Zhang and Zhang2009; Gralton et al. Reference Gralton, Tovey, McLaws and Rawlinson2011; Van Sciver, Miller & Hertzberg Reference Van Sciver, Miller and Hertzberg2011; Bourouiba, Dehandschoewercker & Bush Reference Bourouiba, Dehandschoewercker and Bush2014; Techet, Scharfman & Bourouiba Reference Techet, Scharfman and Bourouiba2015; Scharfman et al. Reference Scharfman, Techet, Bush and Bourouiba2016; Wei & Li Reference Wei and Li2017; Balachandar et al. Reference Balachandar, Zaleski, Soldati, Ahmadi and Bourouiba2020). Understanding the basic hydrodynamics of exhaled droplets carrying viruses is very important for predicting the transportation and destination of droplets and the potential threats related to the spread of infectious diseases, and will provide quantitative guidance for formulating public health policies to alleviate diseases, such as social distancing and facial coverings in various indoor and outdoor environments (Dbouk & Drikakis Reference Dbouk and Drikakis2020; Verma, Dhanak & Frankenfield Reference Verma, Dhanak and Frankenfield2020).
Respiratory droplets are expelled during human exhalation events, like talking, coughing and sneezing, or even simply breathing (Asadi et al. Reference Asadi, Bouvier, Wexler and Ristenpart2020; Bourouiba Reference Bourouiba2020; Mittal, Ni & Seo Reference Mittal, Ni and Seo2020), which could contain viral particles released by infected individuals. Traditionally, respiratory droplets can be grouped into large droplet group ( ${\geqslant }5 \ \mathrm {\mu }{\rm m}$) and small aerosol group (
 ${<}5\ \mathrm {\mu }{\rm m}$) based on the size of the droplets (Anderson et al. Reference Anderson, Turnham, Griffin and Clarke2020). Large droplets tend to accelerate downwards quickly by gravitational force and settle down to the ground (Prather et al. Reference Prather, Marr, Schooley, McDiarmid, Wilson and Milton2020), which is the primary reason for various different social distancing measures introduced in different countries around the world to minimize the risk of infection at close range. Although there are no uniform guidelines on keeping distance, the currently used social distance varies at 1.5 m, 1.8 m or 2 m, depending on different guidelines in different countries. This is mainly designed to avoid large droplet spray while meeting the practical feasibility of maintaining a safe distance in daily life. Conversely, compared with the large droplets, small aerosols will evaporate, leaving residues that may contain virus aggregates, proteins and inorganic salts (Bourouiba Reference Bourouiba2020), which exist in the atmosphere for a longer time and may be transported by wind or airflow from an air conditioner for longer distances (Stadnytskyi et al. Reference Stadnytskyi, Bax, Bax and Anfinrud2020). In summary, it can be said that the droplet concentration, droplet size distribution and initial droplet velocity are the main factors that are responsible for the respiratory transmission activities. For example, compared with breathing and talking, coughing and sneezing reportedly have higher droplet concentration and initial velocity, and thus they are the main channels for airborne virus transmission.
It is of pragmatic importance to study the trajectory of these respiratory droplets, so that people can roughly estimate the range of the droplets after the carrier falls off. The pioneering work on the distribution and flow dynamics of droplets can be traced back to the last century (Wells Reference Wells1934; Duguid Reference Duguid1946; Gupta et al. Reference Gupta, Lin and Chen2009), in which the mechanisms of airborne infection were first explored. Recently, a substantial number of studies have used experiments to investigate the transmission of respiratory droplets. Van Doremalen et al. (Reference Van Doremalen2020) have generated aerosols with SARS-CoV-2 virus by experiment, and the virus was found to remain viable during a 3 h test period. Besides, Fears et al. (Reference Fears2020) have also reported that the virus can retain infectivity and integrity for 16 h in aerosols of breathable size produced in the laboratory. However, it could be less outdoors depending on the degradation of the virus by local weather conditions, such as temperature, humidity, solar radiation, etc. (Ratnesar-Shumate et al. Reference Ratnesar-Shumate2020). Lednicky et al. (Reference Lednicky2020) isolated viable SARS-CoV-2 virus from air samples collected from the wards of two COVID-19 patients. Prasanna Simha & Mohan Rao (Reference Prasanna Simha and Mohan Rao2020) experimentally measured the maximum spreading distance of a human cough with or without masks. It is found that the best type of mask reduced the spray distance from the cough by more than 10 times compared to a cough without a face mask. Akhtar et al. (Reference Akhtar, Garcia, Saenz, Kuravi, Shu and Kota2020) showed through experiments that it is necessary to combine social distancing and masks to reduce the risk of aerosol-induced infections, especially in the confined spaces and for face-to-face interpersonal interactions. Smaller enclosed spaces (like restrooms or elevators) and poorly ventilated public spaces increase the risk of aerosol exposure. Adequate indoor ventilation is important to reduce the duration of aerosols.
In addition to the above, several recent numerical studies have focused on the transmission trajectories of droplets and aerosols carrying viruses. Dbouk & Drikakis (Reference Dbouk and Drikakis2020) simulated the transport, diffusion and evaporation of respiratory droplets at different wind speeds and found that, in some cases, a social distancing of  $2\ {\rm m}$ may not be enough. Feng et al. (Reference Feng, Marchal, Sperry and Yi2020) and Li et al. (Reference Li, Leong, Xu, Ge, Kang and Lim2020) performed similar studies on simulating the dispersion of cough droplets under different wind speeds and relative humidity, which showed that the travel distance of droplets was highly dependent on the environmental conditions. Bhardwaj & Agrawal (Reference Bhardwaj and Agrawal2020) studied the drying time of respiratory droplets discharged from people infected with COVID-19 by assessing droplet contact angle, temperature, volume and environmental humidity. The turbulence mechanism produced during sneezing and coughing is very different from those of other breathing processes and results in large droplets. Fabregat et al. (Reference Fabregat, Gisbert, Vernet, Dutta, Mittal and Pallarès2021) carried out a direct numerical simulation (DNS) for cough flow to track the trajectory of the front vortex ring and show unprecedented details about the jets and thermal puff. Fabregat et al. (Reference Fabregat, Gisbert, Vernet, Dutta, Mittal and Pallarès2021) used a DNS of a mild cough and an evaporative Lagrangian particle advection model with one-way coupling to study the relationship between particle size and the evaporation and evolution of a pathogen-laden cloud.
Busco et al. (Reference Busco, Yang, Seo and Hassan2020) used Reynolds-averaged Navier–Stokes (RANS) modelling to simulate the cough jet produced during a sneeze, where the turbulence closure adopted in their model was  $k$–
 $\epsilon$ and the droplets were modelled as Lagrangian particles. Pendar & Páscoa (Reference Pendar and Páscoa2020) used large-eddy simulations (LES) to simulate the distribution of saliva droplets during severe exhalation events such as coughing and sneezing. They adopted the Eulerian approach and the Lagrangian approach for the carrier air jet and the droplets, respectively. Similarly, Wang et al. (Reference Wang, Alipour, Soligo, Roccon, De Paoli, Picano and Soldati2021) use finely resolved experiments and hybrid Eulerian LES to investigate the underestimation of the infection risk associated with the suspending aerosol a considerable time after human sneezing. Ng et al. (Reference Ng, Chong, Yang, Li, Verzicco and Lohse2021) performed DNS for the gas phase, and the spherical point-particle model for the droplets with adoption of the Maxey–Riley equation, to numerically predict the growth of respiratory droplets in the cough jet flow. The results indicate that the droplets will grow first rather than shrink immediately as the turbulent vapour mass becomes supersaturated. Chong et al. (Reference Chong, Ng, Hori, Yang, Verzicco and Lohse2021) found that the lifetime of breathing droplets in a turbulent vapour cluster is extended by relative humidity with DNS simulations, and the spiral motion of droplets by the buoyancy of the turbulent puff.
In the case of insufficient ventilation, the concentration of respiratory aerosol particles in an indoor environment will increase significantly, leading to high risk of virus transmission. Therefore, the focus of this study is placed on the indoor environment, where most transmission occurs because of space constraints and ventilation issues. Among all these recent research developments, to the best of the authors’ knowledge, the coupling between exhausted respiratory air and saliva droplets has never been carefully studied. Most of the modelling approaches conducted so far are single-phase cough jet studies.
The present study is devoted to investigate the motion of a multiphase cough jet, the coupling effect between the respiratory air and saliva droplets, as well as the interaction among the droplets and the turbulent flows of the surrounding air. Because the peak velocity of human cough jets is less than  $100\ {\rm m}\ {\rm s}^{-1}$, the weakly compressible smoothed particle hydrodynamics (SPH) method is employed. In this work, in order to consider the two-way coupling between the air and droplets, we need to explicitly model the two-phase problem, which is the mixture of gas and droplet particles. In order to do that, the multiphase flow framework proposed by Monaghan & Kocharyan (Reference Monaghan and Kocharyan1995) is adopted to formulate a droplet-containing air particle in SPH. An LES model is incorporated in the governing equations of the SPH formulation to represent the different scales of turbulence structures. In the present work, a realistic temporal velocity profile and a droplet distribution from experimental data are used to reproduce the coughing process.
The rest of the paper is structured as follows. In § 2, the methodology is described in detail, covering from the fundamental governing equations, to multiphase modelling and computer implementations. In § 3, we discuss the evolution of the turbulence structures, the quadrant analysis, and the interplay between vortices and droplets. In § 4, we present the numerical predictions on cough jet development and the droplet dispersion, which are compared with experimental data. Finally, we conclude the work with our main findings and future perspectives in § 5.
2. Methods
In this section, we outline the SPH method and its multiphase turbulence model for LES.
2.1. Equation of state for a weakly compressible fluid
As it is composed by various gaseous components, air is compressible. For low subsonic flows with the speed of the airflow being less than a Mach number ( $Ma$) of
 $0.1$, or a wind speed less than
 $100\ {\rm m}\ {\rm s}^{-1}$, we can usually treat air as an incompressible medium. This can greatly simplify the solution procedure, and the conservation equations of the flow can be solved directly by using weakly compressible SPH methods. In the explicit solution scheme, the time marching scheme needs a stable time step
 $\Delta t$, which depends on the Courant–Friedrichs–Lewy (CFL) condition (Morris, Fox & Zhu Reference Morris, Fox and Zhu1997). Taking into consideration the acceleration, viscous force and Courant viscous force, namely,
 $\Delta t\leqslant \min (\Delta t_f, \Delta t_\nu, \Delta t_c)$, they are expressed as follows:
 \begin{equation} \left.\begin{gathered} \Delta t_f \leqslant \alpha_f \min_i\sqrt{{h_I}/{\Vert\pmb{a}_i\Vert}}, \\ \Delta t_\nu \leqslant \alpha_\nu \min_i({h^2_i}/{\nu}), \\ \Delta t_c \leqslant \alpha_c \min ({h_i}/{c_0}). \end{gathered}\right\} \end{equation}
Here  $\alpha _f = 0.25$,
 $\alpha _\nu = 0.125$ and
 $\alpha _c = 0.25$;
 $\pmb {a}_i$ represents the acceleration of particle
 $i$;
 $\nu$ denotes the kinematic viscosity coefficient; and
 $h$ denotes the smoothing length. Obviously, a higher sound speed will lead to a smaller stabilization time step. In order to increase the stable time step, Monaghan (Reference Monaghan1994) proposed the weakly compressible smoothed particle hydrodynamics (WCSPH) model, which used the proper artificial sound speed to replace the real sound speed. To satisfy the weakly incompressible condition, it is assumed that
 \begin{equation} Ma=\frac{\Vert\boldsymbol{v}\Vert}{c_{0}}\leqslant 0.1. \end{equation}
Subsequently, the artificial sound speed must satisfy the following condition:
 \begin{equation} c_0\geqslant 10\max(\Vert\boldsymbol{v}\Vert). \end{equation}
The artificial sound speed  $c_0$ is good for ensuring an acceptable time step while ensuring the fluid flow characteristics, and a fluid with the artificial sound speed can be considered as a weakly compressible fluid. To build the relationship between pressure and density, the Tait equation is adopted as the equation of state in the WCSPH method,
 \begin{equation} p=B\left[\left(\frac{\rho}{\rho_0}\right)^\gamma-1\right]. \end{equation}
Here  $\rho _0$ is the initial fluid density;
 $\gamma$ is the exponential coefficient, which is 1.4 for gas and 7 for water; and
 $B$ is related to the sound speed and mass density by
 \begin{equation} B=\rho_0 c_0^2/\gamma. \end{equation}
2.2. Governing equations and SPH formulations
In the current work, the WCSPH is adopted to perform the numerical simulations. The computational domain is discretized into particles, which have various physical properties. A kernel function is introduced as an interpolation function to approximate the physical quantities of a given point. The kernel approximation and particle approximation are two important approximations in the SPH method (Monaghan Reference Monaghan2005; Crespo et al. Reference Crespo, Domínguez, Rogers, Gómez-Gesteira, Longshaw, Canelas, Vacondio, Barreiro and García-Feal2015), through which the solutions can be obtained. In the kernel approximation, the non-local average of a field function  $f(\boldsymbol {r})$ is defined as
 \begin{equation} \langle \,f(\boldsymbol{r})\rangle =\int_\varOmega f(\boldsymbol{r}')W(\boldsymbol{r}-\boldsymbol{r}',h)\,{\rm d} \boldsymbol{r}'+{O}(h^2),\end{equation}
where  $\varOmega$ denotes the compact domain,
 $\boldsymbol {r}'$ and
 ${\rm d}\boldsymbol {r}'$ represent the position in the compact domain of
 $\boldsymbol {r}$ and the volume, respectively, and
 $W(\boldsymbol {r}-\boldsymbol {r}', h)$ and
 $h$ are the kernel function and the smoothing length related to the compact domain range, respectively. There are several more frequently used kernel functions, such as the cubic spline function (Schoenberg Reference Schoenberg1946), the Wendland function (Dehnen & Aly Reference Dehnen and Aly2012) and the Gaussian function (Gingold & Monaghan Reference Gingold and Monaghan1977). The spatial gradient
 $\boldsymbol {\nabla } f(\boldsymbol {r})$ can be found as (Li & Liu Reference Li and Liu2007)
 \begin{equation} \boldsymbol{\nabla} f(\boldsymbol{r})=\int_\varOmega f(\boldsymbol{r}') \boldsymbol{\nabla} W(\boldsymbol{r}-\boldsymbol{r}',h)\,{\rm d}\boldsymbol{r}' + {O}(h^2) \approx \int_\varOmega f(\boldsymbol{r}') \boldsymbol{\nabla} W(\boldsymbol{r}-\boldsymbol{r}',h)\,{\rm d}\boldsymbol{r}'.\end{equation}
Similarly, the divergence of a vector field  $\boldsymbol {\nabla }\boldsymbol {\cdot } {\boldsymbol {f}}(\boldsymbol {r})$ can be expressed as
 \begin{equation} \boldsymbol{\nabla}\boldsymbol{\cdot}\boldsymbol{f}(\boldsymbol{r})\approx \int_\varOmega\boldsymbol{f}(\boldsymbol{r}') \boldsymbol{\cdot}\boldsymbol{\nabla} W(\boldsymbol{r}-\boldsymbol{r}',h)\,{\rm d}\boldsymbol{r}'.\end{equation}
In the particle discretization, (2.6), (2.7) and (2.8) can be expressed in the discrete form as follows:
 $$\begin{gather} f(\boldsymbol{r}_i) \approx \sum_{j=1}^{N}f(\boldsymbol{r}_j)W(\boldsymbol{r}_i-\boldsymbol{r}_j,h) \frac{m_j}{\rho_j} , \end{gather}$$
 $$\begin{gather}\boldsymbol{\nabla} f(\boldsymbol{r}_i) \approx \sum_{j=1}^{N}f(\boldsymbol{r}_j) \boldsymbol{\nabla} W(\boldsymbol{r}_i-\boldsymbol{r}_j,h)\frac{m_j}{\rho_j} , \end{gather}$$
 $$\begin{gather}\boldsymbol{\nabla}\boldsymbol{\cdot}\boldsymbol{f}(\boldsymbol{r}_i) \approx \sum_{j=1}^{N}\boldsymbol{f}(\boldsymbol{r}_j)\boldsymbol{\cdot}\boldsymbol{\nabla} W (\boldsymbol{r}_i-\boldsymbol{r}_j,h)\frac{m_j}{\rho_j} . \end{gather}$$
Here  $N$ denotes the particle number inside the compact support;
 $m_j$ denotes the mass of particle
 $j$;
 $\rho _j$ is the density of particle
 $j$; and
 $m_j/\rho _j$ represents the volume of particle
 $j$. In passing, we note that more accurate corrective SPH differential operators (see Li & Liu Reference Li and Liu2007) or consistent non-local particle differential operators can be found in Bergel & Li (Reference Bergel and Li2016) and Yan et al. (Reference Yan, Li, Kan, Zhang and Lai2022).
We consider the Lagrangian form of the Navier–Stokes equations in terms of mass and momentum conservation:
 $$\begin{gather} \frac{{\rm d}\rho}{{\rm d}t} ={-}\rho\boldsymbol{\nabla}\boldsymbol{\cdot}\boldsymbol{v} + \varPi , \end{gather}$$
 $$\begin{gather}\frac{{\rm d}\boldsymbol{v}}{{\rm d}t} ={-}\frac{1}{\rho}\boldsymbol{\nabla} p + \boldsymbol{g} + \varGamma . \end{gather}$$
Here  $\varPi$ is the density diffusion term;
 $\boldsymbol {v}$ is the velocity of the fluid;
 $p$ denotes the hydrostatic pressure;
 $\boldsymbol {g}$ is the gravitational acceleration; and
 $\varGamma$ is the dissipative term, which can be regarded as the viscous force term (Lo & Shao Reference Lo and Shao2002), i.e.
 \begin{equation} \varGamma=(v_0\nabla^2\boldsymbol{v})_i = \sum_j m_j\left(\frac{4v_0(\boldsymbol{r}_j - \boldsymbol{r}_i)\boldsymbol{\cdot}(\boldsymbol{v}_j-\boldsymbol{v}_i)} {(\rho_j+\rho_i)(r_{ij}^2 + \eta^2)}\right)\boldsymbol{\nabla}_i W_{ij}, \end{equation}
where  $v_0$ is the kinematic viscosity, and
 $\eta =0.1h$, which can prevent singularity when
 $\Vert \boldsymbol {r}_j-\boldsymbol {r}_i\Vert =0$ (Monaghan Reference Monaghan2005; Sun, Ming & Zhang Reference Sun, Ming and Zhang2015).
In computations, the conservation of mass, i.e. (2.12), is discretized as
 \begin{equation} \frac{{\rm d}\rho_i}{{\rm d}t} = \rho_i\sum\frac{m_j}{\rho_j}(\boldsymbol{v}_j - \boldsymbol{v}_i)\boldsymbol{\cdot}\boldsymbol{\nabla}_i W_{ij} + \varPi , \end{equation}
where  $\varPi$ is the density diffusion term, which is expressed as
 \begin{equation} \varPi = \xi c_0 h_i \sum \frac{(\rho_j - \rho_i)(\boldsymbol{r}_j - \boldsymbol{r}_i)}{\Vert \boldsymbol{r}_j - \boldsymbol{r}_i\Vert^2}\boldsymbol{\nabla}_i W_{ij} V_j, \end{equation}
where  $\xi =0.2$ is chosen for the stability of the pressure field (Antuono et al. Reference Antuono, Colagrossi, Marrone and Molteni2010),
 $c_0$ is the sound speed in the fluid and
 $V_j$ is the volume of particle
 $j$.
According to Lo & Shao (Reference Lo and Shao2002), the conservation of linear momentum in (2.13) can be expressed as
 \begin{equation} \frac{{\rm d}\boldsymbol{v}_i}{{\rm d}t}={-}\sum_j\left(\frac{p_j + p_i}{\rho_i}\right)V_j\boldsymbol{\nabla}_i W_{ij} + \boldsymbol{g} + \varGamma, \end{equation}
where
 \begin{equation} \varGamma = 4\nu_0\sum_j\frac{m_j(c_j + c_i)(\boldsymbol{v}_j - \boldsymbol{v}_i)\boldsymbol{\cdot}(\boldsymbol{r}_j - \boldsymbol{r}_i)}{(\rho_i + \rho_j)(\Vert\boldsymbol{r}_j - \boldsymbol{r}_i\Vert^2+0.01h^2)}\boldsymbol{\nabla}_i W_{ij}, \end{equation}
where  $p$ represents the pressure,
 $V$ represents the volume of the fluid particle and
 $\boldsymbol {g}$ represents the gravitational acceleration. Here,
 $c$ represents the sound speed in the fluid,
 $h$ represents the smoothing length,
 $\boldsymbol {v}$ and
 $\rho$ represent the velocity and mass density, and
 $\boldsymbol {r}$ represents the position.
2.3. Turbulence model
A major feature of the human cough is its turbulence characteristics. For modelling and simulation of turbulent flows, the most accurate approach is DNS. However, that requires an extremely fine mesh to resolve the entire spatial and temporal scales of the turbulent flow, which usually requires expensive computational cost even at low Reynolds numbers. In the present work, we adopt the LES approach to model the turbulence via low-pass filtering of the Navier–Stokes equations rather than explicit calculation of the turbulence at every length scale. This is because the aerosol dynamics in turbulent flow is at the length scale of  $100\ {\rm nm}$ to
 $1\ \mathrm {\mu }{\rm m}$ (Chun et al. Reference Chun, Koch, Rani, Ahluwalia and Collins2005; Rigopoulos Reference Rigopoulos2019), and it would take tremendous resources and effort to conduct DNS at such a scale.
The LES approach removes small-scale information from numerical solutions by using low-pass filtering. Then the system solver will only need to resolve the scale from the domain size  $L$ to the filter size
 $\varDelta$, i.e. the grid size, while the unresolved scales are modelled through extra formulae. In the present work, the sub-particle-scale (SPS) model (Gotoh Reference Gotoh2001) is adopted to capture the effects of the unresolved turbulence scales,
 \begin{equation} \frac{{\rm d}\boldsymbol{v}_i}{{\rm d}t} ={-}\sum_j\left(\frac{p_j + p_i}{\rho_i} \right)V_j\boldsymbol{\nabla}_i W_{ij}+\boldsymbol{g} + \varGamma + \frac{1}{\rho _i}\boldsymbol{\nabla}\boldsymbol{\cdot}\bar{\pmb\tau}, \end{equation}
where  $\bar {\pmb \tau }$ is the SPS stress tensor,
 \begin{equation} \bar{\tau}_{ij} = \rho_i (\bar{u}_i\bar{u}_j - \overline{u_i u_j}). \end{equation}
The large-eddy viscosity assumption, i.e. the Boussinesq hypothesis, is used to model the SPS stress tensor as
 \begin{equation} \bar{\tau}_{ij} = \rho_i (2\nu_t \bar{S}_{ij} - \tfrac{2}{3}\bar S_{kk}\delta_{ij}) - \tfrac{2}{3}\rho _i C_I\delta^2\delta_{ij}, \end{equation}
where  $\nu _t$ is the turbulence eddy viscosity, and
 $\bar {S}_{ij}$ is the sub-particle scale strain tensor in indicial notation. Following Blin, Hadjadj & Vervisch (Reference Blin, Hadjadj and Vervisch2003) and Domínguez et al. (Reference Domínguez2021), we choose
 $C_I=0.0066$. The eddy viscosity model proposed by Smagorinsky is adopted here to obtain the dynamic viscosity of turbulent flows. In this model, the eddy viscosity is considered to proportional to the mixing length, and the characteristic turbulent velocity is based on the second invariant of the filter field deformation strain
 $\bar {\boldsymbol {S}}$. In this work, the mixing length is considered to be a feature of sub-particle length scale represented by the particle spacing
 $\Delta l$. Thus, we have
 \begin{equation} \nu_t=(C_s\Delta l)^2|\bar{\boldsymbol{S}}|, \end{equation}
where  $C_s$ denotes the Smagorinsky constant and the SPS strain is given by
 \begin{equation} |\bar{\boldsymbol{S}}|=\sqrt{2\bar{S}_{ij}\bar{S}_{ij}}. \end{equation}
Rogallo & Moin (Reference Rogallo and Moin1984) suggested a range for  $C_s$, which is between 0.1 and 0.24. In this work, we choose
 $C_s=0.12$, and the calculated results are in good agreement with the experimental data in the literature. The contribution of SPS stress to linear momentum can be calculated by using the discrete symmetric formulation (see Lo & Shao Reference Lo and Shao2002),
 \begin{equation} \frac{1}{\rho}\boldsymbol{\nabla}\boldsymbol{\cdot}\bar{\pmb\tau} = \sum_j m_j\left( \frac{\bar{\pmb\tau}_i}{\rho_i^2} + \frac{\bar{\pmb\tau}_j}{\rho_j^2}\right)\boldsymbol{\cdot}\boldsymbol{\nabla}_i W_{ij}, \end{equation}
where the sub-particle stress tensor  $\bar {\pmb \tau }_i$ of particle
 $i$ is calculated by (2.21).
2.4. Multiphase droplet-laden cough jet model
This work is aimed at studying the interaction between saliva droplets and ambient air during coughing. The human cough jet is a mixture of multiphase fluids that is essentially a saliva droplet-laden moist gas flow (Zhu, Kato & Yang Reference Zhu, Kato and Yang2006). When the cough jet is ejected from a human's mouth, the cough jet is composed by both the gas flow and droplets, which can be regarded as a mixture of two phases, i.e. the gas phase and the solute droplet phase. Therefore, the human cough jet flow is a multiphase particle-laden fluid flow, in which the saliva droplets and respiratory air are blending, mixing, penetrating and interacting with each other discontinuously, rather than a multiphase flow with two continuous fluid phases (e.g. Yan et al. Reference Yan, Li, Zhang, Kan and Sun2019, Reference Yan, Li, Kan, Zhang and Lai2022). There has been a vast literature on modelling multiphase flow with droplets or particles, i.e. multiphase particulate flow (Crowe et al. Reference Crowe, Schwarzkopf, Sommerfeld and Tsuji2011; Podgorska Reference Podgorska2019).
In this work, we adopt an early multiphase flow model specifically designed for two penetrating material phases (i.e. Harlow & Amsden Reference Harlow and Amsden1975a,Reference Harlow and Amsdenb; Valentine & Wohletz Reference Valentine and Wohletz1989). To capture the expiratory droplet dispersion process, we employed an SPH version of the above multiphase fluid model developed in Monaghan & Kocharyan (Reference Monaghan and Kocharyan1995), which is a Lagrangian-type mesh-free particle method. The Monaghan–Kocharyan multiphase flow model approximates the gas–droplet mixture as two interpenetrating fluids that interact by pressure and drag forces. It is assumed in this work that: (1) the droplets do not evaporate; (2) the gas particles do not condense; and (3) the stress tensor of the droplet gas may be negligible. This is a reasonable approximation because, for mild to moderate cases of COVID-19, the small-sized droplets ( $d < 20\ \mathrm {\mu }{\rm m}$), which may evaporate completely in the first 2 s of their emission, are unlikely to be of any consequence in carrying infection (see Anand & Mayya Reference Anand and Mayya2020; Stadnytskyi et al. Reference Stadnytskyi, Bax, Bax and Anfinrud2020), while for large droplets (
 $d> 100\ \mathrm {\mu }{\rm m}$), their settling time is much shorter than their lifetime or evaporation time (see Chen Reference Chen2020; Zeng et al. Reference Zeng, Chen, Yuan, Yamamoto and Maruyama2021). For medium-sized droplets (
 $20\ \mathrm {\mu }{\rm m} < d < 100\ \mathrm {\mu }{\rm m}$), the evaporation effect is indeed a concern; however, the evaporation times for most such droplets are beyond the duration of the turbulent state of the coughed air
 $({\sim }2\ {\rm s})$, and thus the above approximation is practically acceptable.
The local interaction between the two phases can be described as the interaction among gas particles and droplet particles. As shown in figure 1, in each fluid particle compact support, the concentration or the volume fraction of the two phase fluids varies from time to time. Thus, their densities differ from their densities in the homogeneous state of the single phase under near-incompressible conditions. The current density of each phase is denoted as
 \begin{equation} \hat{\rho}_p =\theta_p \rho_p,\quad p=d,g, \end{equation}
where  $\rho _p$ are the equilibrium densities of the homogeneous state of the single phase, and
 $\theta _p$ is the volume fraction of a given phase in the mixture, which satisfies the condition (see figure 1)
 \begin{equation} \theta _g + \theta _d=1. \end{equation}
Schematic illustration of the interaction scheme between gas particles and droplet particles, and the volume fractions of the droplets and ambient air.

We can then derive the continuity equations for the current gas density  $\hat {\rho }_g$ and the current droplet density
 $\hat {\rho }_d$ as follows:
 \begin{equation} \frac{{\rm d} \hat{\rho}_g }{{\rm d}t} ={-}\hat{\rho}_g \boldsymbol{\nabla}\boldsymbol{\cdot} {\boldsymbol{v}}_g \end{equation}
and
 \begin{equation} \frac{ {\rm d} \hat{\rho}_d }{{\rm d}t} ={-}\hat{\rho}_d \boldsymbol{\nabla}\boldsymbol{\cdot} {\boldsymbol{v}}_d. \end{equation}
Since the equilibrium density  $\rho _d$ of the homogeneous droplet state is known, we can determine
 $\theta _d=\hat {\rho }_d/\rho _d$, after we solve
 $\hat {\rho }_d$, and subsequently we can then find
 ${\theta _g=1-\theta _d}$. For a clear presentation, it is convenient to reserve the subscripts
 $i$ and
 $j$ for the gas particles, and
 $a$ and
 $b$ for the droplet particles. Thus the gas-phase continuity equation becomes
 \begin{equation} \frac{ {\rm d} \hat{\rho}_i }{{\rm d}t}= \sum _j m_j {\boldsymbol{v}}_{ij} \boldsymbol{\cdot} \boldsymbol{\nabla}_i W_{ij} \end{equation}
and the droplet continuity equation becomes
 \begin{equation} \frac{ {\rm d} \hat{\rho}_a }{{\rm d}t}= \sum _b m_b {\boldsymbol{v}}_{ab} \boldsymbol{\cdot} \boldsymbol{\nabla}_a W_{ab}. \end{equation}
Subsequently, the SPH momentum equations for gas and droplets are expressed as
 \begin{equation} \frac{ {\rm d} \hat{\boldsymbol{v}}_g }{{\rm d}t}={-} \frac{\boldsymbol{\nabla} {p}}{\rho _g}+ \frac{K}{\hat{\rho}_g}({\boldsymbol{v}}_d - {\boldsymbol{v}}_g) + \varPi+ \frac{\hat{\rho}_g - \hat{\rho}_{mix} }{\hat{\rho}_g}{\boldsymbol{g}}, \end{equation}
where  $\rho _{mix} = \theta _g \hat {\rho }_g + \theta _d \hat {\rho }_d$, and
 \begin{equation} \frac{ {\rm d} \hat{\boldsymbol{v}}_d }{{\rm d}t}={-} \frac{\boldsymbol{\nabla} {p}}{\rho _d}- \frac{K}{\hat{\rho} _d} ({\boldsymbol{v}}_d - {\boldsymbol{v}}_g) + \frac{ \hat{\rho}_d - \hat{\rho}_{mix} }{\hat{\rho}_d}{\boldsymbol{g}}, \end{equation}
where the term  $((\hat {\rho }_d - \hat {\rho }_{mix}) / \hat {\rho }_d){\boldsymbol {g}}$ includes the contribution of buoyancy force, and
 $K$ is the drag coefficient to determine the magnitude of the drag force. The latter is calculated based on the following formula:
 \begin{equation} K=\frac{\rho_g\theta_dC_D}{r_d}\Vert\boldsymbol{v}_d-\boldsymbol{v}_g\Vert, \end{equation}
where  $\rho _g$ is the mass density of the ambient gas,
 $r_d$ is the droplet radius and
 $\theta _d$ is the volume fraction of the droplet phase. The drag coefficient
 $C_D$ in the above equation is expressed as
 \begin{equation} C_D=\begin{cases} \left[0.15(Re^*)^{0.687} +1 \right] \dfrac{24}{Re^*}, & Re^*<1000, \\ 0.44, & Re^*\geqslant 1000, \end{cases} \end{equation}
in which
 \begin{equation} Re^*=\frac{2\rho_a\Vert\boldsymbol{v}_i-\boldsymbol{v}_a\Vert\boldsymbol{r}_i}{\mu_a} \end{equation}
represents the Reynolds number of droplets, which is evaluated for each individual droplet.
As shown in figure 1, when the droplet particles are in the supports of gas particles, the droplet particle will exert a drag force on the gas particles. Inversely, when the gas particles are in the supports of droplet particles, the gas particle will exert a drag force on the droplet particles.
Finally, the balance equation of linear momentum for gas particles interacting with droplet particles can be written as follows:
 \begin{align} \frac{ {\rm d} \hat{\boldsymbol{v}}_i }{{\rm d}t} &={-} \sum _j \frac{\theta _i {p}_i + \theta _j {p}_j }{\hat{\rho} _i} V_j \boldsymbol{\nabla}_i W_{ij} - \sum _a m_a \frac{{p}_i \theta _a }{\hat{\rho} _i \hat{\rho} _a } \boldsymbol{\nabla} _i W _{ia} + \varGamma_i \nonumber\\ &\quad + \sigma \sum _a m_a {\frac{K _{ia}}{ {\hat{\rho}}_i {\hat{\rho}}_a}} \left({\frac{{\boldsymbol{v}}_{ai} \boldsymbol{\cdot} {\boldsymbol{r}}_{ai}}{{\boldsymbol{r}}_{ai}^2 + {\boldsymbol{\eta}}^2}}\right) {\boldsymbol{r}}_{ai} W_{ai} + \varPi _i + \frac{1}{\hat{\rho}_i}\boldsymbol{\nabla}\boldsymbol{\cdot}\bar{\pmb\tau}_i + \left(\frac{\hat{\rho}_i - \hat{\rho}_{mix} }{\hat{\rho}_i} \right) {\boldsymbol{g}}_i , \end{align}
where
 $$\begin{gather} \varGamma_i = 4\nu_0\sum_j \frac{m_j(c_i+c_j)(\boldsymbol{v}_j-\boldsymbol{v}_i) (\boldsymbol{r}_j-\boldsymbol{r}_i)} {(\theta_i\rho_i+\theta_j\rho_j)(\Vert\boldsymbol{r}_j-\boldsymbol{r}_i\Vert^2 +0.01h^2)}\varDelta_i W_{ij}, \end{gather}$$
 $$\begin{gather}\varPi_i = \xi c_0 h_i\sum_j \frac{(\theta_j\rho_j-\theta_i\rho_i)(\boldsymbol{r}_j-\boldsymbol{r}_i)} {\Vert\boldsymbol{r}_j-\boldsymbol{r}_i\Vert^2}\varDelta_i W_{ij}V_j, \end{gather}$$
 $$\begin{gather}\frac{1}{\hat{\rho}_i}\boldsymbol{\nabla}\boldsymbol{\cdot}\bar{\boldsymbol{\tau}}_i
= \sum_j
m_j\left(\frac{\bar{\boldsymbol{\tau}}_i}{(\theta_i\rho_i)^2}
+\frac{\bar{\boldsymbol{\tau}}_j}{(\theta_j\rho_j)^2}\right).
\end{gather}$$
Subsequently, the SPH balance equation of linear momentum for droplet particles interacting with gas particles can be written as follows:
 \begin{align} \frac{ {\rm d}\hat{\boldsymbol{v}}_a }{{\rm d}t} &={-} \sum _b \frac{\theta _a {p}_a + \theta _b {p}_b }{\hat{\rho} _a} V_b \boldsymbol{\nabla} _a W_{ab} - \sum _i m_i \frac{{p}_i \theta _a }{\hat{\rho} _a \hat{\rho} _i } \boldsymbol{\nabla}_a W _{ai} \nonumber\\ &\quad - \sigma \sum _i m_i {\frac{K _{ai}}{ {\hat{\rho}}_i {\hat{\rho}}_a}} \left({\frac{{\boldsymbol{v}}_{ai} \boldsymbol{\cdot} {\boldsymbol{r}}_{ai}}{{\boldsymbol{r}}_{ai}^2 + {\boldsymbol{\eta}} ^2 }} \right) {\boldsymbol{r}}_{ai} W_{ai}+ \left( \frac{\hat{\rho}_a - \hat{\rho}_{mix} }{\hat{\rho}_a} \right) {\boldsymbol{g}}_a. \end{align}
2.5. Solid-wall boundary condition
Since SPH is a non-local particle method, each particle has a finite-size compact support that contains its interacting neighbouring points. However, for SPH particles near the boundaries, they do not have a complete domain support. This could introduce a non-physical response, and it may cause lower accuracy, even significant errors, in computational results. In this work, the ghost particle technique (Adami, Hu & Adams Reference Adami, Hu and Adams2012) is adopted to approximate the interface between the boundary and the fluid phase, as shown in figure 2. Compared with other techniques to impose a solid-wall boundary condition, such as mirror particles, the main advantage of ghost particles is its simplicity to enforce the boundary conditions for complex boundary geometries, and, once the particles are initialized, the boundary is well described throughout the simulation.
Fluid particles  $(\bullet )$ interact with ghost particles denoting the wall
 $(\circ )$ to guarantee the whole support for kernel interpolation.

In figure 2, fluid particles  $(\bullet )$ near the solid wall will interact with ghost particles representing the wall
 $(\circ )$ within the support region. When the fluid particles are governed by the equation of motion, the position and velocity of the ghost particles are fixed still. By choosing the wall velocity for viscous interaction, the free-slip or no-slip boundary condition can be imposed at the wall. The free-slip boundary condition is adopted by ignoring the viscosity between the solid boundary and the fluid phase. By imposing the no-slip condition, one can obtain the smoothed velocity field in the fluid phase through the ghost particle velocity (Adami et al. Reference Adami, Hu and Adams2012) as follows:
 \begin{equation} \tilde{\boldsymbol{v}}_i = \frac{\sum\limits_j\boldsymbol{v}_j W_{ij}}{\sum\limits_j W_{ij}}. \end{equation}
Subsequently, the wall velocity  ${\boldsymbol {v}}_w$ is obtained as
 \begin{equation} \boldsymbol{v}_w = 2\boldsymbol{v}_i - \tilde{\boldsymbol{v}}_i, \end{equation}
where  $\boldsymbol {v}_i$ denotes the prescribed solid-wall velocity. Similarly, the wall pressure
 $p_w$ can also be obtained by the summation of neighbouring fluid particles,
 \begin{equation} p_w=\frac{\sum\limits_fp_fW_{wf}+(\boldsymbol{g}-\boldsymbol{a}_w) \boldsymbol{\cdot}\sum\limits_f\rho_f\boldsymbol{r}_{wf}W_{wf}}{\sum\limits_f W_{wf}}, \end{equation}
where  $\boldsymbol {a}_w$ is the prescribed acceleration of ghost particles and
 ${\boldsymbol {a}_w} = {\textbf{0}}$ is applied to the fixed boundary. Furthermore, the density of ghost particles can be inversely solved through the Tait equation as
 \begin{equation} \rho_w=\rho_{0}\left(\frac{p_w}{B}+1\right)^{{1}/{\gamma}}. \end{equation}
2.6. Open-boundary condition
In this work, to model the cough jet inflow as well as the outflow at the other side of the simulation domain, the boundaries of the computational domain need to enforce specific flow conditions. For cough jets, the inlet boundary conditions can be achieved by specifying the inflow velocity for buffer particles in the inlet region, whereas other velocity or pressure conditions need to be specified or imposed at the outlet boundary. To impose these boundary conditions, an open-boundary condition algorithm (Tafuni et al. Reference Tafuni, Domínguez, Vacondio and Crespo2018) is utilized here. The working principle of the open-boundary condition algorithm is briefly summarized in figure 3. The blue circles represent the fluid particles in the computational domain, and then a permeable threshold is set in front of the edge of the domain, which is depicted by a dashed line. Buffer particles are created and maintained during the computation process to be the same as the fluid particles except that their physical information is passed from the fluid region by ghost particles (green squares). The position of the ghost particles is then obtained by mirroring the normal distance of the boundary particles from the permeable surface into the fluid. After that, the physical quantities are interpolated and extracted from the neighbouring fluid particles to the ghost particles; the latter then passes those properties back to their corresponding boundary particles. If a fluid particle passes through the permeable surface, it will be transferred to a buffer particle, which will also cause the mirroring of a ghost particle back into the fluid. If a boundary particle passes through the edge of the domain from the buffer region, it will be removed from the computational domain. Conversely, if a buffer particle travels through the permeable surface, it will become a fluid particle such that its ghost particle will be discarded, and a new boundary particle will be inserted near the other edge of the buffer zone along the flow direction of the buffer particles.
Schematic illustration of the open-boundary condition.

The physical information of the ghost particles is extracted by the standard particle interpolation using their neighbouring particles that reside within their smooth length, which is expressed as
 \begin{equation} f^g(r_i)=\frac{\displaystyle\sum f^g(r_j)W^g_{ij}m_j/\rho_j} {\displaystyle\sum W^g_{ij}m_j/\rho_j}, \end{equation}
where  $f^g(r_i)$ is the physical quantity at the ghost particle, the summation is performed on the neighbouring fluid particles adjacent to the ghost particles, and
 $W^g_{ij}$ is the weight function between the ghost particle
 $i$ and its fluid neighbour
 $j$.
2.7. Shifting algorithm
The particle spacing in the SPH method is an important factor for the problem of numerical stability, especially in simulations of turbulent flow, because in this case the particles cannot keep a uniform distribution. As a result, noise is introduced in the velocity and pressure fields, and in some cases unrealistic voids could be generated inside the fluid field. To resolve this issue, we adopt a so-called shifting algorithm that can adaptively redistribute SPH particles and make them quasi-uniform. We first assume that the number of particles passing through unit surface per unit time is proportional to the particle velocity, and then the particle moving velocity and subsequently the particle moving distance can be found. Based on the particle concentration, a particle shifting distance  $\delta \boldsymbol {r}$ (Lind et al. Reference Lind, Xu, Stansby and Rogers2012) can be obtained as
 \begin{equation} \delta\boldsymbol{r} ={-}D\boldsymbol{\nabla} C, \end{equation}
where  $C$ represents the particle concentration and
 $D$ denotes the diffusion coefficient, which controls the shifting magnitude. Then, the gradient of particle concentration can be obtained by using the SPH gradient operator:
 \begin{equation} \boldsymbol{\nabla} C = \sum_j\frac{m_j}{\rho_j}\boldsymbol{\nabla} W_{ij}. \end{equation}
The proportionality coefficient  $D$ should be set large enough to provide an effective particle shifting without introducing obvious errors or instabilities. This is achieved by enforcing the von Neumann stability condition for a convection–diffusion equation,
 \begin{equation} D\leqslant\frac{h^2}{2\Delta t_{max}}, \end{equation}
where  $\Delta t_{max}$ represents the maximum time step determined by the CFL condition. Combining the equation above with the CFL condition, one can find the shifting coefficient
 $D$ by
 \begin{equation} D=Ah\Vert\boldsymbol{v}\Vert \,{\rm d}t, \end{equation}
where  $A$ is a dimensionless constant, which depends on the problem set-up and the specific discretization, and
 ${\rm d}t$ is the time step. The value of
 $A$ is in the range of 1–6, and we used
 $A= 2.0$ in this work.
2.8. Similarity protocol in experimental data
In this work, we shall compare the numerical results with the experimental data obtained by Wei & Li (Reference Wei and Li2017). Since their experiments were carried out by using a water tank and glass beads, a similarity protocol is utilized in their work to quantitatively map the water tank experimental data to the real scenario in air. By neglecting the nonlinearity of the drag force and ignoring the force due to fluid acceleration, the added-mass force and the Basset history force, under the Stokes’ region ( $Re_p={| u_f-u_p| d_p}/{\nu }<1$), the equation of particle motion is written as
 \begin{equation} \frac{{\rm d}\boldsymbol{v}_p}{{\rm d}t} =\frac{1}{St}(\boldsymbol{v}_f-\boldsymbol{v}_p - \boldsymbol{v}_\tau), \end{equation}
where  ${\boldsymbol {v}}_f$ and
 ${\boldsymbol {v}}_p$ are the velocities of the fluid phase and the particle phase,
 $\boldsymbol {v}_\tau$ represents the particles’ terminal settling velocity, and
 $\tau$ represents the particles’ relaxation time. They are respectively defined as follows:
 \begin{equation} \boldsymbol{v}_\tau = \frac{(\rho_p-\rho_f)d^2_p\boldsymbol{g}}{18\mu},\quad \tau=\frac{\rho_pd^2_p}{18\mu}. \end{equation}
Normalizing (2.50) by the characteristic length scale  $D$ and characteristic velocity scale
 $U_c$ will give the following expression:
 \begin{equation} \frac{{\rm d}\bar{\boldsymbol{v}}_p}{{\rm d}\bar t}=\frac{1}{St}(\bar{\boldsymbol{v}}_f -\bar{\boldsymbol{v}}_p - \bar{\boldsymbol{v}}_\tau), \end{equation}
where  $St={U_c\tau }/{D}$ is the Stokes number. The average injection velocity is chosen as the characteristic velocity
 $U_c$, which is given by
 \begin{equation} U_c=\frac{1}{t_{inj}}\int_{0}^{t_{inj}}U(t)\,{\rm d}t, \end{equation}
where  $t_{inj}$ is the duration of the cough, or the duration of the initiating air-breathing phase. In the water tank modelling, the same Reynolds number, Stokes number and ratio of terminal settling velocity to characteristic velocity scale are used in order to make the mapping consistent, the corresponding formulae being given as
 $$\begin{gather} Re_c = \frac{U_{c,g}D_g}{v_g}=\frac{U_{c,w}D_w}{v_w}, \end{gather}$$
 $$\begin{gather}St_{c,g} = St_{c,w} , \end{gather}$$
 $$\begin{gather}\frac{u_{\tau,g}}{U_{c,g}} = \frac{u_{\tau,w}}{U_{c,w}}. \end{gather}$$
Combining the equations above leads to
 $$\begin{gather} \frac{U_{c,w}}{U_{c,g}} = \sqrt[3]{\frac{\nu_w}{\nu_g}\frac{\rho_{p,g}}{\rho_{p,g}-\rho_g}\frac{\rho_{p,w} -\rho_w}{\rho_{p,w}}} , \end{gather}$$
 $$\begin{gather}\frac{D_w}{D_g} = \sqrt[3]{\left(\frac{\nu_w}{\nu_g}\right)^2 \left(\frac{\rho_{p,g}}{\rho_{p,g}-\rho_g}\frac{\rho_{p,w}-\rho_w}{\rho_{p,w}}\right)^{{-}1}}. \end{gather}$$
The above two equations define the geometric and boundary conditions for particle experiments in water tanks, e.g. the nozzle diameter and exit velocity. More details may be found in Wei & Li (Reference Wei and Li2017).
2.9. Numerical modelling and parameters
In this work, large-scale numerical simulations are performed to investigate the cough jet development and droplet dispersion. The computational domain and enlarged details of the inlet are illustrated in figure 4, with its dimension size set as 3.8 m in length, 2.2 m in height and 1.4 m in width, in which the ambient air is contained in an air chamber surrounded by rigid walls. The density and viscosity of the ambient air and jet air in the computational domain are  $\rho _g=1.181\ \mathrm {kg}\ \mathrm {m}^{-3}$ and
 $\nu _g=1.86\times 10^{-5} \mathrm {Pa}\ \mathrm {s}$, respectively. A cough is modelled as the injection of a limited amount of air into the stationary environment. The transient characteristics of the cough flow are achieved by applying the flow velocity at the inlet area as a boundary condition. The domain is initially discretized into 98 872 692 particles including the solid-wall boundaries with the particle spacing
 $\Delta x=0.005\ \mathrm {m}$. An open inlet is put at one side of the box with 1.6 m in height from the bottom of the box to mimic the real cough position, as suggested by Dbouk & Drikakis (Reference Dbouk and Drikakis2020). The area of the inlet is set as
 $0.0005\ \mathrm {m}^{2}$, which is approximately composed by a square section with width
 $r=0.02\ {\rm m}$ and height
 $d=0.025\ {\rm m}$, and the corresponding flow velocity to be applied as inlet boundary condition can be reproduced from Gupta et al. Reference Gupta, Lin and Chen2009, as illustrated in figure 5.
Geometrical set-up of the computational domain.

Velocity profile of the inlet flow.

The lognormal distribution has been used when we dynamically generate droplets in the jet at the injection region following Duguid (Reference Duguid1946), which obeys the following expression:
 \begin{equation} y=f(x\mid\mu,\sigma)=\frac{1}{x\sigma\sqrt{2{\rm \pi}}} \exp\left(\frac{-(\log x-\mu)^2}{2\sigma^2}\right),\quad \mathrm{for}\ x>0. \end{equation}
The observed statistical distribution for the size of the droplet particles in cough jets may be approximated as a lognormal distribution (Johnson et al. Reference Johnson2011; Van Sciver et al. Reference Van Sciver, Miller and Hertzberg2011; Han, Weng & Huang Reference Han, Weng and Huang2013; Wang, Xu & Huang Reference Wang, Xu and Huang2020). The two parameters for the lognormal distribution equation (2.59) can be calculated as  $\mu =-11.1503$ and
 $\sigma =0.9660$. Droplet injection is achieved in the following steps: (i) The desired number of droplets to be injected in each size range is specified according to the experimental data. (ii) Each time air phase particles are generated and pushed into the inlet, a random drawing is performed to determine whether or not droplet particles should be created. (iii) If new droplet particles are to be injected into the ejection flow, a random drawing is performed again to choose the droplet radius, while the total number of droplets must obey the lognormal distribution. During a fixed ejection period with a fixed number of ejection particles, which is about 125 000 particles in our simulation, and the droplet occurrence probability will ensure that among 125 000 particle ejections there will be 10 000 times when we eject a droplet particle. Then each time that a droplet particle is ejected, we shall draw a random number to determine the size of the droplet particle based on the lognormal distribution.
In order to explore the effects of the injected droplets in the exhaled air and measure the statistics of the data, we performed 10 numerical simulations, whose details are listed in table 1. They are classified into two groups. One is performed with the two-way coupling considered between the air phase and the droplets. In the other group, there are no droplets being injected into the jet flow. All the simulation cases share the same geometry and discretization as well as the boundary conditions. They only vary little by small velocity perturbations at ejection. That is, random perturbations of 1 % amplitude are applied to the original ejection velocity profile to form five different velocity profiles in total, which are then assigned to the inlet boundary condition. Those profiles are then adapted in five pairs of numerical simulations to study the turbulence statistics of the ambient air phase. Evaporation and condensation of the droplets are not considered in this work, as our focus is concentrated on the influence of the droplets on the motion of the turbulent puff, and its possible effects inversely on droplet dynamics and dispersion. As predicted by the constant-temperature model (Wells Reference Wells1934; Langmuir Reference Langmuir1918), the evaporation time for a droplet to be fully evaporated to its dry nucleus is proportional to the initial diameter squared, which is the so-called  $d^2$ law. As for the Lagrangian statistics method that is commonly used in one-way coupling simulations, the motion of a droplet is dictated by the drag force from its surrounding gas phase, which varies with the surface area affected by the convective effects.
Details of the numerical simulations. Here  $v^*$ is the peak ejection velocity, and
 $t_{inj}$ is the ejection duration. Simulation cases CVD20V22a–e will have droplets generated in the injection flow, while no droplets are created in cases CVD20N22a–e. The cases in the two groups sharing the same alphabetical indexing share the same ejection velocity profile.

In this regard, one would expect non-evaporating/condensing droplets to travel a shorter distance for drops with small diameters, or a slightly longer distance for those with large diameters. Such estimation is based on the fact (which is suggested by numerical investigations that considered humidity) that the supersaturated region right after the injection flow may help to increase the volume of the droplets for a short time, while a humid puff may help to reduce the evaporation rate of the droplets inside. In addition, the rate of evaporation/condensation is dependent not only on the relative velocity of droplets, but also on the temperature and humidity of the surrounding air. Since our work is mainly concerned with the study of droplet dispersion in indoor environments, i.e. under room temperature, condensation could be neglected even with 90 % relative humidity according to the results suggested by Ng et al. (Reference Ng, Chong, Yang, Li, Verzicco and Lohse2021). By neglecting evaporation, our prediction may give optimized results with respect to the realistic situation.
In the simulations, both respiratory air and droplets will come out from the inlet into the open space based on the prescribed velocity profile. The duration of the cough simulation is 4 s, and at the end of the simulation, the total number of particles, both air and droplet particles, will exceed 125 million.
3. Quadrant analysis of turbulence structure in multiphase cough jets
In this work, we use quadrant analysis to visualize the turbulence structure and investigate the interaction of the droplets and turbulence of the ambient air, which may have significant effects on the droplet trajectories, movements and their suspension/dispersion mechanism. Quadrant analysis is a very effective technique for turbulence data post-processing, that has been widely used in multiphase turbulence analysis, primarily for turbulent shear flow studies, and it can be tracked back to Wallace, Eckelmann & Brodkey (Reference Wallace, Eckelmann and Brodkey1972). Measuring on the cough jet in the computational domain, we use the  $Q$-criterion to identify and visualize the vortex structures (Hunt, Wray & Moin Reference Hunt, Wray and Moin1988). To do so, we first calculate the eigenvalues of the velocity gradient tensor by solving the following cubic characteristic polynomial equation,
 $\det (\boldsymbol {\nabla }\boldsymbol {v}-\lambda \boldsymbol {I})=0$, i.e.
 \begin{equation} \lambda^3+P\lambda^2+Q\lambda+R=0, \end{equation}
where  $\boldsymbol {v}$ is the velocity field of the air, the quantities
 $P$,
 $Q$ and
 $R$ are the three invariants of the velocity gradient tensor, and
 $\boldsymbol {I}$ is the second-order identity tensor. The velocity gradient
 $\boldsymbol {\nabla }\boldsymbol {v}$ can be decomposed into two parts as
 \begin{equation} \boldsymbol{\nabla}\boldsymbol{v} =\tfrac{1}{2}(\boldsymbol{\nabla}\boldsymbol{v} +\boldsymbol{\nabla}\boldsymbol{v}^{\rm T}) +\tfrac{1}{2}(\boldsymbol{\nabla}\boldsymbol{v} -\boldsymbol{\nabla}\boldsymbol{v}^{\rm T}) =\boldsymbol{S}+\boldsymbol{\varOmega}. \end{equation}
Here  $\boldsymbol {S}$ is the symmetric part of the velocity gradient, known as the strain-rate tensor; while
 $\boldsymbol {\varOmega }$ is the antisymmetric part of the velocity gradient, known as the vorticity tensor. The scalar quantity
 $Q$ can be defined as follows:
 \begin{equation} Q=\tfrac{1}{2}(\Vert\boldsymbol{\varOmega}\Vert^2-\Vert\boldsymbol{S}\Vert^2). \end{equation}
When  $Q>0$, it indicates the presence of a vortex. Thus, by definition, this
 $Q$-criterion defines the vortex distribution as the region where the norm of the vorticity tensor is larger than the norm of the strain-rate tensor (Hunt et al. Reference Hunt, Wray and Moin1988).
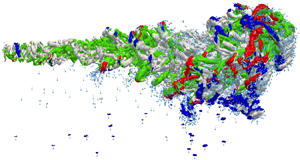
In order to clearly visualize and display the vortex structures, we choose the  $Q$ value to be 100 for a clear view without much loss of the details of vortices. In such a manner, we have the spatial development of the coherent vortex structures of CVD20V22a visualized from our numerical results for the cough jet with droplets inside, as shown in figure 6. Near the exhalation inlet, corrugated Kelvin–Helmholtz (KH) vortex rings are formed by the shear layer between the jet and its surrounding air upstream of the jet for both
 $t=0.05\ \mathrm {s}$ and
 $t=0.25\ \mathrm {s}$, where they line up to a street of ring-like vortices. This phenomenon has also been reported in various experimental and numerical studies (e.g. Yule Reference Yule1978; Kalghatgi & Acharya Reference Kalghatgi and Acharya2014; Zandian, Sirignano & Hussain Reference Zandian, Sirignano and Hussain2019). Following the downstream motion, the instability of the vortices grows as the KH vortex structures start pairing and merging. The entanglement of distorted vortices that leads to turbulent flow propagates from the jet surface to both inside and outside, and hairpin structures are eventually formed at the downstream segment of the jet with relatively large-scale size, as observed by Zhou et al. (Reference Zhou, Adrian, Balachandar and Kendall1999) and Zandian, Sirignano & Hussain (Reference Zandian, Sirignano and Hussain2018).
Illustration of the coherent vortical structures for the case with droplets at  $t=0.25\ \mathrm {s}$. The vortical structures are visualized with a value of
 $Q=100$, where the colour represents the streamwise vorticity field,
 $\omega _u$. Magnified views of the Kelvin–Helmholtz vortices near the exhalation point, the hairpin vortical structures in the jet, and the vortex rings stimulated by droplets are also shown.

In our numerical results, we find massive chaotic hairpin vortex structures evolving after the interactions of KH vortices from upstream, which are the primary elements of the jet puff. This observation differs from some other findings in the literature (Zandian et al. Reference Zandian, Sirignano and Hussain2019; Constante-Amores et al. Reference Constante-Amores, Kahouadji, Batchvarov, Shin, Chergui, Juric and Matar2021), where the mushroom structure is maintained throughout the scope, due to the constant velocity of the injection flow in their works. In fact, magnified views of the hairpin vortical structures show that an appreciable quantity of them are highly asymmetric, which implies that one leg of the hairpin vortex is stronger and longer than the other. Once the asymmetry is established, it will persist and dominate the evolution of the hairpin vortex structure, which consequently develops into an asymmetric  $\varOmega$-shaped structure and finally breaks down, as illustrated later in figures 11 and 12. Moreover, a considerable number of vortex rings are formed in our results, which follow the motion of a droplet whose diameter is larger than
 $70\ \mathrm {\mu }{\mathrm {m}}$ due to gravity. Their formation is stimulated by the droplet settling motion and the surrounding suspended ambient air, and it is helpful to increase the air friction when the droplet particle is falling down. Similar vortex ring structures have been observed in liquids by Chapman & Critchlow (Reference Chapman and Critchlow1967) and Tarasov & Yakushev (Reference Tarasov and Yakushev1974).
We now examine the evolution of the turbulence structure that has been affected by the introduction of droplets into the injected cough jet. Figures 7–12 give the evolutionary progress of the vortex structures from  $t=0.05\ \mathrm {s}$ to
 $t=1.50\ \mathrm {s}$ for a cough jet with and without droplets. As illustrated in figure 7, initially, when the cough jet starts to spout, the head vortex structure and the upstream KH vortices are almost identical for both cases. Little difference could be found in terms of the distribution of the streamwise vorticity and geometry for the street of KH vortex ring structures and the leading mushroom-shaped vortex structure.
Turbulence structure at  $t=0.05\ {\rm s}$ for a cough jet (a) without droplets and (b) with droplets.

Those differences are dramatically widened at  $t=0.25\ \mathrm {s}$ as is apparent in figure 8. A remarkable asymmetric vortex structure could be observed in the body and the puff of the jet in the case where no droplets are introduced. The KH vortex rings retain their shapes along the street before completely pairing and merging into hairpin vortices due to the KH instability, which introduces significant asymmetry for the turbulence structures of the jet, and leads to a highly asymmetric jet body, as shown in figure 8(a). In contrast, our results show an overall symmetric jet with localized asymmetry of the hairpin vortices for droplet introduction. Many vortex rings can be observed below the cough jet formation, which spans from the injection point to the mixing region where hairpin vortices form and develop. The peak velocity of the injection occurs at approximately
 $t=0.065\ \mathrm {s}$, which is earlier than the time shown in figure 8, when the strong interaction in the shear layer produces numerous inner vortices that carry great energy, which are not as clearly visible as those that are underneath the interface.
Turbulence structure at  $t=0.25\ {\rm s}$ for a cough jet (a) without droplets and (b) with droplets.

The vortex structures and the distribution of droplets at  $t=0.5 \mathrm {s}$ are visualized and illustrated in figure 9, in which distinct characteristics of the turbulence structures could be recognized between CVD20V22a and CVD20N22a. In the case with no droplets, the hairpin cluster indicates a strong upwash generated above the jet front, which may provide extra buoyancy to the air particles. Correspondingly, the tendency for ascent in a droplet-containing jet is somewhat weakened potentially due to energy exchange between the droplet particles and the vortices. The interplay between the droplets and vortices will be further discussed in § 3.1. It is worth noting that more vortex rings are generated below the main jet body that follows the free falling of the droplet particles as shown in figure 9(b). In comparison to previous time frames, weak streamwise vorticity can be seen from the contours in lighter colour, which indicates the dissipation of the turbulence energy and fast-decaying vortices. Complex vortical flow and entanglement of the vortex structures can be found in both cases, which is mainly resulting from the KH instability.
Turbulence structure at  $t=0.5\ {\rm s}$ for a cough jet (a) without droplets and (b) with droplets. (c) A cough jet with droplets represented by blue spheres.

Figure 10 gives the turbulence and vortex structure coloured by streamwise vorticity at  $t=0.75\ \mathrm {s}$ for both cases. At this stage, the injection of the cough jet has been ended already at
 $t=0.6\ \mathrm {s}$. Without the input of kinetic energy, inertia now provides the streamwise motion and dominates the vortex evolution. Massive vortices merging and decaying occur due to the streamwise velocity deficit. Chaotic hairpin vortex structures now appear more clearly in a coherent packet, which spans from the injection point to the tail of the jet front, as shown in figure 10(a). In figure 10, this packet is not clear, as it was distorted by the primary jet leading vortex flow, which is oriented upright in the figure, and the secondary vortex flow, which moves consistently along the principal axis of the cough jet, has a noticeable downward motion.
Turbulence structure at  $t=0.75\ {\rm s}$ for a cough jet (a) without droplets and (b) with droplets.

Figures 11 and 12 present the turbulence and vortex structure coloured by streamwise vorticity at  $t=1.0\ \mathrm {s}$ and
 $t=1.5\ \mathrm {s}$, respectively. The vortex structures evolve continuously and decay fast. The amount of hairpin vortices reduces as the streamwise velocity of the jet flow drops due to the fluid viscosity. The merging of the hairpin vortices can be clearly observed near the injection point on the left, where only the legs of the hairpin vortices are left in the packet, that resemble quasi-streamwise vortices, as shown in figure 11(a). At the same time, relatively more intact hairpin vortex structures are maintained that resemble asymmetric one-sided cane- or hook-like hairpin vortices in the droplet-containing case, as depicted in figure 11(b). When the time reaches
 $t=1.50\ \mathrm {s}$, most of the vortices have decayed and vanished, while we observe arch-shaped vortices breaking down in the wake region of the jet for both cases.
Turbulence structure at  $t=1.00\ {\rm s}$ for a cough jet (a) without droplets and (b) with droplets.

Turbulence structure at  $t=1.50\ {\rm s}$ for a cough jet (a) without droplets and (b) with droplets.

3.1. Quadrant analysis and droplet interaction
Following Wallace (Reference Wallace2016), we can classify the products of the fluctuating velocity field in the jetwise direction  $u$ and ground-normal direction
 $w$ into four different quadrants, Q1
 $(+u,+w)$, Q2
 $(-u,+w)$, Q3
 $(-u,-w)$ and Q4
 $(+u,-w)$, which can be called the quadrants of the Reynolds shear-stress plane. By doing so, we can exploit the useful information contained in the signs of the fluctuating velocity field and quantitatively understand the dispersion of expiratory droplets. The Q2 and Q4 motions are associated with the ejection and sweep events visualized by Corino & Brodkey (Reference Corino and Brodkey1969), and the Q1 and Q3 motions are named outward and inward interactions after Wallace et al. (Reference Wallace, Eckelmann and Brodkey1972).
Figures 13–18 provide comparisons of the turbulence structures of the cough jet, which are classified into four quadrants for the puff cloud with droplets involved in the injected jet for a time sequence  $t=0.05$ to
 $t=1.5\ {\rm s}$. For all these figures, the quadrants are plotted in unique colours, i.e. Q1
 $(+u,+w)$ in green, Q2
 $(-u,+w)$ in red, Q3
 $(-u,-w)$ in blue and Q4
 $(+u,-w)$ in grey, and arrows denote the position and velocity orientation of the droplets.
Spatial distribution of different quadrants, Q1 (green), Q2 (red), Q3 (blue) and Q4 (grey). Colour contours are the Reynolds shear stress isosurfaces at  $t=0.05\ \mathrm {s}$, and the arrows show the direction of motion of the droplets.

In the beginning stage of coughing, as the cough jet comes out of the mouth at  $t=0.05\ {\rm s}$, one could observe the vortices forming right at the exhalation outlet, as illustrated in figure 13, in which numerous droplets are spat out into the jet, which are denoted by the blue arrows. In this study, the cough jet is considerably distant from the ground, typically 1.6 m; thus we believe that it is the resistance coming from the surrounding ambient air particles in front of the cough jet frontal cloud that causes the complex interactions between the jet and the ambient particles. That strong interaction effectively transfers the kinetic energy from the inhalation jet to its surrounding particles, which is mainly active at the jet front in the very beginning. This process does not introduce much shear flow at the front, since the ambient air is either pushed aside or accelerated to move ahead; thus not much disturbance structure is formed in front of the jet at this stage. On the other hand, as the cough jet front moves forward fast, a significant velocity difference emerges between the inner jet body and its enveloping particles, which generates a strong shear layer that separates the jetting fluid and the ambient particles, leading to the formation of a KH vortex near the injection point.
At 0.25 s after the beginning of the cough, one can find massive turbulence structures being generated and evolving as the injection flow continues, as illustrated in figure 14. Most of the Q2 (red) Reynolds shear stress isosurfaces are located near the front and the bottom of the leading frontal cloud, with little appearance near the exhalation entrance. In Wallace et al. (Reference Wallace, Eckelmann and Brodkey1972), the authors associate the Q2 motion with the ejection-type motion, in which the fluid element moves outward from the wall of the pipe, and the Q4 motion with the sweep motion. The Q1 and Q3 motions are called outward and inward interactions. In the present study, the cough jet is not directly restrained with a solid wall, such that these quadrants represent a different mechanism. In figures 15–17, we can find many small vortex rings following the free fall of the droplets, as depicted by the arrows. We call those dandelion-like spatio-temporal structures ‘turbulence rain’ (see figure 15), which are actually the large droplets with their tailing vortices. In the present work, the vortex rings are visible only if the droplet diameter is greater than  $70\ \mathrm {\mu }{\rm m}$.
Spatial distribution of different quadrants and the ‘turbulence rain’, Q1 (green), Q2 (red), Q3 (blue) and Q4 (grey), with the Reynolds shear stress isosurfaces at  $t=0.25\ \mathrm {s}$ (arrows show the direction of motion of the droplets).

Spatial distribution of different quadrants and the ‘turbulence rain’, Q1 (green), Q2 (red), Q3 (blue) and Q4 (grey), with the Reynolds shear stress isosurfaces at  $t=0.5\ \mathrm {s}$ (arrows show the direction of motion of the droplets).

Spatial distribution of different quadrants the ‘turbulence rain’, Q1 (green), Q2 (red), Q3 (blue) and Q4 (grey), with the Reynolds shear stress isosurfaces at  $t=0.75\ \mathrm {s}$ (arrows show the direction of motion of the droplets).

Spatial distribution of different quadrants, Q1 (green), Q2 (red), Q3 (blue) and Q4 (grey), with the Reynolds shear stress isosurfaces at  $t=1.0\ \mathrm {s}$ (arrows show the direction of motion of the droplets).

Spatial distribution of different quadrants, Q1 (green), Q2 (red), Q3 (blue) and Q4 (grey), with the Reynolds shear stress isosurfaces at  $t=1.5\ \mathrm {s}$ (arrows show the direction of motion of the droplets).

In short, the strong shear layer that eventually forms at the outer edge of the cough jet will introduce massive disturbance and turbulence structures soon after the exhalation of the jet. The local turbulence carries considerable inertial energy and leads to effective energy transfer between the jet and its ambient air, which amplifies the area of the disturbance region, and leads to the propagation of the jet cloud itself from its envelope surface along the orientation of the exhalation. This may be the reason why the overall shape of the jet is similar to a conical shape. Nevertheless, as the jet flow has high Reynolds number when released from the jet tip, there are also abundant turbulence structures created from the inner part of the jet which interact with the disturbance generated at the lateral border of the jet, as illustrated in figure 14 for both cases. As a result of the in-depth exchange and interaction of turbulence energy and kinetic energy, one can observe that tiny vortices in the turbulence structures are merging, evolving and decelerating as they move forwards with the flow, as shown in figure 15. To be more specific, the average characteristic length of the vortices is larger for them to be more distinguishable, in terms of the thickness of the vortex legs.
3.2. Statistical comparison of temporal evolution of puff and turbulence structure
Figures 19 and 20 illustrate the temporal evolution of the turbulence structure over four different time frames for five cases with droplets and five cases without droplets, respectively. From a statistical viewpoint, high similarity can be found among the turbulence flows of the cough cloud in the early stage of all 10 cases. At time  $t=0.1 \mathrm s$, the puff develops a head vortex with a KH vortex street following in all simulations. From the next time frame, significant differences start to show up, namely that the puff front is randomly tilted while moving ahead. Readers can find the detailed cough jet evolutions in the supplementary movies available at https://doi.org/10.1017/jfm.2022.334: vortices CJD1 to vortices CJD5 (with droplets) and vortices CJG1 to vortices CJG5 (without droplets).
Temporal evolution of the turbulence structures for different simulation cases with droplets considered in the ejection jet flow, which are: (a) CVD20V22a, (b) CVD20V22b, (c) CVD20V22c, (d) CVD20V22d and (e) CVD20V22e.

Temporal evolution of the turbulence structures for different simulation cases with no droplets considered in the ejection jet flow, which are: (a) CVD20N22a, (b) CVD20N22b, (c) CVD20N22c, (d) CVD20N22d and (e) CVD20N22e.

Another comparison is made of the temporal evolution of the puff volumetric centre and its front, as shown in figures 21 and 22. The travel path of the puff volumetric centre seems to have more consistency when droplets are involved, but it travels closer compared to the group average for cases without droplets, which does not exceed 1.75 m at  $t = 4.0$ s. A similar phenomenon shows up to reveal that a greater distance can be achieved for the puff front if there are no droplets participating. In our case, the mean value is over 2.5 m at
 $t = 4.0\ {\rm s}$, while the upper envelope can go up to 3.2 m at
 $t = 4.0\ {\rm s}$ and the lower boundary goes down to 2.3 m at
 $t = 4.0\ {\rm s}$. Such results suggest the diverse nature of turbulence evolution, which is preferably conserved without droplets.
Temporal evolution for the range and mean path of the puff volumetric centre: (a) cases with droplets and (b) cases without droplets.

Temporal evolution for the range and mean path of the puff front: (a) cases with droplets and (b) cases without droplets.

4. Predictions and comparison with experimental data
In this section, we analyse the overall motion of the droplet cloud formation inside the cough jet, and study the cough jet development and evolution, which are then compared with experimental data.
Because of the statistical nature of turbulent flows, we first compute the statistics of the droplet distribution in the exhaled jet after the cough process is completed. Recall that, in the modelling of droplet ejection, the droplets are dynamically and randomly created with randomly selected diameters based on a lognormal distribution. This means that in each numerical simulation the sequence of the droplets with different diameters may vary, but their overall distribution should be the same. We compare the distribution of the droplet diameter with the experimental observations (Duguid Reference Duguid1946) and plot them in figure 23. Good agreement can be found between the distribution observed in the experiment and the distribution obtained by numerical simulations.
Distribution of droplet diameters compared to experimental observations (Duguid Reference Duguid1946).

To study the time dependence of the cough jet, we measured the averaged velocity in the downstream orientation along the cough jet trajectory at a fixed spatial location, and the results are plotted in figure 24. The velocity value is calculated by averaging the velocity on the plane perpendicular to the streamwise direction at a fixed location  $x=50\ \mathrm {mm}$ downstream from the human mouth. A maximum value of
 $22\ {\rm m}\ {\rm s}^{-1}$ can be found for the average velocity, which is the peak value of the average velocity history curve. After the peak value, the average velocity decreases rapidly, then a slow descent period follows, and finally it drops to zero exponentially. Here we choose to compare the average velocity with the experimental data at three time instants that correspond to the measurement times in the experiments done by Van Sciver et al. (Reference Van Sciver, Miller and Hertzberg2011).
Averaged velocity profile. Inner figure is reprinted from Umayahara et al. (Reference Umayahara, Soh, Sekikawa, Kawae, Otsuka and Tsuji2018). The CPF is the cough peak flow. The CPSL is the cough peak sound pressure level.

In the experiment (Van Sciver et al. Reference Van Sciver, Miller and Hertzberg2011), the velocity field is measured by a particle image velocimetry (PIV) system, which is triggered by the sound of the volunteer's cough that is picked up by a microphone placed above the exhalation hole for the volunteer's mouth. Their measurements were taken at  $20\ \mathrm {\mu }\mathrm {s}$, 0.267 s and 0.534 s after the cough triggered the PIV. Knowing that the peak cough flow comes with the maximum cough sound, as suggested by Umayahara et al. (Reference Umayahara, Soh, Sekikawa, Kawae, Otsuka and Tsuji2018), we take three time instants starting from the peak of the velocity, which are 0.07 s, 0.337 s and 0.604 s. The average velocities are then normalized by its maximum value and compared with experimental data as illustrated in figure 25. From figure 25, one may see that considerable agreement can be found between our results and the experimental data obtained in Van Sciver et al. (Reference Van Sciver, Miller and Hertzberg2011).
Comparison of the normalized velocity ( $v/v^*$) with experimental data (Van Sciver et al. Reference Van Sciver, Miller and Hertzberg2011).

To study the relative motion or dispersion of droplets inside the cough jet, we plot the horizontal velocity histories of the droplet front and the jet front as shown in figure 26(a) and (b), respectively. The results show that, at the end of the coughing event (marked by the vertical blue dashed line), the velocities of both the jet air and the droplet front decay exponentially to zero. The averaged mean values show high consistency between the velocity of the puff front and that of the droplet front, which means that the relative velocity of the droplet front in the puff cloud is considerably small. This implies that there exists a significant drag force onto the droplets, which will keep them moving together with the turbulent cough air formation. The mean horizontal velocity in the puff front peaks while being injected (vertical orange dashed line) and then decays to a value close to  $0.05\ \mathrm {m}\ \mathrm {s}^{-1}$.
Horizontal velocity evolution of (a) the droplet front and (b) the puff front with time.

The time sequences of geometrical morphology of the coughing jet cloud are obtained and visualized in figure 27. The cough jet shown in figure 27 resembles a cone-shaped droplet-laden cloud, which is consistent with the experimental observations reported by Liu & Novoselac (Reference Liu and Novoselac2014) (shown in figure 28). The opening angle of the cone-shaped cough jet is measured vertically, and it is compared with the experimental results in the literature listed in table 2. One may see that there is good agreement between the present results and the experimental data in the literature (e.g. Gupta et al. Reference Gupta, Lin and Chen2009; Tang et al. Reference Tang, Liebner, Craven and Settles2009; Kwon et al. Reference Kwon, Park, Jang, Cho, Park, Kim, Bae and Jang2012; Wei & Li Reference Wei and Li2017).
Evolution of the cough jet cloud obtained in simulations, at the times shown.

Evolution of the jet cough cloud from experiments (Liu & Novoselac Reference Liu and Novoselac2014).

Spreading angle of the cone-shaped cough jet.

Wei & Li (Reference Wei and Li2017) conducted some experiments to reproduce the cough flow in a water tank. They designed a scaling protocol carefully to ensure that the particle motion in the experiments was comparable to the motion of cough droplets in the air. Their experiments provide the particle (glass beads) payloads through a small nozzle equipped with a sediment feeding system. Figure 29 shows the comparison between the present results and the sequence of pictures taken in Wei & Li (Reference Wei and Li2017) for small particles of  $8\text {--}14\ \mathrm {\mu }{\rm m}$ diameter, medium particles of
 $57\text {--}68\ \mathrm {\mu }{\rm m}$ diameter, and large particles of
 $96\text {--}114\ \mathrm {\mu }{\rm m}$ diameter, at a considerably long time after the injection ended (10 times in experiments and about 6.6 times in numerical simulations). Both spatial units are dimensionless, normalized by the nozzle diameter
 $D = 2\ {\rm cm}$.
Sequences of the droplet trajectory compared with the results obtained in experiments (Wei & Li Reference Wei and Li2017) for droplets of different diameters: small,  $d \in 8\text {--}14\ \mathrm {\mu }{\rm m}$ (top panels); medium,
 $d \in 57\text {--}68\ \mathrm {\mu }{\rm m}$ (middle panels); and large,
 $d \in 96\text {--}114\ \mathrm {\mu }{\rm m}$ (bottom panels). (a,c) Our numerical results for a real cough velocity profile with
 $Re=5010$. The pictures overlap from
 $t = 0$ to (a) the time when the injection is ended at
 $t = 0.6\ {\rm s}$ and (c)
 $t = 4\ {\rm s}$. (b,d) The results from Wei & Li (Reference Wei and Li2017) for the pulsation velocity profile with
 $Re=12\,900$. The pictures overlap from
 $t = 0$ to (b) the time when the cough jet is interrupted at
 $t = 0.3\ {\rm s}$ and (d)
 $t = 3\ {\rm s}$.

Despite the fact that the experimental data being compared are taken from a pulsation velocity profile, which has different peak and distribution from the velocity profile, one may see that the overall features of the cough jet show good agreement between the results obtained in the present study and those obtained in the experiments. The results obtained in this study suggest a  $23^\circ$ spread angle of the cone-shaped cough jet, which is comparable to the experimental findings reported in the literature, as listed in table 2. The three different-sized droplet particles travel to almost the same distance
 $x=78D$ in the streamwise direction with a duration
 $t=0.6$ s after the injection of the jet ended in numerical simulations, as illustrated in figure 29(a). The dispersion patterns observed in experiments also show no obvious difference for various types of droplets when injection is interrupted, except that the maximum streamwise travel distance is about
 $x=38D$ when the source fluid is interrupted as shown in figure 29(b). This could be caused by the different type of temporal velocity profile, and a different fluid medium being used in experiments other than air. Nevertheless, the injection duration in experiments is just 0.30 s due to the limitation of the equipment and devices, such that the supply of momentum may be underestimated. Consequently, a shorter injection duration will lead to shorter spreading distance, as discovered by Wei & Li (Reference Wei and Li2017). With that in mind, the maximum distance the particle cloud can travel in our results is also larger than the experimental observation, as expected. Although the final time frame used for the comparison is slightly different, it is reasonable to believe that such a time difference does not introduce much error, since the streamwise velocity has been dropped below
 $0.01\ {\rm m}\ {\rm s}$ at the later stage of coughing.
Comparison between numerical results and experimental data after a sufficient running time reveals that the small particles have a stronger ability to float and stay within the jet, while medium and large droplets leave the puff cloud earlier due to the gravitational force. Moreover, in the numerical simulations, the droplet trajectory sequence shows more swirl motion of the droplets, which is believed to be the consequence of the interplay between droplet particles and turbulent vortices. Hence the formation and evolution of the turbulence vortices have significant effects on the spreading of the droplets, especially when they form enough upwash to provide extra buoyancy to the floating particles. The lifting effect is more obvious and effective when they act on small and medium particles, as shown in the top and middle panels in figure 29(c). Since the intensity of turbulence structures increases with Reynolds number, or the streamwise velocity, it is reasonable to argue that, the longer and the stronger the cough, the greater the volume of gas that will be released, and thus the faster the flow, and the higher the spreading capability of the droplets.
For droplets with diameters  $57\text {--}68\ \mathrm {\mu }{\rm m}$ (medium particles) and
 $96\text {--}114\ \mathrm {\mu }{\rm m}$ (large particles), their trajectories show apparent downward motion to the ground in the experiments, whereas in numerical simulations such trend is imperceptible. Since in our model the range of the droplet diameter actually goes up to
 $500\ \mathrm {\mu } {\rm m}$, we made another comparison for the trajectories of droplets with diameter
 $114\text {--}2000\ \mathrm {\mu }{\rm m}$ (larger particles) between the present results and the experimental results, which are shown in figure 30. One may see that considerable agreement can be found between the present simulation results and the experimental data in the literature on a long time scale. We would like to point out that the distribution of droplet diameters in a real cough may vary continuously. The assumptions made in the scaling experiments may also have unknown significance. Overall, our results imply that the spreading distance of the droplets reaches
 $x=78D$ or
 $1.56\ {\rm m}$ when the exhalation ended, and the maximum streamwise penetration depth is estimated to be
 $x=114D$ or
 $2.28\ {\rm m}$, which is slightly larger than the current physical social distance practised in most countries.
Sequences of the droplet trajectory compared with the experimental data (Wei & Li Reference Wei and Li2017) for droplets of different diameters  $d \in 114\text {--}500\ \mathrm {\mu }{\rm m}$. (a) Our numerical results for the cough velocity profile with
 $Re=5010$. The pictures overlap from
 $t = 0$ to the end of the injection time at
 $t=0.6\ {\rm s}$ (top panel) and
 $t=4 {\rm s}$ (bottom panel). (b) The results from Wei & Li (Reference Wei and Li2017) for the pulsation velocity profile with
 $Re=12\,900$. The pictures overlap from
 $t=0$ to the end of the injection time at
 $t=0.3\ {\rm s}$ (top panel) and
 $t=3\ {\rm s}$ (bottom panel).

It should be noted that in this work we do not consider the evaporation and condensation with heat conduction. As suggested by Ng et al. (Reference Ng, Chong, Yang, Li, Verzicco and Lohse2021), for humid and cold ambient conditions, i.e. temperature less than  $20\,^{\circ }$C, droplets tend to grow by 10 % for a short period of time and then start to evaporate. The small droplets (
 $d < 10\ \mathrm {\mu }\mathrm {m}$) have a quite short evaporation time scale, typically less than 1 s. For droplets that have intermediate size (
 $10\ \mathrm {\mu }{\rm m} < d < 50\ \mathrm {\mu }{\rm m}$), they have longer lifetime (from 1 s to more than 10 s), and will have increased chances of virus transmission. For both intermediate size (
 $20\ \mathrm {\mu }{\rm m} < d < 50\ \mathrm {\mu }{\rm m}$) and large size droplets (
 ${>}50\ \mathrm {\mu }{\rm m}$), their evaporation times are relatively longer, so that their sizes do not change significantly during the turbulence state, which is about 2 s as our simulations suggested. Moreover, as indicated by Chaudhuri et al. (Reference Chaudhuri, Basu, Kabi, Unni and Saha2020), only the intermediate droplets will have the maximum duration in ambient air before the end of their evaporation time or reaching the ground. However, to model and simulate interaction between evaporation and turbulent flow for the small and intermediate size droplets (
 ${<}50\ \mathrm {\mu }{\rm m}$) would require either DNS or LES simulations with the subgrid length scale at
 $50\ \mathrm {\mu }{\rm m}$ or less, so that the particle spacing of the computational domain will match the characteristic length of the droplets (
 $50\ \mathrm {\mu }{\rm m}$). Consequently, the number of particles in the simulation domain will exceed several hundred billions, if not trillions, which would be a serious undertaking. Nevertheless, the present work is motivated as the first step towards that goal.
To evaluate the state of the droplet flow while the droplets remain within the puff cloud, we calculated the local Reynolds number of the droplets by using the following equation:
 \begin{equation} Re^*=\frac{2\rho_d r_d}{\mu_g}\Vert \boldsymbol{v}_d-\boldsymbol{v}_g\Vert, \end{equation}
where  $\rho _d$ and
 $r_d$ are the mass density and the characteristic length of the drops, and
 $\mu _g$ is the viscosity of the ambient gas phase. The relative velocity is calculated between the droplets and the ambient air. The raw data are processed and displayed in figure 31, which is taken from the case CVD20V22a, where the droplets are represented by spheres with different colours. In the figure, the turbulence structure of the air is plotted as the background reference for the droplets’ position. We represent the droplets that are in the Stokes regime as white spheres, and we represent the droplets that are outside the Stokes regime as dark coloured spheres.
Spatial distribution of the droplets coloured by their local Reynolds number at  $t=1\ {\rm s}$; the droplets within the Stokes regime are depicted by white colour.

The conventional Lagrangian tracking approach assumes that most of the droplets are in the Stokes regime, i.e. the relative velocity between the droplets and the ambient air is low, and hence the one-way coupling may be an acceptable approximation. As shown in figure 31, there are quite a number of droplets outside of the Stokes regime, which are mainly droplets with large diameter,  $d>100\ \mathrm {\mu }{\rm m}$. For those droplets, they have large relative velocities with respect to the ambient air, and thus the two-way coupling becomes important.
5. Conclusions
In this work, a large-scale multiphase LES has been performed by using the WCSPH method. We explicitly model the cough jet ejected from a human's mouth by a two-phase mixture jet according to the experimental data of the velocity profile of the exhalation flow and the statistics of droplet sizes. The coupling and interaction between the two phases in the cough jet and the ambient surrounding air are studied and simulated as the interaction between gas particles and droplet particles.
The simulation results reveal that our numerical results have good agreement with the experimental observations reported in the literature in terms of the evolution of the overall shape of the cough jet cloud. Together with the experimental data in the literature, our results also indicate that the smaller droplet particles may travel further into the air, as they are easier to be carried and lifted by upward vortices. The evolution of the vortex structures is analysed, and the quadrant analysis of turbulent cough flow is also performed and discussed. The interaction between the vortex and the droplets indicates that the upwash and upward vortex structures can effectively push droplets to travel further. It is found that the intensity of the turbulence structure is strongly and positively correlated with the injection velocity of the cough jet. The penetration distance of the droplets will be extended if they encounter more turbulence vortices and confront the upward vortices before sinking and breaking into small pieces, which could be produced by stronger coughs with longer duration.
The results of the present study clearly demonstrate that the two-way coupling between the droplets and the ambient air has significant effects on the evolution of the cough flow turbulence, which increases the complexity and butterfly effect introduced by the disturbance. For instance, it was found that a small difference in ejection velocity distributions or boundary conditions may lead to entirely different consequences, such as the cough jet splitting. In this study, for a given droplet ejection velocity distribution, we find that the difference in the average duration of cough cloud turbulence lifetimes of 10 simulated cases with and without droplets is 1.93 s to 2.03 s, which is a non-negligible 5 % reduction. This indicates that an uncoupled approach may overestimate the duration of the turbulence state of cough clouds. Most importantly, it is found in the two-way coupling approach that, while bigger droplets fall out of the puff cloud towards the ground, they drag some air fragments along with them, forming the so-called ‘turbulence rain’, which may prolong their settling time. Moreover, because of the possibility of droplet-to-aerosol transition, we find that the prediction of the spreading distance of virus-laden droplet particles may go beyond the physical social distancing rules in most countries for moderately strong coughs, which reminds us of the risk of virus exposure, even if we follow the protecting protocol.
Supplementary movies
Supplementary movies are available at https://doi.org/10.1017/jfm.2022.334.
Funding
This research was initially conducted at the University of California–Berkeley. The authors thank Berkeley IT (Information Technology) for providing its high-performance computing service (Savio). X.L. was supported by a postdoctoral fellowship from the China Scholar Council (CSC no. 201806955100) in addition to research funds from the National Natural Science Foundation of China (nos 11802214 and 11972267). J.Y. was supported by a graduate fellowship from the China Scholarship Council (no. 201706680105). These supports are gratefully acknowledged.
Declaration of interests
The authors declare that they have no known competing financial interests or personal relationships that could have appeared to influence the work reported in this paper.


 Open access

