I. INTRODUCTION
Porous metals have been shown to have higher acoustic damping, reduced density, and greater energy absorption compared with their solid counterpartsReference Banhart1 leading to a number of vibration-related applications. The introduction of pores into a solid structure, however, does also result in reduction of modulus, strength, and toughness. The variation in some properties can depend strongly on the number density, shape, and alignment of the pores present in the metal/alloy.Reference Drenchev, Sobczak, Malinov and Sha2,Reference Nakajima3 The expansion of the range of applications in which porous metals would be beneficial requires that appropriate pore distributions are introduced into the solid metal. While an empirical approach can achieve this, the design of suitable porous structures would be accelerated if a verified model was available to simulate the behavior of these materials.
NakajimaReference Nakajima3 has shown that the resultant yield stress of a porous material can be calculated from Eq. (1). This is a 2D solution and does not account for pore distribution within the material. Good agreement was seen when compared with experimental data for pore fractions up to 40% porosity for modulus and ultimate tensile strength. However, yield strength in porous copper was poorly predicted, with up to 60% discrepancies being seen at pore fractions between 10–30% porosity (it was noted that these samples showed very little ductility). The relationship shown by Eq. (1) is based on the stress intensity factor of a pore; however, this equation does not resolve the shear stresses that would result when multiple pores interact.
 $${\rm{\sigma }}_{\rm{y}} = {\rm{\sigma }}_{\rm{0}} (1 - p)^{1 + (2 \times {a \over b})} \quad ,$$
where σy and σ0 are the yield stresses of the porous and solid material, respectively, p is the pore volume fraction, and a and b are the pore dimensions (a being the length perpendicular to the loading axis).
A number of dissimilar material applications, e.g., metallization of ceramics or ceramic–metal joints, involve the application of thermal schedules to material combinations with considerably different thermal and mechanical properties.Reference Bidadi, Sobhanian, Mazidi, Hasanli and Khorram4 Depending on the geometry and the types of materials involved, thermal stresses can build up during processing leading to distortion or even cracking of the ceramic material involved.Reference Steinzig5 One method of reducing the thermal stresses in the ceramic is to reduce the yield stress of the metallic component so that it deforms plastically during the thermal cycle, relieving stresses on the brittle component. If the metallic component is used to provide electrical conductivity, then it is necessary to maintain low resistivity as the yield stress decreases.
One method of significantly reducing the yield stress of a metal is to introduce pores; metals, especially copper can be manufactured in porous form through the GASAR method. This method involves the saturating liquid metal with a gas (usually hydrogen) and directionally solidifying.Reference Drenchev, Sobczak, Malinov and Sha2,Reference Nakajima3,Reference Steinzig5 Due to the higher solubility of hydrogen in the liquid phase, as the metal is cooled, a gas/solid eutectic is formed. The directional solidification allows aligned pores orientated parallel to the thermal gradient to be developed. Pore size can be controlled by the partial pressure of the gas within the chamber as well as the type of gas used (hydrogen has high diffusivity, therefore generally creating larger pores, other gases such as nitrogen and argon are also used). Typical values for this method have shown pore volume fractions up to 0.75, pore diameters between 30 and 150 μm, and lengths up to 1 cm.Reference Drenchev, Sobczak, Malinov and Sha2,Reference Kee, Matic and Popels6
This study simulates the influence of different pore distributions on the proof stress and conductivity of the copper strip suitable for connectors along with experimental validation. The simulation presented will allow mechanical and electrical properties to be optimized as is needed for minimization of thermally induced stresses.
II. METHODOLOGY
A finite element (FE) model using the COMSOL Multiphysics 4.3a7 platform has been developed that allows a variety of pores to be introduced into a representative copper matrix while using the mechanical and electrical modules of the multiphysics software to determine yield stress and resistivity. The COMSOL simulation was solved implicitly, i.e., uses solution iterations to achieve convergence and so is limited to quasistatic applications.
The selection of this platform allowed binary 2D or 3D images (from optical microscopy or x-ray tomography) to be imported so that real porous structures were also used as the basis of simulations once fabricated. This allowed more rapid validation and verification of the simulations.
A. Model formulation
1. Sample geometry
The FE model developed initially used a cubic unit cell, which was manually populated with pores. The use of a unit cell-based model has been shown to be effective in modeling the macroscopic behavior of composites. For example, Yang et al.,Reference Yang, Wu, Sha, Zhang and Huang8 reported <10% discrepancy from experimental values for yield stress predictions in particle-reinforced composites when using a unit cell configuration. The GASAR materials being modeled in this study are similar to particle-reinforced composites.
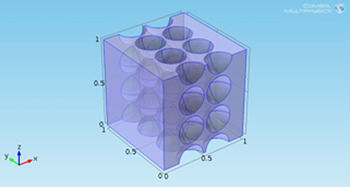
Initially, spherical pores were used, but other shapes have been simulated. Figure 1 shows a typical geometry used to simulate the mechanical and electrical properties of porous copper. This example is a 2 × 2 × 2 unit cell (having a 2 × 2 × 2 grid of whole voids in the unit cell), the physical size of these pores does not need to be comparable to the final application, what is important is the relative size to the unit cell. The x-axis refers to the loading direction in the simulation and tests; variation in the orientation of the pores relative to the loading axis allows more sophisticated models to be produced. By changing the number of unit cells, or by altering the pore distribution inside the cell, a range of strips can be simulated with variations in pore shape, volume fraction, and distribution. A free tetrahedral mesh was implemented with a maximum element length of 0.02 mm (a smaller mesh did not result in a noticeable change in the simulation). The pressure inside the pore is assumed to be 1 atmosphere.
Geometry of a porous structure used in the unit cell simulations. This is an example of a 2 × 2 × 2 grid.

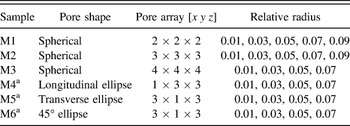
Table I shows a list of the different pore arrays used in the model to understand the influence of pore shape, size, and number density. The assumptions made in this model were: the pores were assumed to have zero mechanical strength and electrical conductivity; the pores were also assumed to introduce no change in properties of the bulk material.
Pore size, shape, and arrays used in the unit cell simulation.

a The elliptical pores had a set length of 0.5 mm.
2. Mechanical and electrical loading
Electrical and the mechanical loads were both applied to the unit cell along the x-axis. In a single step, an electrical potential of 10 V is applied between the two surfaces in the y–z plane to simulate current flow through the strip thickness. This gives a single value of current density for the unit cell.
The mechanical loading was separated into time steps to represent increased levels of deformation encompassing elastic and plastic deformation, which resulted in nonlinear behavior. A time-dependent load was applied to the same two planes in the same direction as used for the electrical potential, with the load being represented as load (kN) = 80 × 106 × time (s). The input material properties were rate-independent, so that stepping simply allowed for an incremental load to be applied (a step size of 0.05 was used up to 1 s). Deformation in the x-axis was measured as a function of the applied load.
3. Material samples and characterization
The elastic–plastic behavior of copper was obtained from simple tensile tests on a 100 × 10 × 2 mm C101 grade copper sample (three repeats) in a Zwick Z100 (Ulm, Germany). The sample was tested to 10% total elongation at a rate of 2 mm/min.
For this study, the 0.2% proof stress has been determined from simulations for comparative purposes; this will be higher than the yield stress but is easier to define experimentally, and therefore, the simulated behavior can be compared directly with experimental work.
4. Validation of mechanically induced pore samples
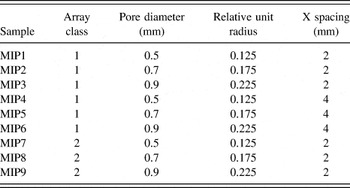
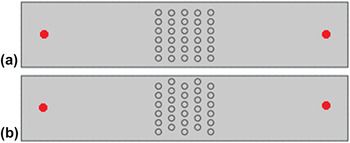
To validate the model, 27 samples (9 arrays with 3 repeats) of 50 × 10 × 10 mm C101 grade copper blocks were machined with mechanically induced pores oriented through the thickness of the sample. The pore spacings and sizes are summarized in Table II, and the array classes are shown schematically in Fig. 2. In all cases, y spacing was 1.42 mm, and in class 2, however, columns 2 and 4 have been shifted by 0.7 mm in the y direction to offset the pores. These sample geometries were simulated using the unit cell-based model proposed above. Because these samples have through thickness pores, then a single unit cell can be used in the thickness (z) direction, with multiple cells in the x–y plane.
List of samples simulated and fabricated with mechanically induced pores.

Schematic diagram to show the pore arrangement for (a) class 1 and (b) class 2. The red dots signify the location between which the resistance measurements were taken.

The material characterization for these specimens was carried out through resistivity measurements and simple uniaxial tensile measurements. Resistivity measurements were carried out using a Cropico Microhmmeter DO5000 (Durham, UK) 4-point resistance measurement, and the resistance was measured between two points with a gauge length of 30.2 mm (Fig. 2). Tensile testing was carried out on an Instron 3345 (Wycombe, UK) on 50 × 10 × 1.5 mm specimens taken from each sample; tests were carried out at the rate of 2 mm/min.
III. RESULTS AND DISCUSSION
A. Electrical properties
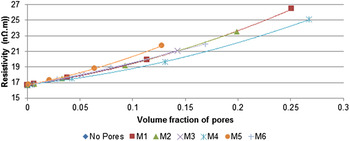
Figure 3 shows the current density of samples with spherical pores and different unit cells (2, 3, and 4), with a range of pore radii to change the pore volume fraction (V f). The resistivity for spherical pores was independent of pore number density, with all the predicted values falling on a single resistance/V f line. It can also be seen that there is a very strong relationship between volume fraction of pores and resistivity of copper.
The predicted influence of pore shape and volume fraction on resistivity.

The spherical pores used in Fig. 3 were shown to give pro rata increase in resistivity with volume fraction of pores. As noted above, GASAR-induced pores are elongated, and therefore, shape effects have also been simulated. Figure 3 shows the simulation results for elliptical pores in terms of resistivity. All pore shapes show a similar trend in resistivity with volume fraction, with small changes in resistivity being seen with pore directionality. Alignment of the nonspherical pores with the loading axis is predicted to noticeably reduce the resistivity of the sample compared with other samples of similar volume fractions. This is due to the smaller cross-sectional area that these pores present to the current flow direction, and therefore, flow is disrupted much less. However, cross-section is not the sole contributor to the resistivity of these samples. Samples M2 and M4 show different resistivity but share a common minimum metal cross-section. For a cross-sectional fraction of 13.9%, M2 shows a resistivity of 19.1 nΩ m, whereas M4 has a resistivity of 25.1 nΩ m (M2 has 18% lower volume fraction than M4). Also current concentrations were noticed in the spherical pores (when compared with the longitudinal elliptical pores). This may result in an effectively charged pore surface, repelling other charged particles into the remaining cross-section. This would not be accounted for in a simple cross-section calculation.
Therefore, maximum conductivity at high volume fractions will be seen where pores are aligned parallel to the loading axis.
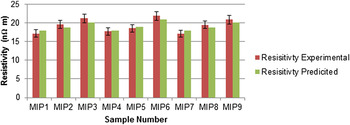
The experimental and predicted resistivity of the porous copper samples 1–9 is presented in Fig. 4. As indicated in Tables I and II, the mechanically induced pores were represented by a unit cell containing pores with a larger relative radius than in the initial simulations. This scaling should hold for the unit cell approach, but this is still an assumption in this study. Good agreement can be seen between the model and experimental results. The influence of pore size (and therefore volume fraction) was to increase resistivity by 16% for pore volume fractions from 0.07 to 0.21.
Predicted and experimentally determined resistivity values for samples MIP1-MIP9.

B. Mechanical properties
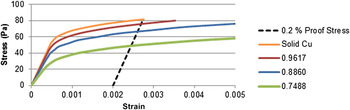
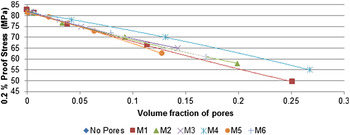
Figure 5 shows typical stress–strain curves predicted from simulations of porous copper. It can be seen that the 0.2% proof stress of pure copper (the intersect between the “proof” and “solid Cu” curves) is shown to be approximately 80 MPa. The introduction of pores results in lowering of the overall Young’s modulus and an earlier onset of plastic deformation. Figure 6 shows the relationship between 0.2% proof stress and porosity. It can be seen that again there is no noticeable difference between using a 2 × 2 × 2, 3 × 3 × 3, or 4 × 4 × 4 unit grid reaffirming the scalability of this model. A largely linear dependence of 0.2% proof stress on the pore volume fraction is exhibited, with a 25% pore volume fraction reducing the proof stress by over half (26 MPa).
Simulated stress–strain curves for porous copper (2 × 2 × 2 grid). The series name refers to the volume fraction of copper.

Simulated 0.2% proof stress values for copper samples with different pore shapes and volume fractions.

Results from simulation of the mechanical response of copper with pore configurations provided in Table I are shown in Fig. 6. This figure indicates that there is a strong influence of pore shape on the 0.2% proof stress of the porous copper. Longitudinal pores give the highest strength to volume fraction ratio, and for many applications, a high strength/weight ratio is required, and therefore, this alignment of pores is usually chosen.
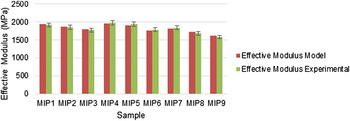
From tensile testing of samples 1–9, the 0.2% proof stress point was not reached. This was due to the stress concentrations around the pores, resulting in rapid failure of the sample. Figure 7 shows the effective modulus (gradient of the engineering stress/strain prior to failure), which indicates good agreement between simulation using a unit cell-based model with the parameters in Table II and experiment for all the samples. No significant difference can be seen between samples where the pore spacing in the transverse direction has been varied; however, when there is misalignment in the loading axis (class 2), a noticeable decrease in the effective modulus can be seen. This is due to the reduction of solid copper strain path that is parallel to the loading direction and is therefore heavily dependent on the pore cross-sectional area. The reduced ductility of these samples can be attributed to the reduced cross-sectional area of copper, in addition to the influence of the shear stresses in the 45° plane. With a low pore fraction seen in these samples, pore distribution varies significantly in the y-axis, resulting in a large degree of shearing.
Experimental and predicted effective modulus values for samples 1–9. The error bar represents the range of values obtained experimentally.

C. GASAR copper
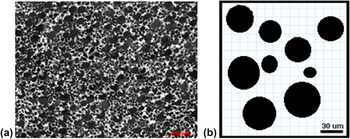
The model was also validated against a GASAR sample. The GASAR samples tested were of the same dimensions as those tested for the mechanically induced pores. A sample of GASAR material was supplied by the Foundry Research Institute in Poland and was fabricated using ETP copper in a pure hydrogen atmosphere. Average pore diameter and volume fraction were approximately 30 μm and 47%, respectively. Using an optical image of the surface of the GASAR sample (Figure 8), a 3D geometry was fabricated assuming constant pore thickness through the sample. The sample was loaded perpendicular to the pores.
(a) Optical image of the GASAR sample used to create (b) a 2D model representation for modeling (the shaded area depicting the pores).

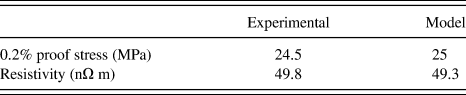
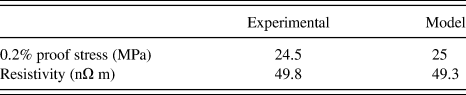
The same sample testing schedule was carried out on the GASAR sample as that used for the mechanically induced porous samples. A summary of the results of tensile and resistivity testing conducted on the GASAR sample and that predicted by the proposed model is shown in Table III. It can be seen that there is good agreement between predicted and experimental results, even though the GASAR sample has a higher pore fraction and the random pore distribution. The latter point acts to reduce the influence of the 45° shear stresses in the GASAR sample leading to closer agreement for both simulation and experiment. This results in the model fitting the experimental data to the same degree of accuracy with the mechanically induced pore samples, while maintaining sufficient ductility to allow measurement of the proof stress. To further develop this model, MicroCT scans will be needed to fully characterize the 3D microstructure and to be used as a model input.
Predicted and experimental results for the GASAR sample.
Previous work carried out by Drenchev et al.Reference Drenchev, Sobczak, Sobczak, Sha and Malinov9 has shown that the microstructural features of GASAR material can be predicted from the processing parameters. If this model is used in combination with the model presented here, then a prediction of final mechanical properties of the material based on the processing inputs should be possible. This would allow the tailoring of GASAR material for specific applications.
IV. CONCLUSION
A model has been fabricated to characterize the influence of size and distribution on the electromechanical properties of porous copper structures.
The model was validated against samples of copper with mechanically induced pores. Resistivity predictions agreed within error with the experimental data. These samples had insufficient ductility to conduct a proof stress evaluation but modeling predictions of the effective modulus agreed well with experimental testing for the pores that were aligned in both along and transverse to the tensile axis.
The model proposed shows that there is a strong relationship between pores aspect ratio and the 0.2% proof stress and resistivity. A greater reduction in proof stress is seen when the pores are aligned perpendicular to the loading direction. Whereas to maintain low resistivity, pores aligned parallel to the loading direction show preferential properties.
A GASAR sample was also modeled, assuming constant pore thickness through the sample, and the sample showed excellent agreement with the modeling predictions. Further evaluation needs to be carried out on 3D characterization of the sample to be used as an input.
ACKNOWLEDGMENT
The authors wish to acknowledge the contribution of funding from the FP7 grant (FP7-SME-2012–286943).