In 1989, the W. T. Grant Foundation issued an influential report, The Forgotten Half: Non-College Bound Youth in America, an analysis of life situations of young people who do not attend college after high school. Twenty years later, the forgotten half remains forgotten in the sense that programmatic, longitudinal studies of young people who are not college bound are rare. The majority of rural African American emerging adults in the South are part of the forgotten half. Only 12% of African American secondary school graduates in the rural Southern counties in which the present research was conducted complete postsecondary education programs (Boatright & Bachtel, Reference Boatright and Bachtel2005). In these places, the transition routes for emerging adults after secondary school are unstructured and left largely to individual initiative. When they leave school, most rural African Americans have no jobs; eventually, they find part-time or full-time employment performing simple functions in retail and service sector jobs that offer little training and no opportunity for advancement. Job turnover rates are high during this period, as the combined effects of poor preparation for employment and disadvantageous hiring practices make the transition to the workforce a protracted and often demoralizing process (Gore & Aseltine, Reference Gore and Aseltine2003; Holz & Tienda, Reference Holz, Tienda, Denton and Tolnay1998). This challenge occurs while the social controls and support that families provide to some emerging adults start to diminish (Aquilino, Reference Aquilino1997). Many rural African American emerging adults are thus confronted with challenging environments that provide minimal resources and diminishing social support to help them embark on beneficial life paths. Some who see no pathway to adequate subsistence, much less the attainment of life course goals, cope by engaging in risk behaviors that include marijuana use, excessive drinking, and sexual intercourse while using substances (Allison, Adlaf, & Mates, Reference Allison, Adlaf and Mates1997; Folkman, Chesney, Pollack, & Phillips, Reference Folkman, Chesney, Pollack and Phillips1992; Martin, Tuch, & Roman, Reference Martin, Tuch and Roman2003).
The epidemiology of risk behaviors among rural African American emerging adults reflects the aforementioned realities of life in rural, Southern communities. As rural African Americans transition from adolescence to emerging adulthood, their rates of substance use and sexual risk behaviors tend to surpass those of urban dwellers (Kogan, Berkel, Chen, Brody, & Murry, Reference Kogan, Berkel, Chen, Brody and Murry2006; Milhausen et al., Reference Milhausen, Crosby, Yarber, DiClemente, Wingood and Ding2003). These behaviors have prognostic significance for academic failure in college and trade school, increases in externalizing and internalizing symptoms, unintended pregnancy, inability to find and keep employment, involvement with the criminal justice system, and HIV infection (Achenbach, Howell, McConaughy, & Stanger, Reference Achenbach, Howell, McConaughy and Stanger1998; Brook et al., Reference Brook, Adams, Balka, Whiteman, Zhang and Sugerman2004; Chatterji, Reference Chatterji2006; DuRant, Smith, Kreiter, & Krowchuk, Reference DuRant, Smith, Kreiter and Krowchuk1999). HIV infection is a particular risk for African Americans living in the rural South. Their infection rate is more that eight times that of Caucasians in this region and three times that of residents of the United States as a whole (Hall, Li, & McKenna, Reference Hall, Li and McKenna2005). The processes that contribute to increases in risk behaviors during rural African Americans’ transitions from secondary school into employment and workday routines should be identified, not only to advance knowledge of their etiology and the trajectories they foster but also to inform the design of preventive interventions.
We used a three-wave prospective research design that spanned the last year and a half of secondary school and the first year after school to advance and evaluate predictions about the cascade of processes set in motion by life stresses in rural Southern environments. This cascade was hypothesized to forecast increases in risk behavior among rural African American emerging adults. Our predictions about cascade processes were derived from developmental psychopathology theory (Cicchetti & Tucker, Reference Cicchetti and Tucker1994; Masten & Coatsworth, Reference Masten and Coatsworth1998) and, more specifically, from Pearlin and colleagues’ stress proliferation framework (Pearlin, Reference Pearlin1989; Pearlin, Schieman, Fazio, & Meersman, Reference Pearlin, Schieman, Fazio and Meersman2005). Developmental psychopathology theorists have found that functioning in one domain spills over to exert lasting influences on functioning in other domains. Notable exemplars of this theorizing include the research by scientists at the Oregon Social Learning Center, who have chronicled the ways in which antisocial behavior leads to increases in academic and social problems during childhood that, in turn, detract from subsequent functioning in social, relational, emotional, and behavioral realms during adolescence and emerging adulthood (Capaldi, Reference Capaldi1992; Patterson, Reid, & Dishion, Reference Patterson, Reid and Dishion1992). Cicchetti and Schneider-Rosen (Reference Cicchetti and Schneider-Rosen1984) posited developmental cascades in which failure to attain efficacy in important developmental tasks (e.g., academic competence) at one development stage would increase vulnerability for compromised functioning at subsequent stages. Masten and colleagues (Reference Masten, Roisman, Long, Burt, Obradović and Riley2005) applied Cicchetti and Schneider-Rosen's tenets to demonstrate, across a 20-year span, that childhood externalizing problems carry forward to undermine academic competence in adolescence, which subsequently contributes to internalizing problems in emerging adulthood. Thus, changes in one domain have implications for functioning in other areas across time, forming a cascade process.
The specific theoretical model that guided the present predictions was derived from the stress proliferation framework (Pearlin et al., Reference Pearlin, Schieman, Fazio and Meersman2005). The notion of stress proliferation arose from the observation that serious stressors tend to give rise to secondary, or proliferated, stressors that carry forward across time to contribute to changes in important social relationships and individual functioning (Hammen, Reference Hammen and Luthar2003; Pearlin, Aneshensel, & Leblanc, Reference Pearlin, Aneshensel and Leblanc1997). Applied to the current study, life stress, which is conceptualized as negative life events and perceived racial discrimination, sponsors increases in the negative emotions of anger and depressive symptoms, which in turn, contribute to increases in affiliations with deviant companions, specifically friends and romantic partners. We specified affiliation with deviant companions as the proximal risk factor for increases in emerging adults’ risk behavior. In the following sections, we outline the rationale for particular constructs’ inclusion in the model and summarize the hypotheses.
A basic premise of this study is that life stresses sponsor increases in risk behavior. Life stress is a demonstrated risk factor for adolescents’ high-intensity substance use and other risk behavior because it precipitates emotional distress and perceptions of limited efficacy and control (Brody, Chen, et al., Reference Brody, Chen, Murry, Ge, Simons and Gibbons2006). Cross-sectional surveys, prospective surveys, and experience-sampling studies with adolescents in the United States and other countries have found initiation and escalation of risk behaviors to be positively associated with life stress (Aseltine & Gore, Reference Aseltine and Gore2000; Castro, Maddahian, Newcomb, & Bentler, Reference Castro, Maddahian, Newcomb and Bentler1987; Cooper, Shapiro, & Powers, Reference Cooper, Shapiro and Powers1998; He, Kramer, Houser, Hacker, & Chomitz, Reference He, Kramer, Houser, Hacker and Chomitz2004; Patton et al., Reference Patton, Hibbert, Rosier, Carlin, Caust and Bowes1996; Unger, Hamilton, & Sussman, Reference Unger, Hamilton and Sussman2004; Whalen, Jamner, Henker, & Delfino, Reference Whalen, Jamner, Henker and Delfino2001; Windle, Mun, & Windle, Reference Windle, Mun and Windle2005). Baumeister and Scher (Reference Baumeister and Scher1988) advanced a parsimonious interpretation of this link. People desire the quickest possible escape from life stress and the negative affect that accompanies it; this increases the attraction of activities that provide short-term relief. Thus, the “quick fix” that risk behavior offers becomes appealing regardless of possible longer term costs to health and well-being.
In addition to negative life events associated with opportunity limitations, African Americans in rural, Southern communities are often targets of discriminatory behavior (Brody, Chen, et al., Reference Brody, Chen, Murry, Ge, Simons and Gibbons2006; Brody, Kogan, Chen, & Murry, Reference Brody, Kogan, Chen and Murry2008; Gibbons, Gerrard, Cleveland, Wills, & Brody, Reference Gibbons, Gerrard, Cleveland, Wills and Brody2004; Simons, Chen, Stewart, & Brody, Reference Simons, Chen, Stewart and Brody2003). Racial discrimination is a particularly pernicious stressor because it regularly induces anger, frustration, and depressive symptoms that can compromise physical and mental health outcomes across time (Pearlin et al., Reference Pearlin, Schieman, Fazio and Meersman2005). Numerous studies support this proposition and indicate that racial discrimination forecasts increases in substance use as well (Pascoe & Smart Richman, Reference Pascoe and Smart Richman2009). Thus, we hypothesize that life stress, conceptualized as a combination of negative life events and perceived racial discrimination, will forecast increases in African Americans’ risk behaviors across the transition out of secondary school in rural, Southern communities.
We predicted that the life stresses African Americans experience in rural, Southern communities would initiate a cascade that begins with increases in negative emotions. The theoretical underpinnings for this hypothesis were derived from Berkowitz's (Reference Berkowitz1989) reformulation of the frustration–aggression hypothesis and from general strain theory (Agnew, Reference Agnew1992). Berkowitz demonstrated that many stressful, punishing, or painful events and conditions are lawfully related to increased negative affect that varies from despondency to anger in both humans and other species. Likewise, Agnew speculated that chronic aversive events and social relations generate a negative affect that carries forward to influence the selection of social networks and the subsequent behaviors that they sponsor. The literature documents clearly that life stress is associated with elevated levels of negative emotion (Aseltine, Gore, & Gordon, Reference Aseltine, Gore and Gordon2000; Belle, Reference Belle1982; Brody, Chen, et al., Reference Brody, Chen, Murry, Ge, Simons and Gibbons2006; Simons, Murry, et al., Reference Simons, Murry, McLoyd, Lin, Cutrona and Conger2002; Turner, Russell, Glover, & Hutto, Reference Turner, Russell, Glover and Hutto2007). No studies of which we are aware, however, have examined the possibility that life stress as African Americans experience it in rural, Southern contexts induces negative emotions that cascade forward to increase emerging adults’ likelihood of making choices that are linked to increases in risk behavior.
We hypothesized that negative emotions would carry forward to forecast an increase in affiliations with deviant companions, and that these affiliations would serve as the proximal predictor of risk behavior. Because emerging adults are not randomly assigned to friends and romantic partners, the observed similarities in self-regulation, future orientation, and negative emotionality that adolescents and emerging adults share with their friends and romantic partners is due partly to young people's tendency to seek like-minded companions (Caspi & Herbener, Reference Caspi and Herbener1990, Reference Caspi and Herbener1993; Connell & Dishion, Reference Connell and Dishion2006; Furman & Escudero, Reference Furman and Escudero2006; Rutter et al., Reference Rutter, Maughan, Meyer, Pickles, Silberg, Simonoff and Osgood1996; Sieving, Perry, & Williams, Reference Sieving, Perry and Williams2000; Simons, Stewart, Gordon, Conger, & Elder, Reference Simons, Stewart, Gordon, Conger and Elder2002; Vanyukov, Neale, Moss, & Tarter, Reference Vanyukov, Neale, Moss and Tarter1996). Hopelessness and disinterest in long-term goals often accompany anger and depression (American Psychiatric Association, 1994). This perspective can be expected to influence emerging adults’ selection of companions who share and support their norms, attitudes, and behavior. This differential affiliation or assortative mating process has a straightforward explanation. It is rewarding to be around a friend or romantic partner who engages in actions one regularly enjoys but unpleasant to spend time with those whose behavior strikes one as unfamiliar or critical. Consistent with this idea, several studies demonstrate that persons experiencing negative emotions select as friends, and are likely to meet, date, and begin romantic relationships with, individuals who also experience high levels of negative emotions and who also are less conventional, with antisocial leanings (Cairns & Cairns, Reference Cairns and Cairns1994; Daley & Hammen, Reference Daley and Hammen2002; Meeus, Branje, & Overbeek, Reference Meeus, Branje and Overbeek2004; Quinton, Pickles, Maughan, & Rutter, Reference Quinton, Pickles, Maughan and Rutter1993; Werner & Smith, Reference Werner and Smith2001). Thus, we predict that emerging adults reporting relatively higher levels of anger and depression will increase their affiliations with companions who are involved in deviant behaviors. Such companions are likely to model, sanction, and encourage involvement with risk behaviors.
A second purpose of this study was to illustrate two complementary methods for approaching and analyzing cascade hypotheses using structural equation modeling (SEM) and a combination of SEM and latent growth modeling (LGM; Duncan, Duncan, & Strycker, Reference Duncan, Duncan and Strycker2006). Both of these approaches can be used to analyze repeated measures data and change over time, with somewhat different emphases. SEM uses an autoregressive approach in which participants’ rank orders on predictor constructs are compared with their rank orders on outcome constructs. Such autoregressive procedures examine change by using residual scores. The SEM–LGM approach illustrated in this report uses SEM to test the hypothesized temporal ordering of the cascade constructs and LGM is used to link cascade constructs to intraindividual trajectories of change in risk behavior. LGM fits a regression line to the three risk behavior data points for each participant; these regression lines describe change in each participant's behavior over the course of the study. Thus, change in risk behaviors over time is determined using actual data rather than residual scores to test the hypothesized cascade model.
Summary of the Present Research
This study was conducted with rural African American youths as they transitioned out of secondary school, using procedures that have been shown to yield reliable data from longitudinal, epidemiological research focusing on risk behaviors; these procedures include computer-based interviewing, matching of interviewers and participants by ethnicity, and extensive reassurances concerning confidentiality of the data (Brody, Chen, et al., Reference Brody, Chen, Murry, Ge, Simons and Gibbons2006; Patrick et al., Reference Patrick, Cheadle, Thompson, Diehr, Koepsell and Kinne1994). We predicted that (a) life stress that African Americans experience in rural, Southern communities would be linked to increases in risk behaviors across the transition out of secondary school; and (b) a conceptual model involving cascades across life stress, negative emotions, and affiliations with deviant companions would explain the connection of life stress to increases in risk behaviors across the challenging life course transition to emerging adulthood.
Method
Participants were African American emerging adults who resided in a rural area of Georgia in which poverty rates are among the highest in the nation (Proctor & Dalaker, Reference Proctor and Dalaker2003). Data were collected within the context of a family-based prevention study, with data collection intervals timed to evaluate the prevention program. Three waves of data spanning 1.5 years were obtained. In the analyses reported in this paper, assignment to the prevention program or to a control group was controlled. Program participation did not moderate any of the pathways analyzed in this report.
Participants
Study participants were 347 African American youths who were in the last 2 years of secondary school at the beginning of the study (M age = 17.7). Although the students’ primary caregivers worked an average of 38.5 hr per week (SD = 11.1), 41.8% of their families lived below federal poverty standards, and another 15% lived within 150% of the poverty threshold. Youths’ families were representative of the areas in which they lived (Boatright & Bachtel, Reference Boatright and Bachtel2005); they are best described as working poor. Of the youths in the sample, 58.5% were female; a majority (63.6%) lived in single-parent households. A majority of the students’ caregivers (78.7%) had completed high school or earned a GED; the median family income of $1,948.25 per month was representative of the sampled population (Boatright & Bachtel, Reference Boatright and Bachtel2005).
Recruitment
In six rural counties, secondary schools provided lists of 11th- and 12th-grade students, and participants were selected randomly from these lists. Families were contacted and recruited by community liaisons who resided in the counties in which the participants lived. At the conclusion of the recruitment process, a total of 700 families with an 11th- or 12th-grade student had been identified; of these families, 347 (52%) agreed to participate and completed the measures. Families who declined participation cited time constraints, scheduling conflicts, and uneasiness about research participation as their reasons. This recruitment rate is similar to those of other prevention trials that address problematic and high-risk behaviors (Brody et al., Reference Brody, Murry, Gerrard, Gibbons, Molgaard and McNair2004). Of the sample, 87% competed the third wave of data collection, which took place 1.5 years after the first wave.
Procedures
To enhance rapport and cultural understanding, African American university students and community members served as field researchers to collect data. At the each data collection point, one home visit lasting 2 hr was made to each family. Wave 2 data collection took place approximately 5 months after the Wave 1 data collection, and Wave 3 data collection took place approximately 1 year after the Wave 2 collection. At the home visits, self-report questionnaires were administered to target youths in an interview format that eliminated literacy concerns. Each interview was conducted privately, with no other family members present or able to overhear the conversation. Informed consent forms were completed at all data collection points. Each family was paid $100 at each of the three assessments.
Measures
The measures were selected for their evaluation relevance and were derived from previous research that included interviews with focus groups, pilot tests, and construct validation of measures. Scales were constructed so that high scores indicated relatively high levels of the variable assessed.
Demographics
Monthly income, maternal age, and number of children in the household were recorded. Maternal education was measured on a scale ranging from 1 (Grades 1 to 4) to 10 (doctorate or professional degree). Each family's poverty status was computed based on per capita income and federal guidelines.
Life stress
The life stress construct, assessed at Waves 1 and 2, was composed of negative life events and perceived racial discrimination. The youths used a 12-item checklist of negative stressful events (Ge, Conger, Lorenz, & Simons, Reference Ge, Conger, Lorenz and Simons1994) to indicate whether a given event had occurred during the previous 6 months. The items on the checklist focused on events that the youths experienced directly, for example, having a serious accident, ending a relationship with a romantic partner, or getting in trouble with the police. Because this instrument is an index rather than a psychometric scale, internal consistently could not be computed. Instances of perceived racial discrimination were assessed with the Racist Hassles Questionnaire, an eight-item measure that our research group developed in cooperation with focus groups of African Americans. The measure has demonstrated concurrent and predictive validity in several studies involving rural African American preadolescents and adolescents (Brody, Chen, et al., Reference Brody, Chen, Murry, Ge, Simons and Gibbons2006; Gibbons et al., Reference Gibbons, Gerrard, Cleveland, Wills and Brody2004; Simons et al., Reference Simons, Chen, Stewart and Brody2003). The items were based on experiences that rural African Americans had identified as forms of discrimination common in their communities. Examples include being treated rudely or disrespectfully and being the target of racial insults. Respondents indicated the frequency of discriminatory experiences during the past 6 months on a scale ranging from 1 = never to 4 = several times. The coefficient alpha value for the scale exceeded 0.85. The negative stressful events measure and the instances of perceived discrimination measure were standardized and summed to form the life stress construct.
Deviant companions
This construct was composed of youths’ self-reports on two scales at Waves 1 and 2. Youths reported the proportions of their close friends (none of them, some of them, all of them) who engaged in any of 15 deviant or risk-taking behaviors drawn from Elliot's work with delinquent youths (Elliott, Ageton, & Huizinga, Reference Elliott, Ageton and Huizinga1985). Behaviors included selling drugs, getting in trouble with the police, skipping school, and damaging property. The Cronbach alpha value exceeded 0.85 at all waves of data collection. On a scale ranging from 1 = never to 3 = often, youths also reported how often their current or last romantic partners engaged in a similar set of deviant or risk-taking behaviors. Youths were first asked if, during the past 3 months, they had a romantic partner, defined as someone the youth “was dating, a boyfriend or girlfriend, or a ‘friend with benefits.’” The majority responded affirmatively. Because the items on the two scales tended to overlap, and because friends and romantic partners typically belonged to the same peer groups, we summed the scales to form the deviant companions construct rather than treating them as distinct indicators. The Cronbach alpha value exceeded 0.75 at each data collection wave.
Negative emotions
Two scales, administered at Waves 1 and 2, were used to assess this construct. The Center for Epidemiologic Studies Depression Scale (Radloff, Reference Radloff1977) is a self-rated measure of depressive symptoms occurring during the past week. It consists of 20 items with a response set ranging from 0 = rarely, less than 1 day to 3 = most of the time, 5–7 days. This scale has been well validated and used extensively with African American samples (Beach et al., Reference Beach, Kogan, Brody, Chen, Lei and Murry2008; Pumariega, Johnson, Sheridan, & Cuffe, Reference Pumariega, Johnson, Sheridan and Cuffe1996). The Cronbach alpha value for the scores on the total scale exceeded 0.75 across all waves of data collection. Youths also completed the state anger subscale of Spielberger's State–Trait Anger Expression Inventory (Spielberger, Reference Spielberger1999). Respondents indicated, on a scale ranging from 1 = never to 5 = always, the frequency with which they experienced 15 emotional states, such as furious, angry, and like breaking things, during the past 3 months. The Cronbach alpha value for the scores on the total scale exceeded 0.90 at each wave of data collection.
Risk behaviors
Risk behaviors were evaluated at each wave using an instrument that we have used previously with rural African American adolescents (Brody, Beach, et al., Reference Brody, Beach, Philibert, Chen, Lei and Murry2009; Brody, Chen, Beach, Philibert, & Kogan, Reference Brody, Chen, Beach, Philibert and Kogan2009; Brody, Murry, et al., Reference Brody, Murry, Gerrard, Gibbons, McNair and Brown2006). Youths indicated the number of times during the past month they had used marijuana, drunk three or more alcoholic beverages (beer, wine, wine coolers, whiskey, gin, or other liquor) at one time, or had sexual intercourse while using substances. Responses to these items were summed to form a past-month risk behavior index.
Results
Attrition analyses
To test for differences among families who provided data at different waves, we compared families and targets who provided data at Wave 1 but not at Wave 3 (n = 45) with those who provided data at all waves (n = 302). The t tests conducted on each study measure, as well as on monthly income, maternal education, maternal age, and number of children in the household, detected no intergroup differences.
Plan of analysis for the study hypotheses
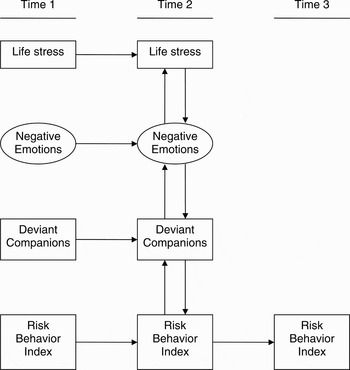
Two ways of analyzing the study hypotheses were implemented: an SEM approach and an SEM–LGM approach. The SEM approach used a reciprocal influence model, depicted in Figure 1, to test the study hypotheses that increases in cascade processes from Wave 1 to Wave 2 would occur in a specific order and would carry forward to predict increases in risk behavior from Wave 2 to Wave 3. Specifically, we conjectured that increases in life stress would lead to increases in negative emotions that, in turn, would lead to increases in affiliations with deviant companions. The increase in such affiliations was hypothesized to serve as the proximal cascade construct responsible for increases in risk behavior from Wave 1 to Wave 2. Consistent with findings that risk behaviors among rural African American youths evince cumulative continuity across time (Brody, Beach, et al., Reference Brody, Beach, Philibert, Chen, Lei and Murry2009; Brody, Chen, et al., Reference Brody, Chen, Beach, Philibert and Kogan2009), increases in risk behavior from Wave 1 to Wave 2 were hypothesized to carry forward to predict increases in risk behavior from Wave 2 to Wave 3.
The theoretical structural equation modeling reciprocal influence cascade model.

The SEM–LGM analysis proceeded in several steps. In the first step, the study premise was tested that life stress across the transition out of secondary school in rural, Southern communities sets in motion a series of specific cascades that leads to an increase in negative emotions; in turn, negative emotions lead to affiliations with deviant companions. To verify these hypotheses, we conducted two cross-lag analyses using the first two waves of data. In the second step, LGM (Singer & Willett, Reference Singer and Willett2003) was used to test the study hypothesis that life stress would forecast increases in risk behavior across emerging adults’ transition to life after secondary school. If the initial cross-lagged analyses support the temporal ordering of the cascade constructs, and if the subsequent LGM analysis confirms the prospective link between life stress and trajectories of risk behavior, SEM is used to test the cascade hypothesis that life stress occasions increases in negative emotions that carry forward to increase affiliations with deviant companions. Increased affiliation with deviant companions serves as the proximal risk factor that forecasts increases in the slope of risk behaviors.
SEM reciprocal influence analysis of the cascade model
All analyses included 347 participants. The analyses were performed using SEM in Mplus 5.2 with full information maximum likelihood estimation. This estimation does not delete cases that are missing from only one or two waves of data collection, nor does it delete cases that are missing a variable within a wave of data collection. Thus, this method avoids potential problems, such as biased parameter estimates, that are more likely to occur if pairwise or listwise deletion procedures are used to compensate for missing data.
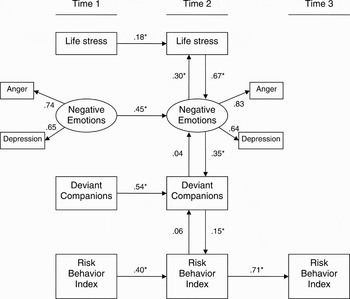
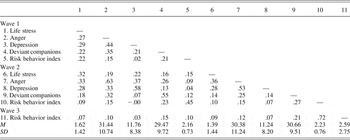
The structural model was specified with changes in life stress from Wave 1 to Wave 2 as the exogenous construct, not predicted by any prior variable in the model. Changes in negative emotion and affiliations with deviant companions at Wave 2 were specified as endogenous constructs, predicted by prior variables in the model, and change in risk behavior from Wave 2 to Wave 3 was specified as the criterion construct. Table 1 presents the correlation matrix, means, and standard deviations for the SEM variables. All indices showed that the structural model, which is presented in Figure 2 with standardized coefficients, fit the data well: χ2 = 64.52, df = 31, p < .001; comparative fit index (CFI) = 0.97; root mean square error of approximation (RMSEA) = 0.06 (0.04, 0.07). As hypothesized, the exogenous construct, increase in life stress, forecast an increase in negative emotions (β = 0.675); an increase in negative emotions, however, was also associated with an increase in life stress (β = 0.302). To test the direction of causality in this reciprocal relationship, each path was constrained to be equal; the constrained model was then compared with one in which the two paths were free to vary. A significant reduction in chi-square from the constrained to the nonconstrained model indicates that one path is stronger than the other. Consistent with the study hypothesis, the path from changes in life stress to increases in negative emotions was stronger than the reverse, Δχ2 (1) = 6.63, p < .01. As hypothesized and depicted in Figure 2, changes in negative emotions were linked to changes in affiliations with deviant companions but not the reverse, and affiliations with deviant companions were linked with increases in risk behaviors but not the reverse. Risk behaviors at Wave 2 carried forward to predict increases in risk behavior from Wave 2 to Wave 3.
The reciprocal influence structural model; χ2 = 64.52, df = 31, p = .000; comparative fit index = 0.97; root mean square error of approximation = 0.06 (0.04, 0.07).

Intercorrelations, means, and standard deviations for all study variables

Note: All correlations that are >.12 are significant at p < .05.
Two alternative models were tested. In one model, paths were added from the changes in the exogenous and endogenous constructs to Wave 3 changes in risk behaviors. None of these paths were significant, and the model showed no significant improvement over the original structural model. In the second alternative model, paths were added from (a) changes in life stress to changes in affiliations with deviant companions and (b) changes in negative emotions to changes in risk behaviors from Wave 1 to Wave 2. None of the paths were significant and the model showed no improvement over the original structural model. Taken together, the reciprocal influence SEM model supports the proposed cascade of processes that accounts for increases in involvement with risk behaviors across emerging adults’ transition to life after secondary school.
SEM–LGM analysis linking life stress to risk behaviors
Direction of causality analyses
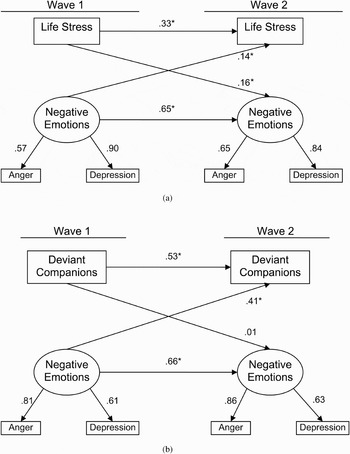
Analyzing the cascade model using the SEM–LGM model requires a set of preliminary analyses that verify the direction of causality in the cascade processes. To do this, we conducted two cross-lag analyses using the first two waves of data. SEM was conducted in which the cross-lags (e.g., Wave 1 life stress to Wave 2 negative emotions and the reverse; Wave 1 negative emotions to Wave 2 deviant companions and the reverse) were first constrained to be equal; the constrained models were then compared with ones in which the two paths were free to vary. The nonconstrained models, pictured with standardized coefficients in Figure 3, fit the data well: life stress to negative emotions and the reverse, χ2 (6) = 19.93, p < .00, CFI = 0.98, RMSEA = 0.08 (0.04, 0.12); negative emotions to affiliations with deviant companions and the reverse, χ2 (15) = 22.44, p < .02, CFI = 0.98, RMSEA = 0.05 (0.02, 0.08). A significant reduction in chi-square from the constrained to the nonconstrained model indicates that one cross-lag is stronger than the other. In the cross-lag for the hypothesized path of life stress leading to increases in negative emotions, both cross-lags were significant, but the path from life stress to increases in negative emotions was stronger than the path from negative emotions to increases in life stress, Δχ2 (1) = 6.08, p < .01. Similarly, the hypothesized path from negative emotions leading to increases in affiliations with deviant companions rather than the reverse was also supported; only the path from negative emotions to deviant companions was significant, Δχ2 (1) = 6.00, p < .01.
Cross-lagged analyses: (a) χ2 = 19.93, df = 6, p = .00; comparative fit index = 0.98; root mean square error of approximation = 0.08 (0.04, 0.12); (b) χ2 = 22.44, df = 15, p = .02; comparative fit index = 0.98; root mean square error of approximation = 0.05 (0.02, 0.08).

We began by testing the unconditional model for the risk behavior growth construct by regressing target age on risk behavior. Age in years was allowed to vary across targets at the first (M = 17.73), second (M = 18.31), and third (M = 19.16) assessments. The mean slope was 0.43 (p < .05) and the variance around the slope was .05 (p < .05). Having fit the univariate growth curve to the risk behavior construct, the next step involved testing the conditional model. As expected, life stress at Wave 1 was significantly linked (β = 0.15) with the slope of risk behavior (t = 3.09, p < .002). Consistent with Hypothesis 1, life stress that rural, African American adolescents experienced was linked with increased risk behavior involvement across the transition from secondary school to posttransition life.
Analyses of the cascade model
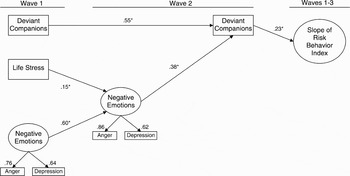
To test the hypothesized cascade pathways, an SEM model was specified with the slope of risk behavior as the criterion latent construct. Tests of cascade processes require analyses of change; therefore, the SEM model includes assessments of change from Wave 1 to Wave 2 for the constructs of negative emotions and affiliation with deviant companions. Accordingly, Wave 1 paths of these constructs to Wave 2 assessments were included in the SEM model. Adding these paths controlled for Wave 1 levels, resulting in paths within the structural model that assess change. Figure 4 depicts the measurement and structural models for this analysis. All factor loadings for the latent constructs for negative emotions were significant, whereas the life stress and deviant companions constructs were set to unity. The structural model was specified with life stress as the exogenous construct (i.e., not predicted by any prior variable in the model). Negative emotions and deviant companions were specified as endogenous constructs (i.e., can be predicted by prior variables in the model), and the slope of risk behavior was specified as the criterion construct.
The structural equation modeling and latent growth modeling structural model; χ2 = 47.23, df = 29 p = .02; comparative fit index = 0.98; root mean square error of approximation = 0.04 (0.02, 0.06).

All indices showed that the model, presented in Figure 4 with standardized coefficients, fit the data well, χ2 (14) = 11.48, p = 0.07, CFI = 1.00, RMSEA = 0.00 (0.00, 0.04). As hypothesized, the exogenous variable, life stress, forecast a residualized increase in negative emotions from the first assessment to the second assessment (β = 0.15, p < .05). Negative emotions were linked positively with a residualized increase in affiliations with deviant companions (β = 0.38, p < .025), which in turn, forecast the slope of risk behavior (β = 0.23, p < .05). An alternative model was tested with two direct paths added to the model depicted in Figure 4, from life stress at the first assessment to the slope of risk behavior, and from negative emotions at the second assessment to the slope of risk behavior. Neither of the additional paths approached significance, and the model showed no significant improvement in fit over the original structural model. We also examined the possibility that gender could moderate some of the paths in the model. To do this, we conducted multiple group analyses (Singer & Willett, Reference Singer and Willett2003). No gender moderation effects were detected. Thus, to summarize, the SEM–LGC analysis confirmed Hypothesis 1, that life stress would forecast increases in risk behavior over time. As predicted in Hypothesis 2, a cascade of processes that include increases in negative emotions and affiliations with deviant companions emerged, helping to explain how life stress is linked to risk behavior for rural African American emerging adults.
Discussion
We used a longitudinal research design to test hypotheses, from a stress proliferation framework, about the cascade of processes through which life stress characteristic of rural, Southern communities is linked to increases in African American emerging adults’ risk behaviors. The framework led us to specify that life stress would contribute over time to an increase in the proliferated stressor of negative emotions, which would carry forward to sponsor increases in the risk mechanism of affiliation with deviant companions. The results indicated that (a) life stress led to increases in negative emotions and not the reverse, (b) negative emotions led to affiliation with deviant companions and not the reverse, and (c) life stress was linked to increases in risk behaviors in a chainlike, cascading sequence via its link with negative emotions. These effects emerged independent of emerging adult gender.
Few, if any, contemporaneous or longitudinal studies have addressed the ways in which life stresses that noncollege-bound emerging adults experience are translated into emotional and relational processes that forecast activities with prognostic significance for compromised life course trajectories. The emergence in this study of a chain-like, cascading sequence is important because it underscores the need for longitudinal data and for analytic methods that can be used to test the postulated ordering of the risk indicators and risk mechanisms through which the contributions of life stress are transmitted. Information about the cascade of risk indicators and risk mechanisms is also important from a prevention science perspective. Knowing that life stress induces negative emotions that lead to increases in affiliations with deviant companions will enable prevention scientists to formulate developmentally appropriate interventions that more accurately target protective mechanisms that can interrupt this sequence, such as relationships with family members and natural mentors that reduce stress (Brody, Kogan, Chen, et al., Reference Brody, Kogan, Chen, Smith and Brown2009).
The results supported the importance of differential affiliation or assortative mating processes in the cascade process that leads to increases in risk behaviors. This study and others cited previously support the process of phenotypic preference, whereby individuals choose companions with attributes they consider desirable, often behaviors and traits similar to their own. Consistent with the idea that “birds of a feather flock together” (Glueck & Glueck, Reference Glueck and Glueck1950), this mechanism implies that individuals select partners with risk-related traits similar to their own, such as negative affect. The choice of companions similar to oneself may constitute an attempt to create an environment that supports one's own behavior (Kendler, Walters, Neale, & Kessler, Reference Kendler, Walters, Neale and Kessler1995), in which people with values and behaviors similar to one's own condone and perhaps encourage engagement in risk behaviors (Engfer, Walper, & Rutter, Reference Engfer, Walper, Rutter, Rutter and Hay1994). After such differential affiliations become established, behavior contagion processes activate (Dishion, Eddy, Haas, Li, & Spracklen, Reference Dishion, Eddy, Haas, Li and Spracklen1997; Dishion, McCord, & Poulin, Reference Dishion, McCord and Poulin1999). These processes include companions’ explicit reinforcement of involvement with risk behavior and disapproval of more conventional conduct (Dishion, Spracklen, Andrews, & Patterson, Reference Dishion, Spracklen, Andrews and Patterson1996). Risk behaviors also can be encouraged and maintained without overt behavior contagion processes. For example, the literature on substance use indicates that youths’ perceptions of drug-using companions as attractive also increases the attractiveness of the behaviors in which the companions engage, forecasting youths’ own initiation of those behaviors (Gibbons & Gerrard, Reference Gibbons and Gerrard1995). Similarly, the perception that companions engage in high levels of risk behaviors is itself a risk factor for subsequent involvement (Graham, Taylor, & Hudley, Reference Graham, Taylor and Hudley1998); such perceptions may alter emerging adults’ beliefs concerning norms and consensus about risk behaviors (Brody, Flor, Hollett-Wright, & McCoy, Reference Brody, Flor, Hollett-Wright and McCoy1998). We conjecture that the cascade process that increases affiliations with deviant companions and involvement in risk behaviors may be mediated by both explicit companion processes and social perceptions about the acceptability of risk behaviors. Further research that includes these processes in the protocols is needed to clarify the ways in which these risk mediation processes operate.
An ancillary purpose of this study was to illustrate two complementary analytic approaches to the testing of cascade models. The first featured SEM, with an autoregressive approach to change for both the cascade variables and the criterion variable, risk behavior. The second was an approach that analyzed change among the cascade variables using the autoregressive SEM while using LGM and the participants’ actual data to examine the link between the cascade constructs and risk behavior. The two analytic approaches yielded identical results, and each had advantages and disadvantages. The advantage of SEM is its capacity to test the hypothesized temporal ordering of the cascade constructs, their link with the criterion construct, and the fit of the data to the hypothesized model in one step; its disadvantage is that change for all parameters is based on group-level rather than individual-level data. Conversely, the advantage of the SEM–LGM approach is its use of participants’ actual data for the criterion construct at each time point rather than group data. The disadvantage is its multistep process. First, cross-lag panel analyses are executed to validate the hypothesized temporal ordering of the cascade constructs; second, a model is tested that examines the fit of the data to the ordering of the cascade constructs and their link to trajectories of change in the criterion construct. For researchers interested in cascade and stress proliferation processes, there may be some merit in incorporating growth modeling approaches into their data analytic repertoire, as it allows an examination of stress proliferation processes and their links with personal developmental trajectories.
Although in the conceptual model we did not predict gender differences, we sought to determine whether gender conditioned any of the pathways in the model; in this study, no differences emerged, even though past research suggests that males are particularly prone to display externalizing behaviors when confronted with chronic life stressors, including racial discrimination (Brody, Chen, et al., Reference Brody, Chen, Murry, Ge, Simons and Gibbons2006). Thus, further research with larger samples is needed, designed to determine whether the theoretical model tested in this study fits equally well for male and female African American emerging adults. This result could be due to the size of the sample, which does not have enough power to detect gender differences.
Assessments of the study constructs were obtained from the emerging adults. The decision to depend on emerging adults’ reports for these constructs was based on the research literature and on our own longitudinal research program with rural African American families. Analyses of primary caregivers’ assessments of target youths’ risk behaviors in our previous studies revealed that caregivers reported a decrease or plateau in them as the youths made the transition to adolescence. The youths’ self-reports, however, did not correspond to this pattern; instead, they evinced increases in risk behaviors. We interpreted this discrepancy as underreporting of risk behaviors on the caregivers’ part as their children grew older (Hartung, McCarthy, Milich, & Martin, Reference Hartung, McCarthy, Milich and Martin2005; Lahey et al., Reference Lahey, Schwab-Stone, Goodman, Waldman, Canino and Rathouz2000). A second and related concern that common method variance could account for the findings obtained was addressed through the execution of the cross-lag analyses. This procedure demonstrated that life stress led to stronger changes in negative emotions than vice versa, and negative emotions led to stronger changes in affiliations with deviant companions than vice versa. This result would not have emerged if common method variance among the study constructs was responsible for our findings.
Most research on the effects of life stress and risk behavior has focused on populations in densely populated inner cities. African Americans, however, grow up in diverse communities. The present study was conducted with African American families who resided in nonmetropolitan areas that were far less densely populated than urban settings. Life stress, including racial discrimination, is as likely to operate in small or moderately sized communities as in large urban areas. Regardless of population size or rural–urban location, when emerging adults experience chronic life stress, challenges to their health and well-being increase.
Conclusion
The limitations of this study and some caveats must be noted. First, the exclusion of youths who dropped out of school from the sampling list potentially limits the study's generalizability. Mean dropout rates for African American students across the sampled counties, however, are uniformly low; fewer than 5% of students in the sampled area dropped out of school in any particular year (The Governor's Office of Student Achievement, 2009). Thus, the results are generalizable to the vast majority of rural African Americans in these areas. Second, it is not known whether the present results generalize to White, Hispanic, or Asian families living in the same communities as the study participants or to urban families of any race. Third, although the sample is representative of African American emerging adults living in rural Georgia (Boatright & Bachtel, Reference Boatright and Bachtel2005), it is nevertheless possible that the families who took part in this study, because of self-selection processes, may have been functioning differently than the population at large. Fourth, the proposed cascade model is not intended to be exhaustive. Models that incorporate different parameters than those included here could also account for variation in risk behavior increases. For example, the inclusion of perceptions about the social acceptability of risk behaviors might yield a more robust model. These cautions notwithstanding, the present results add to the literature by documenting the cascade of processes that connect life stress to increases in risk behavior among African Americans emerging adults living in the rural South.