Introduction
Acquiring multiple types of brain data from the same individual has become increasingly common in research on neural bases of mental illnesses such as bipolar disorder (BD). For example, collecting functional and structural magnetic resonance imaging (MRI) and diffusion tensor imaging (DTI) from the same individual allows examination of alterations in both brain structure and function along with the associations among brain and clinical variables within patient groups. Combinatorial approaches may yield relationships not observed with unimodal analyses and can possibly unify disparate findings in the literature (Calhoun et al., Reference Calhoun, Adali, Giuliani, Pekar, Kiehl and Pearlson2006; Plis et al., Reference Plis, Weisend, Damaraju, Eichele, Mayer, Clark and Calhoun2011). Recently, “multimodal fusion models” have been developed that use joint information from two or more neuroimaging modalities to identify dysfunctional networks implicated in many types of brain disorders, including BD.
For example, research examining patients with BD and schizophrenia using multivariate canonical correlation and joint independent components analyses to combine data from functional MRI (fMRI) using an oddball paradigm and DTI found both BD and schizophrenic patients had similar and distinct dysfunctional functional-structural networks compared to healthy comparisons (HC; Sui et al., Reference Sui, Pearlson, Caprihan, Adali, Kiehl, Liu and Calhoun2011). However, studies using these types of techniques have not incorporated cognitive performance in their multimodal models. It is becoming more clear that BD is characterized by trait-like dysfunction in multiple cognitive domains (Bearden, Hoffman, & Cannon, 2001; Kurtz & Gerraty, Reference Kurtz and Gerraty2009), which persist during periods of euthymia (Mann-Wrobel, Carreno, & Dickinson, Reference Mann-Wrobel, Carreno and Dickinson2011; Townsend, Bookheimer, Foland-Ross, Sugar, & Altshuler, Reference Townsend, Bookheimer, Foland-Ross, Sugar and Altshuler2010). Furthermore, cognitive dysfunction, especially working memory, attention, and processing speed, is associated with worse social/occupational functioning among patients (Bearden et al., Reference Bearden, Shih, Green, Gitlin, Sokolski, Levander and Altshuler2011; Bearden, Woogen, & Glahn, Reference Bearden, Woogen and Glahn2010). There are wide ranges in severity of cognitive dysfunction among BD patients and there may be individual differences in the trajectory of cognitive changes with age (Delaloye et al., Reference Delaloye, Moy, Baudois, de Bilbao, Remund, Hofer and Giannakopoulos2009). Severity of brain dysfunction is an important potential source of this cognitive heterogeneity. The relationship between brain structure, function, and individual differences in cognition is likely complex, however, even in those without brain disorders (Eyler, Sherzai, Kaup, & Jeste, Reference Eyler, Sherzai, Kaup and Jeste2011). Furthermore, it is not clear if the nature of the brain-behavior relationship is the same for those with or without BD. As such, a better understanding of the structural-functional neural systems directly involved in the cognitive operations impacted in BD and how these compare to those individuals without BD would prove beneficial in understanding brain-behavior relationships unique to BD.
Here, we use least angle regression with least absolute shrinkage and selector operator (LASSO) estimation to fuse fMRI and DTI data with the goal of selecting the best joint neuroimaging predictors of working memory and processing speed abilities among inter-episode BD patients. These methods form a fusion hybrid model which incorporates both hypotheses and data exploration by maximizing covariance between dependent and predictor variables, based on the definition of a linear relationship, to select models which achieve the best trade-off between goodness of fit and complexity in explaining cognition (Effron, Hastie, Johnstone, & Tibshirani, Reference Efron, Hastie, Johnstone and Tibshirani2004). LASSO estimation provides a powerful way to select variables, as the procedure allows estimates to be discarded and can be applied in situations where there are more predictors than participants (Meinshausen & Yu, Reference Meinshausen and Yu2009; Zhang & Huang, Reference Zhang and Huang2008), making the procedure of particular use in neuroimaging where one is working with high dimensional data. These methods aim to select from a large list of possible candidate models, the model that achieves the best trade-off between goodness of fit and complexity in explaining cognition. For example, Bunea and colleagues used LASSO estimation with partial least squares regression to select fMRI and DTI measures associated with cognitive functioning in patients with human immunodeficiency virus. They found several brain regions where joint abnormalities in function and structure explained cognitive changes in patients (Bunea et al., Reference Bunea, She, Ombao, Gongvatana, Devlin and Cohen2011).
The present study focused on neuroimaging predictors to explain heterogeneity of working memory and processing speed abilities among inter-episode BD patients. Working memory and processing speed are highly interconnected functions with evidence that processing speed mediates relationships between working memory dysfunction and clinical symptoms among schizophrenic patients (Brebion et al., Reference Brebion, Stephan-Otto, Huerta-Ramos, Usall, Perez del Olmo, Contel and Ochoa2014), and both are core cognitive domains that substantially contribute to the psychosocial disability among BD patients. The underlying neural correlates of these cognitive functions form complex inter-connected networks of many cortical regions within frontal and parietal lobes (for review see Owens, McMillan, Laird, & Bullmore, Reference Owens, McMillan, Laird and Bullmore2005). To limit analyses to a reasonable set of predictors we focused on a subset of regions known to be required for the cognitive tasks used here. Specifically, for functional measures of brain responsiveness, we examined regions that we have previously shown were necessary for working memory function from a delayed match-to-sample paradigm (McKenna, Brown, Drummond, Turner, & Mano, Reference McKenna, Brown, Drummond, Turner and Mano2013), including the dorsolateral prefrontal cortex (DLPFC) and the supramarginal gyri (Desimone & Duncan, Reference Desimone and Duncan1995; Dux, Ivanoff, Asplund, & Marois, Reference Dux, Ivanoff, Asplund and Marois2006; McKenna et al., Reference McKenna, Brown, Drummond, Turner and Mano2013; McNab & Klingberg, Reference McNab and Klingberg2008; Rypma & D’Esposito, Reference Rypma and D’Esposito1999). Current neurobiological theories of BD posit that a disconnection between top-down control mechanisms in the DLPFC and bottom-up mechanisms within ventral prefrontal cortex and subcortical limbic regions underlie the cognitive dysfunction and emotional lability within BD (Phillips, Drevets, Rauch, & Lane, Reference Phillips, Drevets, Rauch and Lane2003; Phillips, Ladouceur, & Drevets, Reference Phillips, Ladouceur and Drevets2008). For white matter measures, we, therefore, focused on tracts emanating from DLPFC to posterior cortical and subcortical regions including superior longitudinal fasciculi and uncinate fasciculi as studies have found abnormalities in these tracts among BD patients (Emsell et al., Reference Emsell, Chaddock, Forde, Van Hecke, Barker, Leemans and McDonald2013; Ha et al., Reference Ha, Her, Kim, Chang, Cho and Ha2011; Heng, Song, & Sim, Reference Heng, Song and Sim2010). We also chose to examine white matter integrity in the corpus callosum due to its involvement and role in impaired intra-hemispheric integration in BD (Leow et al., Reference Leow, Ajilore, Zhan, Arienzo, GadElkarim, Zhang and Altshuler2013; Linke et al., Reference Linke, King, Poupon, Hennerici, Gass and Wessa2013). Furthermore, there is increasing evidence that the integrity of the superior longitudinal fasciculi, uncinate fasciculi, and corpus callosum relate to working memory and processing speed (Biesbroek et al., Reference Biesbroek, Kuijf, van der Graaf, Vincken, Postma and Mali2013; Linke et al., Reference Linke, King, Poupon, Hennerici, Gass and Wessa2013; Sasson, Doniger, Pasternak, Tarrasch, & Assaf, Reference Sasson, Doniger, Pasternak, Tarrasch and Assaf2013; Takeuchi et al., Reference Takeuchi, Taki, Sassa, Hashizume, Sekiguchi, Fukushima and Kawashima2011). As such, we hypothesize that statistical fusion techniques will yield combinations of structural and functional neuroimaging measures from this a priori set of brain regions that significantly predict working memory and processing speed among BD patients and that these will differ from the predictors seen in HC participants. Distinct structural-functional patterns among these regions would point to potential altered cortical networks that are directly related to cognitive abilities for future investigations and can aid in explaining the underlying pathophysiology of cognitive dysfunction within BD.
Methods
Participants
Following procedures approved by University of California, San Diego (UCSD) and San Diego Veterans Affairs Healthcare System, written informed consent was obtained from 26 BD and 36 age-, gender-, and education-comparable HC participants. All participants were part of a larger study examining brain aging and recruited from the general San Diego area. BD patients were deemed eligible if they were between the ages of 30 and 79, right-handed, free of diagnoses of substance abuse for 6 months and dependence for 12 months, free of any serious neurological or medical condition, suitable for MRI, native English speakers, and not currently under conservatorship. Patients met Diagnostic and Statistical Manual of Mental Disorders, 4 th edition (DSM-IV; American Psychiatric Association, 2000) criteria for the diagnosis of bipolar I disorder with first mood episode occurring between ages 13 and 30 as determined by an expanded version of the Structured Clinical Interview for DSM-IV (SCID-IV; Spitzer, Williams, Gibbon, & First, Reference Spitzer, Williams, Gibbon and First1995). Potential patients were excluded from the study if they were currently experiencing a mood episode as determined by the SCID-IV, or significant residual symptoms as determined by assessment of depressive (Hamilton Rating Scale for Depression; Trajković et al., Reference Trajković, Starčević, Latas, Leštarević, Ille, Bukumirić and Marinković2011), manic (Young Mania Rating Scale; Young, Biggs, Ziegler, & Meyer, Reference Young, Biggs, Ziegler and Meyer1978), or psychotic (Positive and Negative Syndrome Scale; Kay, Fiszbein, & Opler, Reference Kay, Fiszbein and Opler1987) symptoms, or had a history of any other Axis I DSM-IV diagnosis.
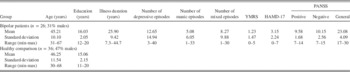
Healthy participants were eligible if they had no Axis I DSM-IV diagnosis as determined by the Mini International Neuropsychiatric Interview (Sheehan et al., Reference Sheehan, Lecrubier, Sheehan, Amorim, Janavs, Weiller and Dunbar1998), were not taking medication known to interfere with cognitive functioning, and had no first-degree relatives with a diagnosis of major depressive disorder, BD, or schizophrenia. Demographic information and clinical rating scores are presented in Table 1.
Clinical characteristics of samples

n=number of participants in each group; YMRS=Young Mania Rating Scale; HAMD-17=Hamilton Rating Scale for Depression; PANSS=Positive and Negative Syndrome Scale.
Medications
All BD patients were required to be stable for at least 6 weeks on psychotropic medication before entry to the study. Within our sample, 50% of BD patients were taking antidepressants, 54% antipsychotics, 73% mood-stabilizers, 31% lithium, and 42% anxiolytics or benzodiazepines. Additionally, 73% were on polytherapy involving two or more classes of these psychotropic medications. The average medication load, a measure of medication burden (Hassel et al., Reference Hassel, Almeida, Kerr, Nau, Ladouceur, Fissell and Phillips2008), among the BD sample was 3.88±1.99 standard deviation. HC participants were not taking any psychotropic medication.
Cognitive Assessment
Before MRI, all participants completed the Delis-Kaplan Executive Function System Trailmaking subtest (Delis, Kaplan, & Kramer, Reference Delis, Kaplan and Kramer2001). These standardized neuropsychological tasks isolate processing speed, among other domains. Only average completion times from the letter and number sequencing subtests were used as our measure of processing speed since other Trailmaking subtests measure different domains. Within the MRI, all participants completed two working memory tasks: an event-related delayed match-to-sample paradigm from which the fMRI data was derived and a block-design N-back paradigm. The delayed match-to-sample task, described in detail elsewhere (McKenna et al., Reference McKenna, Brown, Drummond, Turner and Mano2013), has been previously validated and published with the majority of BD patients who comprise the present sample (McKenna, Sutherland, Legenkaya, & Eyler, Reference McKenna, Sutherland, Legenkaya and Eyler2014). Importantly, this task allows for the separation of encoding and maintenance processes within working memory and thus was used to generate the BOLD data for the main analyses. The N-back paradigm is widely used to measure working memory and was used to generate additional behavioral data. Participants had to determine whether the current single letter stimulus matched a stimulus n-back. There were three types of n-backs presented in blocks: 0-back, 1-back, and 2-back.
Two composite scores were created from these behavioral tasks: one to estimate processing speed and another to estimate working memory. Specifically, completion times on the Trailmaking letter and number sequencing subtests were averaged to generate our measure of processing speed. Accuracy scores on both working memory tasks were averaged to generate our measure of working memory performance. Composite scores provide a more reliable estimate of underlying cognitive functions due to incorporating multiple data points (for a discussion, see Heaton et al., Reference Heaton, Akshoomoff, Tulsky, Mungas, Weintraub, Dikmen and Gershon2014) and were used here to better estimate latent processing speed and working memory abilities.
MRI Data Acquisition
Participants were scanned at the UCSD Keck Center for MRI using a General Electronics Signa EXCITE 3.0 Tesla whole-body imaging system. Anatomical scans used T1-weighted fast spoiled gradient echo pulse sequences (TE=4 ms; flip angle=8°; 1 mm3 resolution). DTI scans were acquired axially for the whole brain with TE/TR=70 ms/9700 ms, voxel size=2.5 mm3, b-value=1000 s/mm2. One diffusion weighted image was acquired for each of 51 diffusion gradient directions; two volumes with no diffusion encoding (b0) in alternate phase encoding directions were used to correct nonlinear distortion corrections due to field inhomogeneities (Andersson, Skare, & Ashburner, Reference Andersson, Skare and Ashburner2003). The functional scans collected with a gradient echo pulse sequence sensitive to the T2*-weighted blood oxygen level dependent (BOLD) signal. Axial slices covering the whole brain (TR=2000 ms, TE=30 ms, image matrix=64×64, 4 mm×4 mm resolution, slice thickness=4 mm) were acquired parallel to the intercommissural plane in an interleaved manner. Corrections for echo-planar field inhomogeneities also used scans with opposite phase encoding polarities aligned using a fast nonlinear registration procedure (Holland, Kuperman, & Dale, Reference Holland, Kuperman and Dale2010).
MRI Processing
We used local software, FSL (Smith et al., Reference Smith, Jenkinson, Woolrich, Beckmann, Behrens, Johansen-Berg and Matthews2004), and the Analysis of Functional NeuroImages (AFNI; Cox, Reference Cox1996). fMRI processing steps included: slice timing correction, motion co-registration, data alignment (Saad et al., Reference Saad, Glen, Chen, Beauchamp, Desai and Cox2009), and co-registration to standard Talairach atlas space (Talairach & Tournoux, Reference Talairach and Tournoux1988). A general linear model was applied to each participant’s time series yielding brain response estimates during encode, maintenance, and recognition intervals using an inter-trial interval as common baseline. Raw BOLD signal data was transformed into percent signal change from baseline and spatially smoothed to a Gaussian filter width of 6 mm FWHM.
Preprocessing of DTI images involved the correction of subject motion, image distortion in the diffusion weighted volumes due to eddy currents, magnetic susceptibility artifacts, and scaling differences. Images were resampled to a higher resolution using linear interpolation (1 mm3 voxels). Fractional anisotropy (FA), in addition to mean, axial, and radial diffusivities, were then calculated using standard formulas by fitting a tensor model to raw diffusion data (Basser & Jones, Reference Basser and Jones2002). As FA is calculated from the three eigenvalues which also compose axial and radial diffusivity we chose to focus our analyses only on FA to avoid multiple testing issues.
Regions of Interest
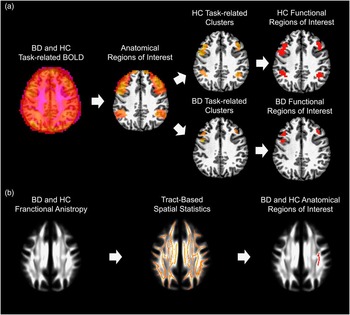
We chose bilateral DLPFC and supramarginal gyri regions of interest (ROIs) as they demonstrate maximal task effects in all participants from the delayed match-to-sample paradigm (McKenna et al., Reference McKenna, Brown, Drummond, Turner and Mano2013, Reference McKenna, Sutherland, Legenkaya and Eyler2014) and are connected by the superior longitudinal fasciculus; though many other regions implicated in working memory are also important (Owens et al., Reference Owens, McMillan, Laird and Bullmore2005). Similar to our previous report with this task, we used a two-stage process for determining the fMRI ROIs: (1) delineate broad search ROIs, and (2) within these broad regions, find clusters of voxels where brain activity was significantly modulated for each interval of the task (i.e., encode and maintenance) for BD and HC groups separately. Search ROIs were defined identically to our previous report (McKenna et al., Reference McKenna, Brown, Drummond, Turner and Mano2013) using the AFNI daemon (Cox, Reference Cox1996). For supramarginal gyri search ROIs, Brodmann area 40 from the daemon was used. For DLPFC search ROIs, Brodmann areas 9 and 46 were used, but the lower portion that encompassed the inferior frontal gyrus was removed and a Gaussian filter (FWHM 4 mm) applied. A cluster threshold method was used to control Type I error (Forman et al., Reference Forman, Cohen, Fitzgerald, Eddy, Mintun and Noll1995); clusters were considered active if they contained a threshold number of contiguous voxels, each individually activated at the p≤.01 level. This provided a corrected p-value of.01 for each cluster. We then extracted the mean BOLD signal within each of these clusters for each participant in their respective group for use in subsequent statistical analyses (see Figure 1a for processing steps).
MRI processing pathways. a: Steps used for functional magnetic resonance imaging data. b: Steps used for diffusion tensor imaging data. BD=bipolar disorder; HC=healthy comparison; BOLD=blood oxygen level dependent signal.

For DTI ROIs, extraction of FA data was carried out using tract-based spatial statistics (Smith et al., Reference Smith, Jenkinson, Johansen-Berg, Rueckert, Nichols, Mackay and Behrens2006) with FSL toolboxes (Smith et al., Reference Smith, Jenkinson, Woolrich, Beckmann, Behrens, Johansen-Berg and Matthews2004). Subjects’ FA data were aligned into standard space. Then mean FA images were thinned to create a FA skeleton encompassing the centers of all tracts common to all participants. An FSL white matter tract probability atlas (Hua et al., Reference Hua, Zhang, Wakana, Jiang, Li, Reich and Mori2008) was used to define bilateral superior longitudinal fasiculi, uncinate fasiculi, and the body, genu, and splenium of the corpus callosum within the skeleton. We then extracted FA values for each participant from the atlas-defined tracts for use in subsequent analyses. Furthermore, each participant’s FA data were inversely warped back into their original space to ensure ROIs encompassed the correct white matter tracts for each individual. Figure 1b depicts the processing steps for the FA data.
Statistical Modeling and Data Analyses
Independent-samples t tests, assuming unequal variances, were used to compare the means of the demographic, cognitive, and neuroimaging variables between BD and HC groups. We then fit separate models for the BD and HC groups to predict working memory accuracy and processing speed from the joint neuroimaging measures. Analyses were run in R (R Development Core Team, 2009) using the LARS package (Efron et al., Reference Efron, Hastie, Johnstone and Tibshirani2004) for BD and HC groups separately. Before model selection, all neuroimaging predictors for each group were mean centered and normalized. Best fitting models for each analysis were chosen using the Cp statistic and a K-fold cross validation procedure. Specifically, each of N steps were arranged in sequential order and we chose models with the minimum Cp in the fewest N steps (Efron et al., Reference Efron, Hastie, Johnstone and Tibshirani2004). To further avoid model overfitting, a five-fold cross validation procedure was used. Any variables that were not present in at least four of five folds were dropped from consideration as important predictors of cognitive performance.
To better understand apparent differences in the models between groups, we ran a follow-up analysis in which a design matrix included neuroimaging data from both groups in addition to a group predictor variable and the associated group-by-neuroimaging interaction terms was used. This allowed us to examine directly if any brain regions demonstrated a differential association with cognitive domains between groups, in addition to brain regions demonstrating main effects important for explaining cognition in a domain regardless of group membership. Model selection and cross validation followed the same steps as used for each group separately.
Results
Group Comparisons
There were no differences between BD and HC participants in age or education (p’s>0.05). There were no associations between medication load and any neuroimaging or behavioral measure (all p’s>.05). Furthermore, independent sample t-tests comparing BD patients using different classes of psychotropic medication (e.g., lithium vs. no-lithium) revealed no differences in neuroimaging or behavioral measures (all p’s>.05). Consistent with the literature, inter-episode BD patients demonstrated mild dysfunction in working memory accuracy and processing speed (i.e., medium effect sizes; see Table 2). On the processing speed subtests the BD sample made a total of 5 errors (3 set loss and 2 sequencing errors) while the HC sample made 3 errors (2 set loss and 1 sequencing error). There was no difference among patients who had a history of psychosis versus no history of psychosis on our behavioral and neuroimaging measures. However, there was a negative relationship between lifetime illness duration and working memory accuracy (r=−0.567; p=.003), but not for processing speed.
Cognitive performance between samples

Note. Mean and standard deviation in parentheses are presented for each group along with the results of an independent samples t-test assuming unequal variances. Test results including p-value and effect size Cohen’s d provided.
BD=bipolar disorder patients; HC=healthy comparison participants; %=percent correct; s=seconds.
Determination of Functional Regions
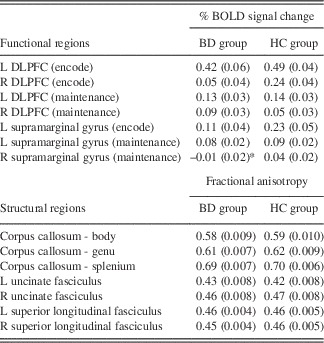
Within the DLPFC and supramarginal search ROIs, significant activation clusters were found in all regions during encode and maintenance intervals of the working memory task for the HC group (protected p’s<.01), with the exception of right supramarginal gyrus during the encode interval. For the BD group, significant clusters of activation were found in all regions except right supramarginal gyrus during both encode and maintenance intervals. Therefore, subsequent analyses for both groups excluded right supramarginal gyrus during the encode interval. Additionally, BD group design matrices were used with the right supramarginal gyrus during the maintenance interval that (1) excluded this region, (2) used BD patients’ BOLD values from the HC-derived ROI, and (3) used BD patients’ BOLD values averaged across the right supramarginal search region to fully capture the role of this region relative to the HC sample. Consistent our previous report, BD patients demonstrated lower BOLD signal in left DLPFC during the encode interval (t60=3.42; p<.001; Cohen’s d=0.97). However, BD patients did not demonstrate reduced FA in any white matter ROI (all p’s>.05). Table 3 provides descriptive statistics for functional and structural measures used in fusion models.
MRI estimates

Note. Data reflect mean and standard errors in parentheses for functional magnetic resonance imaging percent change in BOLD signal from baseline and diffusion tensor imaging fractional anisotropy. BOLD: blood oxygen level dependent; L: left; R: right; encode: working memory task encode interval; maintenance: working memory task maintenance interval; BD: bipolar disorder patients; HC: healthy comparison participants.
* No significant cluster found for bipolar patients: values reflect patient data from the HC-derived cluster.
Model Results
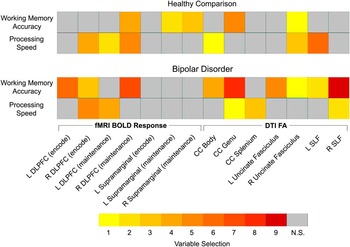
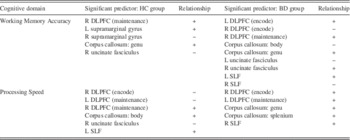
Figure 2 depicts the best fitting models within the BD and HC samples, separately. Both functional response and white matter integrity measures were significant predictors in the final models for each cognitive domain. However, while there was some overlap in the neuroimaging measures found to be related to performance between groups, other measures and relationships varied between HC participants and BD patients. Specifically, for working memory accuracy, the BOLD response in the right DLPFC during the maintenance interval and FA in the genu of the corpus callosum were important predictors for both groups. On the other hand, while FA in the right uncinate fasciculus was the strongest predictor for each group, the direction of relationship was opposite in BD and HC groups. Additionally, BOLD response within bilateral supramarginal gyri during the maintenance interval were important predictors for HC participants; whereas BOLD response of bilateral DLPFC during the encode interval, and FA in the splenium of the corpus callosum, left uncinate fasciculus, and bilateral superior longitudinal fasciculi were important predictors only for BD patients.
Least angled regression variable selection results. Numbers reflect order variables were selected for each model. N.S.=not selected; fMRI=functional magnetic resonance imaging; BOLD=blood oxygen level dependent signal; DTI=diffusion tensor imaging; FA=fractional anisotropy; L=left; R=right; DLPFC=dorsolateral prefrontal cortex; CC=corpus callosum; SLF=superior longitudinal fasciculus.

For processing speed, BOLD response of the right DLPFC during the encode interval and of the left DLPFC during the maintenance interval were important predictors within both groups, yet the direction of the relationship was different in HC compared to BD. BOLD response of the right DLPFC during the maintenance interval and FA in the body of the corpus callosum and right uncinate fasciculus were important predictors only for HC participants. On the other hand, FA within the genu and splenium of the corpus callosum and right superior longitudinal fasciculus were important predictors only for BD patients (see Table 4 for cognitive-predictor relationships).
Relationship between significant neuroimaging predictors and cognitive functions

HC=healthy comparison; BD=bipolar disorder; L=left; R=right; DLPFC=dorsolateral prefrontal cortex; SLF=superior longitudinal fasciculus.
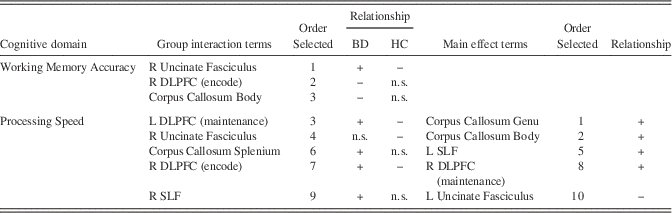
In models with group-by-brain-region interaction terms included, significant interactions were found within both cognitive domains (Table 5) that generally confirm the impression of differences from examining the models of each group separately (Figure 2). In some cases, the direction of the brain-behavior relationship was opposite in the two groups (e.g., the relationship of right uncinate fasciculus FA predicting working memory accuracy), and in other cases, there was a significant brain-behavior relationship in HC but not BD (e.g., right uncinate fasciculus FA predicting processing speed) or, more often, in the BD but not HC group (e.g., right DLPFC response and FA of the body of the corpus callosum predicting working memory performance, and FA of the right SLF predicting processing speed). Table 5 also shows significant main effect terms from these more complex models, which show a role in both groups for FA of the genu and body of the corpus callosum in prediction of processing speed.
Regions demonstrating a group-by-neuroimaging interaction and neuroimaging main effect

BD=bipolar disorder patients; HC=healthy comparison participants; n.s.=not selected; L=left; R=right; DLPFC=dorsolateral prefrontal cortex; SLF=superior longitudinal fasciculus.
Importantly, the overall pattern of findings for both working memory accuracy and processing speed do not change for the BD group if the right supramarginal gyrus during the maintenance interval is excluded from the design matrix, if the HC-derived cluster is used, or if the average patient’s BOLD data are extracted from the overall search region.
Discussion
The present study fused fMRI and DTI data finding that both functional and white matter structural measures jointly predicted cognition among all participants. Consistent with hypotheses, BD patients demonstrated unique brain-cognition relationships compared to HC participants. For both cognitive domains tested (i.e., working memory accuracy and processing speed), there was a set of neural measures that, within the context of the overall model, were differentially predictive for BD patients. For example, several measures predicted cognitive performance among BD and not HC participants including functional responsiveness in bilateral DLPFC during working memory encoding, and FA in left uncinate fasciculus, bilateral superior longitudinal fasciculus, and genu and splenium of the corpus callosum. Conversely, several measures were not significant predictors for BD patients, but were for HC participants, including right DLPFC and bilateral supramarginal gyrus during working memory maintenance processes, and FA of the body of the corpus callosum and right uncinate fasciculus. These findings suggest that the observed trait-like (i.e., independent of mood) decreases in processing speed and working memory abilities among BD patients may be due to changes to specific aspects of the underlying neural networks assessed.
Unimodal fMRI studies have generally found hypoactivation of DLPFC and supramarginal gyri among BD patients which has been attributed to impaired working memory and processing speed (Chen, Suckling, Lennox, Ooi, & Bullmore, Reference Chen, Suckling, Lennox, Ooi and Bullmore2011; McKenna et al., Reference McKenna, Sutherland, Legenkaya and Eyler2014; Townsend et al., Reference Townsend, Bookheimer, Foland-Ross, Sugar and Altshuler2010). Alternatively, hyperactivation among BD patients has been observed in other regions implicated in cognitive and emotional functions such as the precuneus, ventrolateral prefrontal cortex, and limbic structures (Phillips & Swartz, Reference Phillips and Swartz2014). With respect to white matter, unimodal DTI studies of BD patients have demonstrated lesions within superior longitudinal fasciculi which are associated with impaired performance on executive function tasks (Biesbroek et al., Reference Biesbroek, Kuijf, van der Graaf, Vincken, Postma and Mali2013); whereas reduced FA in uncinate fasciculi has been associated with increased risk taking (Linke et al., Reference Linke, King, Poupon, Hennerici, Gass and Wessa2013), with inter-hemispheric connectivity via the corpus callosum playing a role such that BD patients have abnormalities in inter-hemispheric integration (Leow et al., Reference Leow, Ajilore, Zhan, Arienzo, GadElkarim, Zhang and Altshuler2013). Here, the data confirm that these regions are important predictors for working memory and processing speed among inter-episode BD patients. These results extend the literature to suggest a set of neuroimaging measures that underlie cognitive dysfunction among BD patients characterized by differential engagement of these regions within an overall network model. For example, within unimodal fMRI analyses BD patients demonstrate dysfunction in bilateral DLPFC during encoding into verbal working memory (McKenna et al., Reference McKenna, Sutherland, Legenkaya and Eyler2014) highlighting attentional processes as a core dysfunction within working memory. Here, the DLPFC during working memory encoding is an important predictor only for BD patients suggesting that those patients who are most able to engage this region within the overall network may perform better and those who cannot perform worse on working memory tasks.
These data cannot speak to whether the observed findings represent a predisposing risk factor in the organization of the brain leading to onset of BD and cognitive dysfunction or represent the disease burden of having BD. Although, of note we did observe a relationship such that patients with longer durations of illness had worse working memory performance. Also, these data only represent a subset of neural regions necessary for working memory and processing speed functions. Additional studies expanding on the subset analyzed here are needed to more fully understand the complicated neural network underlying cognition, such as the basal ganglia (McNab & Klingberg, Reference McNab and Klingberg2008). Future studies with longitudinal designs are needed to examine how neural networks underlying cognition change over time. Of interest, DLPFC functional response was an important predictor of cognitive performance in the HC group, but only when measured during the maintenance interval of the working memory task. In these analyses and our previous unimodal one, there were no group differences in maintenance-related DLPFC function, but the fusion models suggest that engagement of this region during maintenance is important to overall performance in HC, but not in BD.
Of interest, among our neuroimaging measures we observed both positive and negative relationships with cognitive performance when controlling for the other significant brain measures in the model. Generally within the literature, positive relationships are reported where the higher the signal on an unimodal neuroimaging measure the better the cognitive performance among both patients and HC participants, although this is not always the case. Within the context of regression-based fusion models, directionality of brain-cognitive relationships in patient samples has not been examined in detail, as these reflect complex patterns when accounting for multiple measurement modalities. Importantly, the measurement model for BD patients suggests that relationships with cognitive performance differ potentially due to employment of a different neural network to meet task demands compared to HC participants, albeit at reduced levels. The use of different networks is consistent with cognitive degeneracy, or the possibility for different structures to perform the same function (Noppeney, Friston, & Price, Reference Noppeney, Friston and Price2004). Perhaps this is reflective of compensatory changes due to long-standing network abnormalities due to BD pathology. However, within each cognitive domain there was a set of measures that were predictive for both BD and HC samples suggesting that there are common neural pathways that predict cognitive performance which are not directly affected by the pathophysiology of BD.
Overall, these findings represent important first steps in discovering how interactions of DTI structural and fMRI functional abnormalities contribute to the disabling cognitive impairments of BD. Brain regions do not operate discretely within the brain, and current neuroimaging research aims to use multi-modal high dimensional data to better understand neural network differences within the disorder (McCarley, Nakamura, Shenton, & Salisbury, Reference McCarley, Nakamura, Shenton and Salisbury2008; Sui et al., Reference Sui, Pearlson, Caprihan, Adali, Kiehl, Liu and Calhoun2011; Wang et al., Reference Wang, Kalmar, He, Jackowski, Chepenik, Edmiston and Blumberg2009). However, no current neuroimaging studies of BD have used behavioral performance in the fusion models. Thus, a strength of the present study was that performance in critical cognitive domains was used in the model building, thus providing a set of brain regions directly associated with cognitive performance within each group. It should be noted that group differences in the pattern of brain-behavior relationships were found despite the fact that many of the individual MRI measures used were not significantly different between groups in the derived ROIs. This suggests that even in regions where there are not frank changes in brain function and/or structure there may be alterations in the way distributed networks contribute to cognitive performance. Multimodal approaches like the type used here will likely shed light into the pathophysiological basis for cognitive and emotional changes observed in BD patients. Theoretical models have postulated that disruption in white matter connectivity and prefrontal pruning within networks that modulate emotional behavior (e.g., ventral prefrontal cortex to limbic regions) and cognitive functions (e.g., dorsal prefrontal to parietal cortices) lead to abnormal functional responses in neurons (Chen et al., Reference Chen, Suckling, Lennox, Ooi and Bullmore2011; Strakowski et al., Reference Strakowski, Adler, Almeida, Altshuler, Blumberg, Chang and Townsend2012). White matter may be disrupted structurally and/or functionally in how efficient it processes information among neural regions. DTI provides quantitative information about the geometric distribution of water diffusion (Basser, Reference Basser2006), with the goal to infer information about the integrity of tissue microstructure from this geometric information. Given the inferences made it is difficult to ascertain etiology of DTI signal differences observed here. Reduced FA suggests reduced density of cellular membranes possibly due to tissue loss (e.g., demyelination) leading to less restrictive diffusion, though many patterns of FA changes have been observed (for a review in BD, see Heng et al., Reference Heng, Song and Sim2010). Given that we did not observe significant FA changes among our BD sample, but changes in model fit statistics, it may be the case that other mechanisms such as bioenergetics impact white matter connectivity leading to cognitive impairment (Strakowski, DelBello, & Adler, Reference Strakowski, DelBello and Adler2005).
While our study is novel in several ways, there are limitations. By definition, least angled regression is a model building technique that is based on data exploration. We chose ROIs based on the current neuroimaging research with BD patients. However, there may be other brain regions (e.g., insula, ventral prefrontal cortex, angular gyrus, and cingulate), neuroimaging measures (e.g., cortical thickness), demographic, and/or clinical variables may have been important predictors if included in the design matrix. However, the aim of the present study was to examine a subset of the working memory/processing speed cortical network known to be required for the working memory task used here. Future research incorporating other brain and non-brain measures may yield additional informative patterns. Our sample was older representing patients who have had BD for a longer time than younger individuals making generalization to a younger cohort difficult. There are likely longitudinal changes that may lead to more neural dysfunction the longer you have had the disorder or the more episodes you have had. We also decided on a method to define our neuroanatomical regions based separately for each group. Other strategies such as defining regions that demonstrate group differences may yield different findings and interpretations. Nonetheless, the current findings provide important neural targets for future studies to more fully explore.
A limitation of many MRI studies is the potential medication effects. Use of psychotropic medication has been shown to influence brain response, primarily in the prefrontal cortex, increasing activity to similar levels as those of non-medicated healthy participants (Phillips, Travis, Fagiolini, & Kupfer, Reference Phillips, Travis, Fagiolini and Kupfer2008; McKenna et al., Reference McKenna, Sutherland, Legenkaya and Eyler2014). Within our BD sample we did not observed any differences between medication classes in behavioral or MRI measures or associations with medication load, though these types of analyses are often underpowered. We decided not to include a medication variable in the LASSO regression analyses because of the group differences in medication use (thus the bipolar group would have an additional variable) and because we had no hypotheses about how inclusion of a medication variable would impact the model fit statistics. Medication effects are complex for a variety of reasons, such that different classes of medication can have activating effects (through glutamatergic pathways) or “de-activating” effects (through GABA-ergic pathways). As such, studies designed to examine medication effects on MRI measures in detail are needed, though outside the scope of our study design (for a review, see Hafeman, Chang, Garrett, Sanders, & Phillips, Reference Hafeman, Chang, Garrett, Sanders and Phillips2012). Indeed, the impact of medication on fusion models, such as the one used here, has not been explored and future studies designed to specifically address these effects are needed to examine if altered networks among patients are due to psychotropic medication.
Studies featuring multimodal combination provide additional novel informative in understanding brain activity within disorders than those which consider each neuroimaging modality separately. By using cognitive data to reduce high dimensional fMRI and DTI data, we demonstrate a way to understand which joint neuroimaging measures directly predict the cognitive impairment observed among adult BD inter-episode patients. Future studies are needed to address key questions in how more complex brain-behavior networks change over the duration of illness and identify possible risk factors for cognitive dysfunction among patients.
Acknowledgments
We thank the Desert Pacific Mental Illness Research Education and Clinical Center for infrastructure support, Allison Kaup, Vicki Wang, Heather Larabee, Alexandrea Harmell, Stephanie Taube, Rebecca Daly, Shahrokh Golshan, Yadira Maldonado, Joshua Kuperman, Matt Erhart, Hauke Bartsch, Anna De Modena, and Mary Phillips for assistance. We also thank the San Diego Depression and Bipolar Support Alliance, International Bipolar Foundation, San Diego Chapter of the National Alliance for Mental Illness, and the dedicated volunteer participants. This study was funded, in part, by National Institute of Mental Health grants R01-MH083968 and P30-MH080002, and the National Institute on Drug Abuse T32-DA031098. The authors have no conflicts or financial disclosures to report.