

When votes are cast in mass elections and one of the parties or candidates is declared the winner, the losers can react in three different ways: they can abide by the results and accept defeat; they can challenge the results but accept the rules of the game; or they can turn against democracy. Good illustrations of these three reactions are: the uncontroversial defeat of the centre-left candidate, Eduardo Frei, by the centre-right candidate, Sebastián Piñera, in the 2010 Chilean presidential election, the first turnover since the restoration of democracy; the mass protests, marches and civil disobedience led by the Party of the Democratic Revolution (PRD) candidate, Andrés Manuel López Obrador, after the announcement of his defeat in the 2006 Mexican presidential election; and the coup d’état in 1936 in Spain, five months after the national election won by the left-wing Popular Front. What explains the different reactions of losers after the election in these examples and more generally across elections worldwide? This is the question we address in this article.
The mechanisms explaining losers’ consent (that is, losers’ compliance with the current outcome and the institutional framework (Nadeau and Blais Reference Nadeau and Blais1993)) are controversial. Many studies have examined the determinants of compliance with the rules of democracy (see Svolik Reference Svolik2015 for a recent overview), the effect of being an electoral winner or loser on people’s beliefs about the political systems (Anderson et al. Reference Anderson, Blais, Bowler, Donovan and Listhaug2005) or the use of legal avenues to reject electoral outcomes (Chernykh Reference Chernykh2014). However, under what conditions losers are willing to challenge the results of elections remains uncertain. How contentious elections arise is still not clear (Norris et al. Reference Norris, Frank and Martinez i Coma2015).
Broadly speaking, there are three possible explanations for losers’ consent: the ‘loser-friendly competition’ argument – losers in an election accept the results because they have sufficient chances to win in future elections; the ‘opportunity cost’ argument – losers accept their defeat because they will lose out economically from a return to authoritarianism; and the ‘subversion’ argument – losers anticipate that they will lose out in a hypothetical conflict over dictatorship and so prefer to acquiesce. To the best of our knowledge, there is no measure that directly captures whether parties or candidates accept the election, and so these questions have never been confronted. The different dependent variables employed when testing the three arguments (authoritarian reversals, the existence of riots and protests after the election that involved the allegations of vote fraud, or political violence, among many others) do not allow us to determine which reason prevails.
In this article, we fill this gap by providing a measure of the post-election behaviour of parties or candidates. We rely on data from the Electoral Integrity Project (EIP) (see Norris et al. Reference Norris, Frank and Martinez i Coma2013, Reference Norris, Frank and Martinez i Coma2014; www.electoralintegrity.com) for national elections in 66 democratic and non-democratic countries worldwide held in the second half of 2012 and 2013 to test the three competing arguments. Relying on country expert surveys conducted weeks after each election, the measure captures whether parties or candidates challenged the election result, using a scale going from 1 (parties did not challenge the election result) to 5 (parties did challenge the election result). We find empirical support for the opportunity cost argument and, above all, for the loser-friendly competition argument: losers’ consent is more likely in economically more developed countries, especially when elections are free. However, the argument that losers’ consent is driven by their expectations of the chances of winning a hypothetical fight does not find strong support.
The rest of the article proceeds as follows. The next section presents the three competing arguments for losers’ consent. We then describe the data and methods. The fourth section discusses the results of the empirical analysis. The final section concludes and discusses some policy implications of our findings.
ARGUMENTS
What makes democracy survive is a long-standing question in political science. The puzzle, however, has nothing to do with winners in elections – they are expected to be satisfied both with the outcome and the process – but with the reactions of losers. As Nadeau and Blais (Reference Nadeau and Blais1993: 553) note, losers’ support of legal and institutional processes ‘requires the recognition of the legitimacy of a procedure that has produced an outcome deemed to be undesirable. In the end, the viability of electoral democracy depends on its ability to secure the support of a substantial proportion of individuals who are displeased with the outcome of an election.’ According to the actor-based approach introduced by Mainwaring and Pérez-Liñán (Reference Mainwaring and Pérez-Liñán2013), democracies are more likely to survive when political actors, losers in particular, have a strong normative preference for democracy. When candidates acknowledge defeat in an election instead of challenging the results, they signal their commitment to the democratic regime.
Broadly speaking, there are three explanations for losers’ consent or the formation of preferences for democracy: the loser-friendly competition argument, based on the idea that all groups must have a chance of attaining power; the opportunity cost argument, relying on the income gap between democracies and dictatorships; and the subversion argument, hinging on the probability of winning an armed conflict.
The Loser-friendly Competition Argument
According to the classical argument formulated by Przeworski (Reference Przeworski1991), the losers in a particular democratic election accept the results when they have sufficient chance of winning in the future to make it more attractive for them to wait rather than to rebel. Regular and fair elections are the necessary condition for today’s loser to become the winner in the future. That is, complying with the current outcome, even if it is a defeat, is the dominant strategy for relevant actors because the outcomes of electoral democracy are an iterated and uncertain game.
As Przeworski puts it,
Compliance depends on the probability of winning within the democratic institutions . . . What the model suggests is that in analyzing any concrete situation one should consider the values and the chances the particular political forces attach to advancing their interests under democracy and outside it. Democracy will evoke generalized compliance, it will be self-enforcing, when all the relevant political forces have some specific minimum probability of doing well under the particular systems of institutions. (1991: 30–1)
More recently, Fearon (Reference Fearon2011) has revisited the argument considering models of electoral accountability. Self-enforcing democracy requires publicly understood rules for regular elections in order to allow citizens to credibly threaten mass protest if the ruler shirks from calling an election. To prevent abuse and to ensure optimal provision of public goods, individuals must be able to threaten to coordinate to oppose depredations by the ruler. How can parties with different views of society coordinate their actions? According to Fearon (Reference Fearon2011: 1693), electoral democracy allows the problem to be solved. The public implicitly threaten to protest or rebel if elections are not held according to a commonly known electoral calendar. Whether elections are held according to the schedule is a publicly observable signal, which permits coordination and can make the implicit threat credible.
In non-democratic regimes, however, ‘elections provide a time for change and challenges’ (Lindberg Reference Lindberg2009: 327). What characterizes democratization by elections as a mode of transition is precisely that elections in authoritarian regimes have to do both with winning votes and seats and democratization (Lindberg Reference Lindberg2009; Schedler Reference Schedler2002, Reference Schedler2009). Accordingly, since elections are less free and fair in non-democracies than in democracies, the expectation is that losers’ compliance with the current outcome and the institutional framework will be less likely in the former than in the latter.
Therefore, our first hypothesis is as follows:
Hypothesis 1: The probability of challenging the election results should decrease when elections are free and fair.
However, as Przeworski also argues (1991: 33), in order to make losing under democracy more attractive than a future under non-democratic alternatives, democratic institutions must be effective – that is, they should improve the wellbeing of individuals. In other words, compliance demands both fair elections and economic development. The loser-friendly competition argument interacts then with the opportunity cost argument. Fearon (Reference Fearon2011: 1694) makes a similar point when arguing that a credible threat of coordinated opposition is easier to arrange in an economically more developed setting: organizations in society beyond the direct control of the ruler and the high economic costs of violent conflict are positively correlated with economic development. Thus, it can be expected that
Hypothesis 1A: The probability of challenging the election results should decrease when free and fair elections are held in more economically developed countries.
The Opportunity Cost Argument
In several pieces after Democracy and the Market, Przeworski (Reference Przeworski2005, Reference Przeworski2006) argues that above some sufficiently high income level, losers will accept an electoral defeat independently of their chances of winning in the future. That is, losers’ consent is solely a function of economic development or, more specifically, per capita income, while fair elections are neither sufficient nor necessary for democracy to survive. When the income level is high – at least $6,055, the per capita income of Argentina in 1975 – losers will accept an electoral defeat simply because even permanent losers have too much to risk if they turn against democracy. In Przeworski’s words,
As income increases, the gap between the well-being of electoral losers and of people oppressed by a dictatorship becomes large. The stakes are too high to risk losing the income guaranteed under democracy. Yet dependence on income, and all the other results, would also hold if we were to assume that people have a preference for democracy, independently of income. The interpretation of the results would be then as the marginal utility of consumption declines, the preference for democracy (or against dictatorship) overwhelms the eventual consumption gain from becoming a dictator. (2005: 265)
The empirical evidence provided in the second chapter of Democracy and Development is conclusive. Przeworski et al. (Reference Przeworski, Alvarez, Cheibub and Limongi2000: 137) show that democracies are much more likely to survive in affluent societies. Per capita income is by far the best predictor of the survival of democracies, whatever may be happening to them. Similarly, Svolik (Reference Svolik2008) finds that the level of economic development determines the extent to which a democracy is susceptible to the risk of reversal. For instance, a $1,200 increase in GDP per capita raises the probability that a democracy is consolidated from 20 per cent to 80 per cent. Therefore,
Hypothesis 2: The probability of challenging the election results should decrease the higher the per capita income is.
Additionally, income distribution may also play a role when explaining the stability of democracies. According to Przeworski (Reference Przeworski2005, Reference Przeworski2006), the distribution of income must remain within bounds that make it sufficient for the poor and not excessive for the rich. While in poor unequal countries there is no redistribution scheme that satisfies the two constraints, the bounds open up as per capita increases. In other words, the impact of income distribution is driven by per capita income.
On the basis of the discussion, the following hypothesis can be formulated:
Hypothesis 2A: The probability of challenging the election results should be affected by income inequality in countries with a low per capita income.
The relationship between income distribution and democratization, however, is controversial. For instance, according to Boix (Reference Boix2003), democratization and democratic consolidation are bolstered by high levels of income inequality. Since ‘the tax [which the holders of the most productive assets] will pay in a democratic regime finally becomes smaller than the cost of repression that they would have to bear to exclude the majority of citizens, they accept introduction of a system of universal suffrage’ (Boix Reference Boix2003: 10–11). Contrary to this argument, Acemoglu and Robinson (Reference Acemoglu and Robinson2006) expect a U-shaped relationship between inequality and democracy, with democracy happening at intermediate levels of inequality. Thus, ‘democracy arises when inequality is sufficiently high that the disenfranchised want to contest power but not so high that the elites find it attractive to use repression’ (Acemoglu and Robinson Reference Acemoglu and Robinson2006: 218).
The Subversion Argument
The third argument explaining why democracy is an equilibrium has been recently formulated by Chacón et al. (Reference Chacón, Robinson and Torvik2011). Instead of discussing why losers abide by the outcomes of elections, the approach is focused on the conditions under which actors will subvert democracy and choose to fight for power. Compliance with the rules of democracy depends not only on the chances of winning within the democratic institutions, but also on the chances of winning a conflict over dictatorship.
The chances of winning a conflict over dictatorship was a parameter also considered by Przeworski (Reference Przeworski1991, Reference Przeworski2006), but taken as exogenous: it was hypothesized to depend on the relationship with military force (Przeworski Reference Przeworski2006: 316). However, according to Chacón et al. (Reference Chacón, Robinson and Torvik2011), the factors influencing the probability that a party wins under democracy also affect its ability to win if it decides to violate the democratic rules. Relying on data from a single country, Colombia, and using municipal political violence as a dependent variable, they show that electoral competitiveness, or the margin between the winner and the loser in a given election, is a proxy for the loser’s chances of winning a fight: the higher the margin of victory, the lower the loser’s probability of fighting, and vice versa.Footnote 1 The rationale is shared by Powell (Reference Powell2012: 1019) when arguing that coup conspirators carefully evaluate their chances of success; they should only attempt a coup when the expected rewards of the manoeuvre and its probability of victory are high enough to offset the dire consequences of a failed putsch.Footnote 2
In sum, as Chacón et al. (Reference Chacón, Robinson and Torvik2011: 368) conclude, ‘democracy may only emerge as an equilibrium when support is asymmetric in the sense that one of the parties dominates the other. In contrast, when the support of parties is balanced, or in other words in circumstances when both parties have a good chance of winning power in democracy, fighting may occur.’ According to Chacón et al. (Reference Chacón, Robinson and Torvik2011), it can be hypothesized that:
Hypothesis 3: The loser’s probability of challenging the election result should increase the lower the margin of victory in the election.
However, Chacón et al.’s argument is aimed at non-consolidated democracies or, more specifically, less economically developed democracies. Not surprisingly, their empirical evidence comes exclusively from Colombian municipalities. While in non-consolidated democracies a narrow margin of victory (or defeat) can hold the balance of whether the losers are likely to win a hypothetical armed conflict, in consolidated democracies it is not clear how we should interpret such electoral competitiveness in terms of stability. For instance, it is hardly arguable that the Democratic Party in the United States was more willing to support a coup d’état after its electoral defeat in 2000 than in 1988 or 2004. At most, in consolidated or economically more developed democracies, the margin of victory in the election may simply mean that the loser will demand a close examination of the results. But we do not think that electoral competitiveness and the challenging of electoral results are correlated in advanced democracies. In our view, the argument should basically work in non-democracies. According to the two-level game of democratization formulated by Schedler (Reference Schedler2002: 111), when opposition parties succeed in accumulating strength in the electoral arena in authoritarian regimes, they improve their chances of extracting institutional reforms from the ruling party; ambivalent elections tend to trigger a ‘self-subversive’ spiral. Therefore, opposition actors will only protest after fraudulent elections if they perceive that there is a reasonable chance that they will win reform. Our hypothesis 3A argues then that:
Hypothesis 3A: The lower the margin of victory in the election, the higher the likelihood that the loser will challenge the election result in non-democratic regimes.
DATA AND METHODS
In order to explore what explains losers’ consent, we need an indicator that links the self-enforcing attribute of democracies with observations and that travels well across countries (and arguments). Authoritarian reversals (Przeworski Reference Przeworski1991; Przeworski et al. Reference Przeworski, Alvarez, Cheibub and Limongi2000), the existence of riots and protests after the election that involve allegations of vote fraud (Hyde and Marinov Reference Hyde and Marinov2014) or political violence (Chacón et al. Reference Chacón, Robinson and Torvik2011), for instance, capture different but compatible phenomena. For example, allegations of vote fraud and even political violence do not necessarily lead to authoritarian reversals in democracies (e.g. Mexico in 2006), while authoritarian reversals can take place without fraud being present (e.g. Spain in 1936).
According to Przeworski (Reference Przeworski1991: 26), democracy becomes self-enforcing when complying with the election outcome, even if it is a defeat, is the best action for the relevant political forces. Or, as Diamond (Reference Diamond1999: 69) also states, for a democracy to be consolidated, political actors ‘have to obey the laws, the constitutions, and mutually accepted norms of political conduct’. That is, once votes are cast in an election and one party or candidate is declared the winner, the crucial parameter to observe if democracy is self-enforcing is whether losers accept the election result or not. To the best of our knowledge, there are no comparative studies of democracy survival using a measure that captures losers’ consent.Footnote 3 Data collected by the Electoral Integrity Project allow us to fill the gap. Domestic and international experts were asked to evaluate whether each national parliamentary and presidential election held from 1 July 2012 to 31 December 2013 met international standards during the pre-election period, the campaign, polling day and its aftermath (see Norris Reference Norris2013).Footnote 4 Data are available for 66 independent, democratic and non-democratic, nation states. See the Appendix for a description of the sample.
To analyse the post-election reactions of parties and candidates, experts were asked the following question:Footnote 5
Do you agree or disagree with the following statement:
Parties/candidates challenged the results
-
∙ Strongly disagree (5)
-
∙ Disagree (4)
-
∙ Neither agree nor disagree (3)
-
∙ Agree (2)
-
∙ Strongly agree (1)
We have created a continuous measure of losers’ consent called Challenge, which reflects the experts’ evaluation average of the country, ranging from 1 (parties did not challenge the election result) to 5 (parties did challenge the election result). The lower the value, the more self-enforcing the political regime is.Footnote 6 We have included both democracies and non-democracies in the sample for four reasons. First, focusing attention only on democracies does not allow for a proper testing of the mechanisms accounting for the survival of democracies. As all elections in democracies are basically free and fair, we have no variability in this variable and therefore the (statistical) analysis would not be possible. Second, incumbents in the vast majority of regimes today call voters to the polls. Authoritarian elections are not rare, although their purpose is different from elections in democracies (see Gandhi Reference Gandhi2008; Gandhi and Lust-Okar Reference Gandhi and Lust-Okar2009; Schedler Reference Schedler2002). If democracy endures because it is self-enforcing and elections are virtually universal, it makes more sense to compare whether parties or candidates challenge the election result in democracies and dictatorships than in consolidated and non-consolidated democracies. Third, as shown by Lindberg (Reference Lindberg2006), opposition parties are more likely to withdraw from elections viewed as not free and fair, those marred by violence, and those in which the incumbent wins a disproportionate number of seats. Indeed, we know that the positive effects of holding repetitive elections are not restricted to free and fair elections (Lindberg Reference Lindberg2009: ch. 1). Finally, when including non-democracies, both the variation on the dependent variable and the number of observations are maximized: the explanation is more powerful and the explanation and the results are more certain.
In order to interpret the values of our dependent variable and clarify what challenging the results means across regimes, the following examples of countries with scores above and below 3, the mean in the scale, are enlightening. The 2013 election in Turkmenistan scores 5 in our measure. According to Amnesty International (2013), this election took place in ‘an atmosphere of total repression, denial of the basic human rights, and the all-permeating fear that has gripped society in Turkmenistan for years’. Obviously, in such a context, any challenge to the results has to be done from outside the country, by those in exile. The head of the Turkmen Initiative for Human Rights, Farid Tukhbatulin, lives in Austria (BBC 2013), as do many members of the opposition, including former government officials. Moreover, some outspoken opponents of the regime have disappeared or are in jail (Gurt Reference Gurt2013). The Organization for Security and Cooperation in Europe Office for Democratic Institutions and Human Rights (ODIHR 2014: 4) deployed an electoral mission that stated: ‘While the existence of a second political party constitutes an appearance of political variety, it does not provide voters with a genuine choice between political alternatives.’Footnote 7 The absence of political pluralism was obvious. The 2012 election in Mexico scores 4 in our dependent variable. Andrés Manuel López Obrador, the defeated presidential candidate from the Party of the Democratic Revolution, challenged the results after the election, as he did in 2006 (Serra Reference Serra2014). He asked for a recount of more than half of the ballots cast. The results did not change, however.Footnote 8 There was a large march in Mexico City, but it was less massive than the months-long protests that took place in 2006. The election of Nicolás Maduro in Venezuela in 2013 was also contentious. Henrique Capriles, the leader of the losing party, refused to recognize his defeat and called his supporters to peaceful demonstrations in the street to demand a full manual recount. At least eight people were killed (Ellsworth Reference Ellsworth2013). The value of the dependent variable in Venezuela was above 4, as it was in Cameroon in 2013, where the opposition filed complaints to the Supreme Court before the election, but the court refused to accept them (Kindzeka Reference Kindzeka2013). The party of President Paul Biya obtained 148 out of 180 seats (Musa Reference Musa2013). On the other hand, in countries scoring below 3 in our measure – such as Norway, Chile, Albania, Israel or Ecuador – the results were peacefully accepted by the opposition.Footnote 9
The values of Challenge for the 66 countries included in our sample are displayed in Figure 1. There are two interesting results. Firstly, there are huge differences across countries: the standard deviation is 1.27. Secondly, not surprisingly, democracies score lower than non-democracies. An election is deemed to be democratic when and where the country obtained a score higher than 6 on the Polity IV rating of political rights.
Challenging the Election Results in 66 Countries

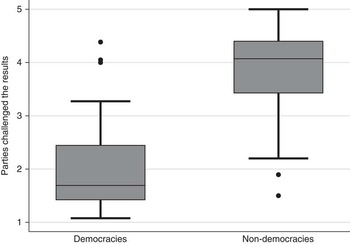
In Figure 2, democracies and non-democracies are compared through a box plot. As can be seen, the median for democracies is much lower than for non-democracies and, interestingly, the overlap between the two boxes is limited: the fourth quartile in non-democracies (i.e. the 25 per cent of non-democracies scoring lowest) and the first quartile in democracies (i.e. 25 per cent of democracies scoring highest) overlap. Additionally, within both democracies and non-democracies there are important differences.
Challenging the Election Results in 66 Countries: Democracies and Non-Democracies

Finally, the establishment of the phenomenon concludes with the presentation of the descriptive statistics of Challenge for democracies and non-democracies in Table 1. As expected, the mean value of the 25 democracies, 2.09, is lower than the mean value of the 41 non-democracies, 3.83. The difference is statistically significant at the 0.01 level.
Challenging the Election Results: Descriptive Statistics

Source: Electoral Integrity Project.
In order to determine which variables influence losers’ consent in a particular round of the electoral competition, we estimate different variants of the following model:
 $$\eqalignno{ & Challenge\,{=}\,\beta _{0} {\plus}{\rm }\beta _{1} {\plus}\,Free\,Elections\,{\plus}\,\beta _{2} \,\left( {log} \right)Per\,Capita\,Income\cr &\quad{\plus}\beta _{3} \,Income\,Inequality{\plus}\beta _{4} Political\,Competition{\plus}\beta _{5} \,\left( {log} \right)Population\,\cr &\quad{\plus}\,\beta _{6} \,Tertiary\,Education{\plus}\mu $$
The four key independent variables have been operationalized as follows:
-
∙ Free Elections indicates whether the election for head of government or other chief national authority was free and fair according to the Freedom House political rights ratings component for every country in 2013. Its coding is reversed for interpretation purposes. The variable goes from 1 (representing the smallest degree of freedom) to 7 (the greatest degree of freedom). The source is Freedom House (2015). The variable is expected to enter negatively in the model.
-
∙ The log value of real Per Capita Income (in constant dollars, Chain Index, expressed in international prices, base 2005, taken from the Penn World Tables, PWT 7.1) is expected to have a negative effect.
-
∙ Income Inequality indicates comparable Gini indices of market and net income inequality taken from the Standardized World Income Inequality Database (SWIID) by Solt (Reference Solt2013). These data are not available for Equatorial Guinea, Grenada, Kuwait or Micronesia: this explains the different number of observations in Models 2 and 3 in Table 3. The variable is expected to enter positively in the model.
-
∙ Political Competition is the difference between the vote shares for the two main parties in the election. Following Chacón et al. (Reference Chacón, Robinson and Torvik2011), the measure is: Political Competition=│%First Party−% Second Party│/ 100. When the vote totals for the two parties are the same, we have a highly competitive environment and the index takes the value 0. When all of the votes go to one of the parties, we have a completed hegemony and the index takes the value 1. In other words, the higher the value, the less competitive the election. If the value is 0.1, for example, the first party’s vote share is 10 points higher than the second party’s vote share. The sources are the respective electoral commissions. Data are not available for Belarus, Micronesia or Swaziland: this explains the different number of observations across models in Table 3. The variable should negatively affect the dependent variable.
Descriptive Statistics

The Determinants of Losers’ Consent in Mass Elections

Note: Robust regression. Estimation is by ordinary least squares. Standard errors in parentheses. * p < 0.1; ** p < 0.05; *** p < 0.01.
We control for two standard variables capturing arguments dealing with development-related socioeconomic factors and ethno-linguistic fragmentation conditions (see Gasiorowski and Power Reference Gasiorowski and Power1998: 749–55)Footnote 10 :
-
∙ The gross enrolment rate in the Tertiary Education for the total population. The source is the UNESCO Institute for Statistics. The variable has been operationalized in this way to maximize the number of countries included in the analysis. The variable is expected to have a negative impact.
-
∙ The (log of) Population in 2012 is taken from the Penn World Tables, PWT 7.1. Alesina and Spolaore (Reference Alesina and Spolaore2003: 4) claim that in larger countries there are more diverse preferences, cultures and languages within the population. Therefore, a country’s heterogeneity of preferences increases as it becomes larger. The variable is expected to enter positively in the model.
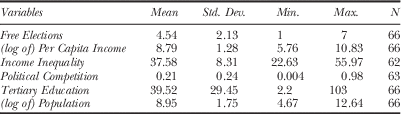
The descriptive statistics of the independent variables are displayed in Table 2.
The models are estimated through ordinary least squares. As two outliers have been identified in the models, Iran and Rwanda, which score much lower in the five-point scale than might be expected, robust regressions have been run.Footnote 11
RESULTS
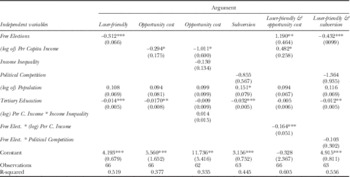
Table 3 examines the impact of free elections, economic development and competition, on the Electoral Integrity Project measure capturing losers’ consent. The two controls for education and population are also included. We have run six specifications: to what extent election results are challenged is regressed on every key independent variable and the controls – the opportunity cost argument is tested using two specifications − while in the fifth and sixth models two interactions between Free Elections and Per Capita Income and Free Elections and Political Competition, respectively, are included.Footnote 12
The first model, which tests the loser-friendly competition argument, explains about 52 per cent of the variance of the post-election behaviour of parties or candidates in the five-point scale. As expected, Free Elections has a negative sign. That is, when elections are fair, parties accept the election results to a greater extent. All else being equal, when going from the least fair elections (value 1, for instance in Equatorial Guinea), to the fairest ones (value 7, for instance in Australia), Challenge decreases by 1.872 points (−0.312 × 6). The variable is statistically significant at the 0.01 level. The loser-friendly competition argument, formulated in Hypothesis 1, is then strongly supported. The two control variables also have the expected signs, but only the gross enrolment rate in Tertiary Education is statistically significant (at the 0.01 level).
The second model tests the opportunity cost argument. As expected in our Hypothesis 2, Income Per Capita has a negative sign and is statistically significant at the 0.1 level. That is, losers are less likely to challenge the results of elections in rich countries than in poor ones. For instance, all else being equal, when going from the first quartile (an income per capita about $2,300) to the third one (an income per capita about $19,500), Challenge decreases by 0.630 points ((–0.294 × 7.735) versus (–0.294 × 9.877)). The two controls again have the expected positive signs, but only Tertiary Education is statistically significant (at the 0.05 level). The model produces a worse fit than the first specification. The opportunity cost argument is then supported by our results, but its explanatory power is substantially lower than in the case of the loser-friendly competition argument. When the interaction between Per Capita Income and Income Inequality is added to the previous specification in Model 3, the interactive term is not statistically significant. That is, income inequality does not affect countries with a low or a high per capita income differently. Hypothesis 2A is thus rejected. The only statistically significant variable (at the 0.10 level) is (log of) Per Capita Income. However, note that this is substantively meaningless since there are no countries in which the Gini coefficient is equal to 0.
The subversion argument is examined in the fourth model. Although the closeness of elections negatively affects the dependent variable (that is, when the support for the two main parties is unbalanced, the probability of accepting the election results increases), it is not statistically significant (p = 0.137). That is, the argument that losers’ consent is driven by their expectations about their chances of winning a hypothetical fight does not find strong support. The two controls behave as expected and are statistically significant at the 0.01 level (Tertiary Education) and at the 0.1 level (Population).
Finally, in Models 5 and 6 the conditional hypotheses combining the three arguments are tested. The first interactive specification examines to what extent losers’ decision to wait for the next election when the electoral contest is fair is affected by the country’s economic development (Hypothesis 1A). Model 5 produces the largest R-squared (0.605). The interaction between Free Elections and Per Capita Income is negative and statistically significant at the 0.01 level. This means that economic development makes losers less likely to challenge the election results when free and fair elections are held. The loser-friendly argument is reinforced by the opportunity cost argument and vice versa. The (log of) Population and Tertiary Education are not statistically significant.
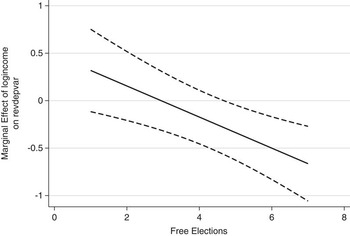
As interactions are not easy to interpret, Figure 3 shows how the marginal effect of Free Elections changes across the range of Income Per Capita. As the solid sloping line indicates, Free Elections decreases the occurrence of challenges to election results the wealthier the countries are. Specifically, the interaction is significant when the value of Income Per Capita is around 8.5 (e.g. in Mexico or Cyprus). In 59 per cent of the elections in our sample the value of Income Per Capita is above this value.
Simulating the Challenge of Election Results

Finally, according to the sixth model, election closeness does not affect losers’ consent differently in democracies and non-democracies. The interaction between Free Elections and Political Competition is not statistically significant, nor is the marginal effect (not shown). Thus, the subversion argument does not work in either democracies or electoral non-democracies. Hypothesis 3A, reflecting the strategic calculation of opposition in electoral authoritarian regimes deciding to protest or not depending on whether they feel such protest is likely to succeed, is then rejected. Free Elections and Tertiary Education are the only statistically significant variables and have the expected negative signs. The coefficient on Free Elections indicates that fair and free elections have a significant reductive effect on the propensity to challenge the results of elections when the vote totals for the two main parties are the same (that is, when there is a tie).
In sum, the probability of accepting election results increases when elections are free and fair and in more economically developed countries, while election closeness and income inequality do not play very relevant roles. Additionally, the impact of holding a free and fair election on the probability of losers’ consent is particularly important in economically more developed countries.Footnote 13
CONCLUSIONS
Staying within the institution of democracy can be an equilibrium when democracy becomes the only game in town: parties or candidates accept election results because that is the best strategy for pursuing their interests. When winning or losing does not alter post-election behaviour, democracy is self-enforcing. However, this common understanding of electoral democracies in terms of losers’ consent has not been accompanied by a corresponding measure. Durability or specific outcomes such as a robust political competition or a vibrant civil society are very crude proxies for the self-enforcing nature of democracies as they fail to reflect how political actors behave when they compete for power. As a result of the absence of a measure that directly captures whether parties or candidates abide by the election results, what makes democracies survive remains an open question.
Relying on unique data from the Electoral Integrity Project, we have measured how parties or candidates react in 66 democracies and non-democracies once votes are cast and one of them is declared the winner. Do they obey or challenge the result? This measure enables us to test the competing mechanisms accounting for losers’ consent. We find very strong support for the opportunity cost argument and, above all, for the loser-friendly argument. Losers’ consent is more likely in economically more developed countries and where elections are free and fair, while income inequality is not relevant. Additionally, the impact of holding free and fair elections on losers’ consent is particularly important in more economically developed countries. However, the argument that losers’ consent is driven by their expectations of the chances of winning a hypothetical fight does not find strong support. These findings have important implications for how democracy should be promoted worldwide. Democracies need first and foremost free and fair elections, particularly if they are accompanied by economic development.
Our empirical analysis is a first step towards dealing with losers’ consent in mass elections. Clearly, other studies, with more countries, with a dependent variable capturing differences between the type and intensity of challenges, as well as with data over time are crucial for testing the quality and reliability of our measure and the robustness of our findings.
APPENDIX: SAMPLE
Albania (Legislative, 2013), Angola (Legislative, 2012), Argentina (Legislative, 2013), Armenia (Presidential, 2013), Australia (Legislative, 2013), Austria (Legislative, 2013), Azerbaijan (Presidential, 2013), Barbados (Legislative, 2013), Belarus (Legislative, 2012), Bhutan (Legislative, 2013), Bulgaria (Legislative, 2013), Burkina Faso (Legislative, 2012), Cambodia (Legislative, 2013), Cameroon (Legislative, 2013), Chile (Presidential, 2013), Congo Rep. (Legislative, 2012), Cuba (Legislative, 2013), Cyprus (Presidential, 2013), Czech Rep. (Legislative, October 2013), Djibouti (Legislative, 2013), Ecuador (Presidential, 2013), Equatorial Guinea (Legislative, 2013), Georgia (Presidential, 2013), Germany (Legislative, 2013) Ghana (Presidential, 2012), Grenada (Legislative, 2013), Honduras (Presidential, 2013), Iceland (Legislative, 2013), Iran (Presidential, 2013), Israel (Legislative, 2013), Italy (Legislative, 2013), Japan (Legislative 2013), Jordan (Legislative, 2013), Kenya (Presidential, 2013), Korea Rep. (Presidential, 2012), Kuwait (Legislative 2013), Lithuania (Legislative, 2012), Madagascar (Presidential, 2013), Malaysia (Legislative, 2013), Maldives (Presidential, 2013), Mali (Presidential, 2013), Malta (Legislative, 2013), Mauritania (Legislative, 2013), Mexico (Presidential, 2012), Micronesia (Legislative, 2013), Mongolia (Presidential, 2013), Montenegro (Presidential, 2013), Nepal (Legislative, 2013), Netherlands (Legislative, 2012), Norway (Legislative, 2013), Pakistan (Legislative, 2013), Paraguay (Presidential, 2013), Philippines (Legislative, 2013), Romania (Legislative, 2012), Rwanda (Legislative, 2013), Sierra Leone (Presidential, 2012), Slovenia (Presidential, 2012), Swaziland (Legislative, 2013), Tajikistan (Presidential, 2013), Togo (Legislative, 2013), Turkmenistan (Legislative, 2013), Ukraine (Legislative, 2012), United States (Presidential, 2012), Venezuela (Presidential, 2013), Zimbabwe (Presidential, 2013).
ACKNOWLEDGEMENTS
We thank Pablo Beramendi, Hilde Coffé, Abel Escribà, Graeme Gill, Wolfgang Merkel and Pippa Norris for their helpful comments. Ignacio Lago gratefully acknowledges the fellowship provided by the Electoral Integrity Project (EIP), University of Sydney (February–May 2014). A preliminary version of the article was presented at the weekly EIP Research Seminar Series, Sydney, April 2014. The data set can be found at https://dataverse.harvard.edu/dataset.xhtml?persistentId=doi:10.7910/DVN/9UVAKE