Introduction
Interest groups play a vital role in channeling the concerns of the citizens to politicians (Putnam, Reference Putnam1993). In a representative democracy having such ‘intermediaries’ is a condition for ensuring that the demands of the citizens are transmitted to the decision makers and translated into political outputs (Easton, Reference Easton1971). At the same time, the literature makes clear that interest groups may not translate public demands in a neutral manner but twist political outputs away from what the general public would want toward the interests of selected groups (see e.g. Schattschneider, Reference Schattschneider1960; Salisbury, Reference Salisbury1984; Drew, Reference Drew1999). As a result, rules and regulations for dealing with organized interests in as transparent a manner as possible exist to reduce the danger that special interests capture public decision making (Lehmann and Bosche, Reference Lehmann and Bosche2003; Malone, Reference Malone2004; Chari et al., Reference Chari, Murphy and Hogan2007; Mihut, Reference Mihut2008).
In spite of these attempts, empirical research concludes almost unanimously that interest groups do not ensure a neutral transmission of public views into policies. Perhaps, the most famous criticism is Schattschneider’s quote that, ‘the flaw in the pluralist heaven [of interest representation] is that the heavenly chorus sings with a strong upper-class accent’ (1960: 35). His predictions were later scrutinized and echoed in sophisticated studies involving compilations of large n data sets: rather than reflecting the views of the public as a whole, the interest group system is dominated by certain interests (see e.g. Schmitter and Lehmbruch, Reference Schmitter and Lehmbruch1979; Katzenstein, Reference Katzenstein1985; Schlozman and Tierney, Reference Schlozman and Tierney1986; Schlozman et al., Reference Schlozman, Verba, Brady, Jones and Burch2008; Baumgartner et al., Reference Baumgartner, Berry, Hojnacki, Kimball and Leech2009; Greenwood, Reference Greenwood2011). More specifically, representation tends to be dominated by business groups at the expense of the views of public and identity-based groups (see e.g. Baumgartner and Leech, Reference Baumgartner and Leech2001; Schlozman et al., Reference Schlozman, Verba, Brady, Jones and Burch2008; Wonka et al., Reference Wonka, Baumgartner, Mahoney and Berkhout2010; Rasmussen and Carroll, Reference Rasmussen and Carroll2013).
The vast share of the existing studies of bias in the access of interest groups does not include a clear benchmark for judging whether a given distribution of interests involved in policy making is biased. Clearly, we would not require there to be equal representation of different types of substantive interests, as some substantive interests exist in much higher numbers than others in the first place. To discover that business groups and trade unions enjoy greater access than civil society groups may therefore not show that there is bias in the access of organized interests if these groups dominate interest group populations to begin with. Instead, we propose a study of the bias in access of interests to policy-making venues that explicitly links information about group participation in policy-making venues with interest group register data. This allows us to theorize about the likelihood that registered groups from the broader population of interest groups are granted access to the advisory committees of the European Commission.Footnote 1
Examining selection mechanisms to such advisory committees is particularly relevant in the European Union (EU) political system, which places high emphasis on involving civil society to improve its state of democracy (European Commission, 2001, 2002; Rasmussen and Alexandrova, Reference Rasmussen and Alexandrova2012). Interest groups are given primary responsibility to act as transmission belts between the public and the political system, whereas political parties are weaker in this construction and do not play the same role as in many member states (Gaffney, Reference Gaffney1996; Lindberg et al., Reference Lindberg, Rasmussen and Warntjen1998). At the same time, our findings are also relevant for studying bias in access beyond the EU context. Hence, the European Commission’s advisory committees are comparable with advisory committees used around the world (see e.g. Roose, Reference Roose1975; Katzenstein, Reference Katzenstein1984; Domhoff, Reference Domhoff1998; Balla and Wright, Reference Balla and Wright2001; Peters, Reference Peters2001; Karty, Reference Karty2002). The design of institutional procedures and bodies involving external actors in policy preparation figure prominently on the agenda of western democracies eager to maintain a high degree of democratic legitimacy.
Our models predict both whether a given group is represented in advisory committees as well as how many seats it holds. Our findings confirm that special interests representing a substantial organizational budget dominate the European Commission’s advisory committees. However, they also show that the selection procedures mitigate some of the potential biases in interest group access. Business interests do not have a general advantage over other group types in the selection processes and their degree of access varies between policy areas. Furthermore, we do not find a bias in access against groups from small member states or those from Central and Eastern European member states. Instead, groups with a supranational scope are privileged, especially on the permanent (as opposed to temporary) advisory committees. Finally, the lobbying budget stimulates access even if we find some evidence that a high lobby budget is more important for special than diffuse interest groups.
Access bias and mobilization
We can distinguish between two stages of mobilization (Rasmussen et al., Reference Rasmussen, Carroll and Lowery2014). Stage one deals with whether latent interests in society end up being successful in mobilizing and forming groups in the first place. Stage one bias refers to the fact that some interests face such severe challenges in forming that they do not succeed in mobilizing in the first place (i.e. that do not appear in the interest group population at all). The second stage focuses on whether organized groups participate in policy making once formed. We refrain from examining stage one mobilization here, as there is no such thing as a good overview of the latent interests in society, which can be compared with the population of groups (Baumgartner and Leech, Reference Baumgartner and Leech1998; Lowery and Brasher, Reference Lowery and Brasher2004; Lowery and Gray, Reference Lowery and Gray2004; Schlozman et al., Reference Schlozman, Verba, Brady, Jones and Burch2008). Instead, we focus on stage two bias and scrutinize the conditions under which organized groups get access.
Interest group communities can of course be biased in a number of different respects (Danielian and Page, Reference Danielian and Page1994). Some might be concerned with the relative distribution between different substantive interests, such as business, labor, public interests, etc., and others with the representation of different geographical entities. Moreover, even if one agrees normatively on the relevant dimensions for assessing bias in access, different ways of classifying the objects into, for example, group types or geographical entities may result in different findings. The share of trade unions as a whole engaged in policy making may be perfectly representative of the population of organized trade unions, whereas the blue collar unions may not. Here we do not restrict ourselves to assessing bias in access on one specific criterion, but perform a study of what conditions (degrees of) access to advisory committees by looking at multiple dimensions, such as substantive group types, geographical domains, and different resource levels.
More specifically, we look at the likelihood that registered actors from the broader population of interest groups falling into different categories on these dimensions are granted seats on advisory committees. In other words, rather than expecting that certain types of groups are equally represented in order to be unbiased, our notion of access bias is a concept that says something about the correspondence between the relative degree of access enjoyed by certain groups in registry and actual membership data. As an example, we examine how strong the access enjoyed by groups representing a certain substantive interest or geographical scope is. If their representation on advisory committees is strictly proportional to that of the population, we speak of no bias in access. In contrast, when groups in a category on a dimension (such as business groups on the substantive group type dimension) are over- or underrepresented then we speak of bias in access. Our approach does not make a normative judgment about whether it would be desirable to have certain types of groups (e.g. those representing a European as opposed to a national interest) represented. Over- or underrepresentation of a given category of groups (small, big, business, NGOs, European, national, etc.) is equally ‘problematic’.
In this way, we do not require different types of interests to display an equal level of membership for a system of interest group access to be unbiased. In most political systems, some interests exist in higher numbers than others. We would expect such groups to enjoy greater access than the rest without being concerned that they dominate representation. Our focus is the degree of correspondence of groups possessing certain characteristics in registry and membership data.
By using an explicit ‘benchmark’ for assessing bias rather than simply comparing shares of groups with access to policy-making venues, our analysis offers a marked improvement over existing work. Advisory committee membership can be regarded as more exclusive than other types of interest group strategies, as it is typically not open but relies on access being provided by the political institutions. However, it is clear that we examine ‘bias in access’ rather than ‘bias in influence’, which would require different types of data (on, e.g., the preferences of the advisory committee members and their policy outcomes) that are not publically available. Therefore, our analysis cannot answer whether all ‘voices’ on the advisory committees end up ‘singing equally loud’. The literature on corporatism has made it very clear how a few peak-level organizations representing organized business and labor are often allocated a privileged position (Schmitter, Reference Schmitter1979; Siaroff, Reference Siaroff1999; Streeck and Kenworthy, Reference Streeck and Kenworthy2005). At the same time, having access to these policy-preparing forums is an essential precondition for exerting influence for all interest groups owing to the crucial role played by these committees.
The advisory committees of the European Commission
The advisory committees of the European Commission actively participate in the process of policy consultation and drafting. Their main tasks are to provide advice on new policy initiatives and proposals, and monitor and coordinate cooperation between the European Commission, its member states, and other external actors. They do not have authority to make formal policy decisions but provide scientific knowledge and expert advice and serve as crucial forums for exchanging information and practical experience (Gornitzka and Sverdrup, Reference Gornitzka and Sverdrup2008). The main justification given by the European Commission to the existence of advisory committees is the need for ‘sound policies’.Footnote 2 Even if there are few official rules regulating the work of these advisory committees, they have become ‘a standard way for a large proportion of the DGs to interact with their environment’ (Gornitzka and Sverdrup, Reference Gornitzka and Sverdrup2008).
However, there is ambiguity regarding how these committees are created and their members selected (ALTER-EU, 2008), but recent internal guidelines shed more light on the process. Typically, advisory committees are set up through a European Commission decision or other legal act (e.g. a Council decision), or by a European Commission service with the agreement of the Secretariat-General (Gornitzka and Sverdrup, Reference Gornitzka and Sverdrup2008, Reference Gornitzka and Sverdrup2010). Members are selected on the basis of a call for applications (European Commission, 2010a), but the respective European Commission service selects from the pool of applicants. According to official documents, applicants are selected on the basis of their competence and the ‘need to strike a balance within the group of experts in terms of representativeness of applicants, gender and geographical origin’ (European Commission, 2010a). Studies on the practice of membership selection show that subjective reasons might lead some DGs to ignore these guidelines (Larsson and Murk, Reference Larsson and Murk2007) or to select members strategically (Larsson, Reference Larsson2003).
A study of 14 EU advisory committees found that the committee membership was ‘seriously unbalanced’ in favor of business representatives even in policy areas of major importance for public interests (ALTER-EU, 2008). Mahoney (Reference Mahoney2004) conducted the first academic study of the link between organizational characteristics of interest representatives and their advisory committee membership. She showed that organizations with a Brussels office and those which speak for a broad range of EU countries have a higher probability of holding advisory committee seats in a regression of 434 organizations. A recent study analyzes a new data set on advisory committee membership (Chalmers, Reference Chalmers2013) but does not use registry data as a benchmark for examining potential biases in access. The reason is that, rather than being interested in explaining whether organizations get a seat at the table in the first place, its focus is to explain whether those organizations that are represented on these committees hold one or more seats. The remaining, existing research has focused on explaining the use of advisory committees (Metz, Reference Metz2013), the number of committees in different policy areas (Gornitzka and Sverdrup, Reference Gornitzka and Sverdrup2008) and over time (Metz, Reference Metz2013), and whether committees consist of one or more types of actors (such as national administrations and authorities, scientists, NGOs, interest groups, and regional and local governments) (Gornitzka and Sverdrup, Reference Gornitzka and Sverdrup2010). One reason behind this gap in the literature is that the European Commission only launched its online register of interest groups in 2005, and the publishing of actual names of the members and their organizational affiliation was not completed before January 2009 (European Commission, 2010b). The availability of both the expert register and the EU Transparency Register provides a good opportunity to use the EU as a case for exploring what determines access in a study of bias using registry data as an explicit benchmark. Moreover, the sheer number of cases and newly available register data on additional organizational attributes also allow us to add to existing knowledge in important ways. First, the higher number of cases make it possible not only to examine whether there are differences between group types, but also whether and how much they benefit from possessing resources. Second, it enables us to conduct analyses on subsets of our data in order to see whether access patterns to advisory committees vary between different policy areas.Footnote 3
What explains selection in stage two mobilization?
The decision of bureaucrats to grant interest groups access to advisory committees can be modeled as a process of resource exchange. Bureaucrats seek expertise and legitimacy by granting groups seats on advisory committees, and interest groups provide these goods in return for policy influence (Kohler-Koch, Reference Kohler-Koch1994; Bouwen, Reference Broscheid and Coen2004; Dür, Reference Dür2008). Using the terminology of population ecologists, ‘mutually beneficial relationships will form when organisms have important resources to offer one another and when they come into frequent contact’ (Witko, Reference Witko2009). The calculations of the interest groups and bureaucrats are likely to be affected by a series of factors.
First, we might see differences in the propensity to gain access among groups representing different substantive interests. The literature on bias in access generally finds that business dominates representation (see e.g. Schlozman, Reference Schlozman1984; Schlozman and Tierney, Reference Schlozman and Tierney1986; Gais, Reference Gais1996; Rozwell and Wilcox, Reference Rozwell and Wilcox1999; Gray and Lowery, Reference Gray and Lowery2001; Baumgartner et al., Reference Baumgartner, Berry, Hojnacki, Kimball and Leech2009; Yackee and Yackee, Reference Yackee and Yackee2009). ‘The upper-class accent’ so prominently referred to by especially so-called transaction class scholars is a ‘business accent’ (Schattschneider, Reference Schattschneider1960). One of the reasons is that business groups often have more resources than other group types, because they tend to have a high number of members that pay substantial contributions to their organization. This could mean that they can offer more technical expertise to the decision makers (Bouwen, Reference Bouwen2002b; Broscheid and Coen, Reference Bouwen2003) than other types of groups (such as those representing minorities or diffuse, public interests), which may have fewer resources.
Business groups may also have privileged access to the EU advisory committees owing to the special character of the competences delegated to the EU. So-called pluralist scholars argue that interest groups mobilize as a result of policy disturbances to their interests (Truman, Reference Truman1951). Interest groups will try to get access in areas with something at stake for them, and bureaucrats also consider whose interests are affected when deciding who obtains access. According to this argument, the set of issues on the political agenda will affect the access enjoyed by different types of interest groups. The EU has been delegated a selective set of policy responsibilities, most of which lie within the regulatory area (Majone, Reference Majone1996; Hix, Reference Hix2005). The strong role of business groups in such areas may give them an advantage in becoming involved in the policy-preparatory bodies (Coen, Reference Coen1998). At the same time, it would also follow from pluralist thinking that different policy areas would disturb and mobilize somewhat different interests. This would mean that ‘the coverage of interest group voices may be compartmentalized by issue’ (Danielian and Page, Reference Danielian and Page1994: 1060) and that the degree of business access varies between policy areas. We therefore hypothesize that:
Hypothesis 1a: Business groups are more likely to enjoy (a stronger degree of) access than other group types at the aggregate level.
Hypothesis 1b: Business groups are more likely to enjoy (a stronger degree of) access in business as opposed to non-business policy areas.
Second, the size of the geographic scope of an interest group’s organization might matter: that is, whether actors represent EU member states of different sizes, non-EU member states, or a European or international scope. Traditionally, EU-level groups have enjoyed stronger access to the European Commission than national ones (Bouwen, Reference Bouwen2002a, Reference Bouwenb; Michalowitz, Reference Michalowitz2004; Eising, Reference Eising2007). The work of the advisory bodies may also be more relevant to groups with a supranational scope and they may be more familiar with the governmental apparatus at this level than national groups. Moreover, the European Commission may have a preference for interacting with representatives from European umbrella organizations, which are supposed to be detached from national loyalties and represent an encompassing European interest. According to Larsson and Murk, on occasion ‘interest groups wanting to become part of an expert group have been denied a seat owing to a lack of sufficient European coverage’ (2007: 77).
The Commission may also allocate groups from bigger member states a more prominent position than those from smaller ones. Engaging groups representing as many interests as possible helps the European Commission secure its legitimacy. Hull notes that ‘Commission officials tend to appreciate a representative lobbyist or interest group who can speak on behalf of a cross-section of interests throughout the Community’ (Reference Hull1993: 86). Moreover, seen from a transaction cost perspective (see e.g. Williamson, Reference Williamson1979), interacting with supranational groups and groups from bigger member states is simply easier than negotiating separately with a large number of national actors. We therefore hypothesize that:
Hypothesis 2a: Groups representing a European and international scope are more likely to enjoy (a stronger degree of) access than other group types.
Hypothesis 2b: The bigger the EU member state a group comes from the more likely it is to enjoy (a stronger degree of) access.
Third, we might also expect a difference in the level of access between groups from new Central and Eastern European member states and other groups active in EU lobbying. Participation of actors from new member states in online consultations is, for instance, much lower than from old ones (Quittkat and Finke, Reference Quittkat and Finke2008; Quittkat, Reference Quittkat2011). This does not necessarily mean that groups from these newer member states also have a lower chance than other groups of gaining access but may also simply mean that civil society is less developed in these new member states, which are still in the process of adapting (Falkner and Treib, Reference Falkner and Treib2008). However, the low numbers could also reflect that, even if civil society in Central and Eastern Europe is rapidly developing (Pleines, Reference Pleines2006), organizations from these new member states may still have less expertise and fewer resources to offer the Commission than other organizations, which may have built up a strong relationship to the Commission over time. We therefore hypothesize that:
Hypothesis 3: Groups from Central and Eastern European member states are less likely to be granted (a strong degree of) access than other groups.
Fourth, organizational resources and the degree of access may be linked (see e.g. Smith, Reference Smith1984; Hall and Wayman, Reference Hall and Wayman1990; Leyden, Reference Leyden1995; Eising, Reference Eising2007). Resources play a role in ensuring that organizations can develop and offer the expertise the decision makers need. As emphasized by Mahoney (Reference Mahoney2004), ‘a resource set’ can be seen as ‘a multidimensional entity, composed of assets in the forms of capital, members, information, and credibility’ and has been measured in numerous ways (Dür, Reference Dür2008). Indeed some of the factors discussed, such as geographical scope, can also be seen as resources of importance in the exchange relation between bureaucrats and interest groups. A core resource discussed is the organizational budget, which serves as a precondition for the build up of other resources, such as organizational staff, networks, and expertise. Schlozman and Tierney point out that ‘what makes money important in politics is its convertibility – the fact that it can easily be transformed into other valued political resources’ (Reference Schlozman and Tierney1986: 89). Of particular relevance to getting lobbying access is not the entire budget of a given organization, but the share of resources devoted to public affairs. We therefore hypothesize that:
Hypothesis 4a: The higher the lobbying budget the more likely a group is to enjoy (a stronger degree of) access.
The effect of the lobbying budget on the likelihood of obtaining access to the advisory committees may not be the same for all group types. The literature distinguishes between those groups representing special and diffuse interest constituencies (Olson, Reference Olson1971). Special groups have a well-defined constituency (e.g. particular producer or socio-economic interests), whereas the constituency of diffuse groups is not clearly defined but often broadly linked to general societal concerns (e.g. consumer and environmental interests). These two types of groups may depend on different access goods or may not derive the same benefit from the same goods. A key rationale provided for the dominance of business groups in the interest group community is often their possession of fiscal resources (see e.g. Schattschneider, Reference Schattschneider1960; Lindblom, Reference Lindblom1977; Schlozman and Tierney, Reference Schlozman and Tierney1986; Mahoney, Reference Mahoney2004). They use their organizational budget to build up expertise, which helps them gain access and ultimately influence policy outcomes. The literature contains no lack of arguments that diffuse interests are disadvantaged as a result of their lack of organizational budgets (see e.g. Schlozman, Reference Schlozman1984).
Instead, the literature describes how diffuse interests can employ types of resources other than financial ones to gain access, for example, membership resources. Gerber (Reference Gerber1999: 70) argues that the organizational structure gives the economic (i.e. specialist) groups ‘a comparative advantage in amassing monetary resources’, whereas citizen (i.e. diffuse) groups have ‘a comparative advantage in mobilizing personnel resources’. Another comparative advantage of diffuse interests is their ability to provide legitimacy to the political decision makers. As already mentioned, the EU is a special type of political construction where considerable efforts are spent on actively stimulating the participation of underrepresented public interests (Lindblom, Reference Lindblom1977; Dunleavy and O’Leary, Reference Dunleavy and O’Leary1987). The European Commission’s (2001) ambitious White Paper on European governance argues in favor of ‘open and inclusive participation’ and sets the norm that not only directly affected stakeholders but also civil society organizations representing general interests should be involved in EU decision making (Kohler-Koch, Reference Kohler-Koch2010). As a result, the European Commission spends a substantive amount of the EU budget giving subsidies to interest groups to conduct their primary affairs (McLaughlin and Greenwood, Reference McLaughlin and Greenwood1995; Mahoney, Reference Mahoney2004; Mahoney and Beckstrand, Reference Mahoney and Beckstrand2011). Between 2000 and 2006, the ‘Community action program to combat discrimination’ had subsidized umbrella networks of European NGOs lobbying against discrimination on the basis of age, gender, race, and disability (Quittkat and Finke, Reference Quittkat and Finke2008). Ultimately, this does not mean that a lobbying budget is irrelevant for diffuse interest groups in getting access of course. However, the outlined differences may mean that the lobbying budget has a lower value for diffuse interests, which can rely on other resources for being granted access. As a result, we hypothesize that:
Hypothesis 4b: The lobbying budget is more important for enjoying (a stronger degree of) access to advisory committees for groups representing special interests than for groups representing diffuse interests.
Data and methodology
In order to examine who gains access, we rely on two different data sources: a database on members of European Commission advisory committees constructed from its expert register of interest groups and the European Commission Transparency Register. The first data set contains information on the advisory committees, their members, and the organizations they represent.Footnote 4 The number of advisory committees varies over time. Some are created and some disappear on a continuous basis, according to the Commission’s need for expertise or political leverage in relation to other institutions.Footnote 5 This might generate confusion among observers and surely fuel the debate regarding their number. At the time of the data collection we found 1027 advisory committees. Out of these, ~50% did not have membership information, which resulted in the reduction of our sample of advisory committees to 570.
Not all members of the advisory committees are interest groups, of course. As a first step we therefore classified advisory committee members into the following categories (1) companies, (2) public institutions, (3) European bodies and institutions, (4) private persons and experts, (5) interest groups, (6) international organizations, and (7) other types of actors. We define an interest group as ‘an association of individuals or organizations, usually formally organized, that, on the basis of one or more shared concerns, attempts to influence public policy in its favour’.Footnote 6 According to this definition, interest groups accounted for 3442 seats altogether representing a total of 1301 different interest groups on 268 different committees. Our analysis is conducted for these actors only for several reasons. First, to assess the degree of correspondence between registry and membership data, we need to examine actors for which high-quality registry data can be obtained. Finding or constructing a population source of all relevant public institutions, private persons, and experts, which could in principle hold advisory committee seats, is not feasible. Companies do have the option to register in the Transparency Register and company representatives account for 8.1% of the total number of advisory committee seats in our data set. However, the reviews of the functioning of the Transparency Register point to a lack of registration of companies, lobby consultancies, law firms, and think tanks, which are not included in our analysis (European Commission, 2009; ALTER-EU, 2012) compared with traditional interest groups. By pooling data on companies and interest groups with different Transparency Register ‘registration rates’, we would risk introducing selection bias into our analysis. It would not be unrealistic to expect that those companies that have in fact registered themselves in the Transparency Register are exactly those that have a close relationship to the Commission and have a high likelihood of possessing advisory committee seats in the first place. If so, we might draw the erroneous conclusion in a pooled analysis of companies and interest groups that the advisory committees favor the interests of companies even if a high likelihood for registered companies to hold seats might be a simple reflection of the fact that company registrations rates are low and biased to begin with. As a result we leave companies out of the analysis. Second, the advantage of relying on interest groups is also that they can relatively easily be classified into group types, which link to the substantive type of interest represented. Indeed, the substantive interest represented (business, environment, health, etc.) is one of our main dimensions for examining bias in access. Matching a number of the remaining actor types, for example, public authorities and individuals, with a specific type of substantive interest would be much more difficult.
The aim of the second data set is to establish a source that gives the best possible overview of interest representatives in EU policy that can act as a benchmark for judging bias. In the absence of a compulsory lobbying register, finding official data on the population of EU interest groups is nearly an impossible task. We rely on the Transparency Register launched after an inter-institutional agreement of the European Commission and the European Parliament (European Commission and European Parliament, 2011).Footnote 7 The register is constantly updated and incorporates the European Commission Register of interest representatives (former CONNECCS) and the former European Parliament registry. It contains a broad range of actors that lobby the EU, including companies, professional consultancies, local and regional authorities, and different types of association. Until the complete merger, the register included distinct categories of actors from the European Commission register of interest representatives beside the categorization of the Transparency Register. For the purpose of analysis, here we are only interested in the actor category ‘interest groups’ defined above. Therefore, we only downloaded information for the actor categories from the Transparency Register that were relevant for this actor category (see online Appendix 1) and subsequently deleted an additional 290 entries from these categories, which did not fit the definition of what constitutes an interest group.Footnote 8 As a result, we have altogether 2786 actors from the Transparency Register in our interest group registry data.
Even though the Transparency Register is by far the biggest register of EU representatives, the voluntary nature of registration means that it does not yet contain the entire EU population of interest representatives.Footnote 9 However, compared with alternative data sources approaching a census of interest groups mobilizing in EU lobbying, the Transparency Register offers a number of advantages. First, the number of interest groups is substantially higher than in the previous official registers, such as CONNECCS and the EP door pass register, which were biased toward EU-level organizations with a Brussels presence to an extent that the Transparency Register is not. Second, even if commercial registers (e.g. Dods’ ‘European Union and Public Affairs Directory’) contain a high number of actors, their disadvantage is that it is not clear what the criteria for inclusion are, and many of the included actors may not be actively lobbying the EU (Greenwood, Reference Greenwood2011). Third, the number of actors examined here is substantially higher than the number of actors in the first studies of the EU population of groups (Berkhout and Lowery, Reference Berkhout and Lowery2008, Reference Berkhout and Lowery2010; Messer et al., Reference Messer, Berkhout and Lowery2011). It is even somewhat higher than in a data set constructed by Wonka et al. (Reference Wonka, Baumgartner, Mahoney and Berkhout2010), if we exclude the actor types in this data set, which we do not classify as interest groups. Fourth, compared with Wonka et al. (Reference Wonka, Baumgartner, Mahoney and Berkhout2010), using the Transparency Register has the advantage that we can link membership of the advisory committees of the Commission to a data source in which exactly those actors in regular contact with the Commission are supposed to register. The Commission’s official policy is specifically to use this register as a basis for its different contacts and activities (European Commission, 2009). This means that actors with an interest in participating in its various consultative mechanisms should be particularly likely to register here. The Wonka et al. data set is older and compiled actors from different registers (the 2008 register of EP door pass holders and the 2007 CONNECCS database – both of which were biased toward EU-level organizations to an extent that the Transparency Register is not – and the 2007 commercial Landmarks European Public Affairs Directory). Fifth, as already mentioned, the reviews of the functioning of the Transparency Register do not point to a lack of registration of the different types of interest groups analyzed here but of other types of actors not included in our analysis (European Commission, 2009; ALTER-EU, 2012). Lack of registration would mainly be an issue for us if we suspected systematic variation between our groups in whether registered groups from a given category (e.g. business, trade unions, public interest groups) had a higher or lower likelihood of being granted access than non-registered groups from the category. If, for example, both registered business and trade unions have a higher likelihood of being granted access than non-registered business and trade unions, that would not affect relative differences in the likelihood of getting access between them. We do not have reason to expect that there should be such systematic differences. Any advantages enjoyed by registered groups should apply equally to groups no matter what group type, geographical scope, etc., they represent. Finally, the advantage of the Transparency Register is that it contains more information than any other data source regarding the variables of interest in our study. Had we used the mentioned Wonka et al. (Reference Wonka, Baumgartner, Mahoney and Berkhout2010) data set, we would not have had access to such background information about the actors and could also not easily have obtained it from website coding of the actors, as some of the types of information used here (e.g. information on lobbying budget) cannot typically be found online.
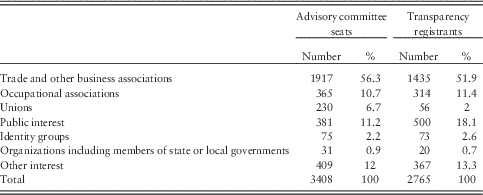
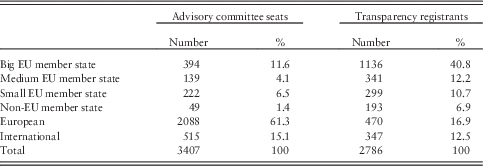
Tables 1 and 2 provide an overview of the two data sets with respect to group type and geographical origin. When comparing seats (as opposed to unique actors) on advisory committees, we see that business dominance in the Transparency Register is clearly reflected and even somewhat reinforced in the distribution of advisory committee seats. Moreover, there is a strong representation of organizations with a European and international scope in the committees over those with a national scope, irrespective of EU member state size or status.
Group types

Geographical scope

The next step is to predict whether interest groups in the Transparency Register (a) hold advisory committee seats and (b) how many seats they hold. In this analysis, the n is the total number of interest groups downloaded from the Transparency Register, that is, 2786 groups. We carefully compared interest group members from the two data sets to determine which actors from the Transparency Register held advisory committee seats. This involved not only matching groups by names in the two databases, but carefully searching for different versions of the name (sometimes in different languages) plus organizational abbreviations. Moreover, before doing so it was necessary to first reduce the interest group names in the advisory committee register to unique names.Footnote 10
The first type of analysis uses logistic regression, as our dependent variable is dichotomous. Altogether 403 groups of the 2786 groups in the Transparency Register were represented in one or more advisory committees and these groups held a total of 2036 seats out of the 3442 interest group seats in the advisory committee database. The second type of analysis uses negative binomial regression, as our dependent variable is a count. The number of seats of the groups in the Transparency Register ranges from 0 to 451, with a mean of 0.73 seats and a standard deviation as high as 9.81. Only three outlying organizations have more than 100 seats. Including them in the analysis would mean that all predictions in the upper range would include a high degree of uncertainty, therefore we have decided to exclude them from the analysis. This still results in an over dispersed dependent variable with a standard deviation of 2.48 and a mean of 0.46, therefore we use negative binomial regression rather than Poisson regression.Footnote 11 In subsequent regressions, we use counts for the number of advisory committee seats in the areas of DG Health and Consumer Protection and DG Enterprise and Industry. These are the DG areas with the highest number of advisory seats held by the examined organizations from the Transparency Register.Footnote 12 This allows us to test our prediction that the distribution of access between group types varies between a traditional non-business and business policy area. Finally, we test whether our conclusions are robust to controlling for the ‘time horizon’ of a committee by conducting separate regressions for seats on permanent and temporary advisory committees.Footnote 13
Our models contain the following independent variables. First, the substantive type of interest represented by interest groups was coded using a modified version of Schlozman et al.’s (Reference Schlozman, Verba, Brady, Jones and Burch2008) coding scheme (see online Appendix 2). Both the Transparency Register and the European Commission’s expert database include codes for interest group types, but they are crude and not compatible between the two databases. However, the advantages of using the modified Schlozman et al. scheme is that it classifies actors according to the substantive types of interests that they represent, which is one of the key dimensions of bias discussed here. Instead, the transparency coding scheme is much cruder and less detailed and pools several types of substantive interests under its main headings (see online Appendix 1).Footnote 14 Second, actors registering in the Transparency Register classify themselves, which sometimes results in errors, many of which can be avoided when using a professional coder with knowledge of interest group research.
In addition, we coded the country of origin of all interest groups and classified groups representing a supranational scope as either European or international. Finally, we included information from the Transparency Register about the lobbying budget of the organizations. Groups have the option of entering information about their lobbying budget in the Transparency Register stating the (1) minimum amount used, (2) maximum amount used, and/or (3) absolute amount used. Based on this information, we created a variable for lobbying budget that equaled (1) the absolute amount if groups had provided such a Figure, (2) the average between the minimum and maximum listed if both were provided, (3) the minimum amount if only a minimum amount was stated, and (4) half of the maximum amount if only a maximum amount was stated (assuming that the minimum amount was 0 in these cases). Altogether information about lobbying budgets was available for 2411 of the groups in the Transparency Register. We divided this variable by 10,000. Thus, the range is from (Euro 10,000) 0 to 862.5, with a mean of 11.93 and a standard deviation as high as 32.39.
Generally, information on lobbying budgets is very difficult to collect using alternative sources, such as website coding. The transparency figures are based on the groups’ own registration of the amount of money spent on lobbying. This involves a certain risk of misreporting similar to when groups are asked to provide budgetary information in interest group surveys. As a result, we cannot exclude that there are errors of course, but we do not have reason to think that misreporting should be systematic. In addition, the information of the Transparency Register is subject to regular quality checks by the European Commission (2013), and according to the Commission itself well over 1000 quality checks have been performed to date. It should be noted, however, that of the 2411 groups for which we have information about income, only 16 scored above one million euros. Because these extreme values are likely to be the result of mistakes in the data entering process and are likely to bias our results, we have decided to exclude these cases from the analysis.
Analysis
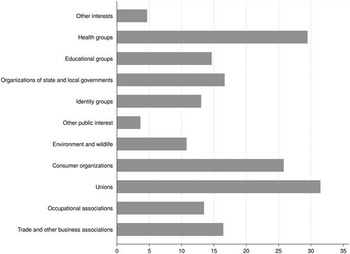
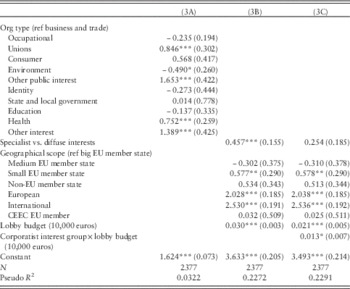
Our first predictor of access was group type. Contrary to the conventional wisdom and our prediction in Hypothesis 1a, model 3A shows that business groups do not inevitably have a higher chance of being selected to advisory committees than other group types. Business groups are significantly more likely to get access than environmental interests (but only at the 0.10 significance level) and other public interests (at the 0.01 level), but they are less likely to receive access than, for example, health organizations. Figure 1 illustrates the differences in the predicted probability of being represented for different group types in more detail. In many cases, the identified differences between group types are not statistically significant (Table 3).
Predicted probability of having seats on advisory committees by group type (model 3A).

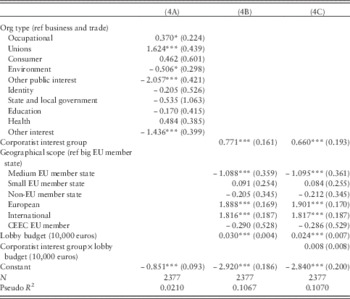
Logistic regression predicting access

Standard errors in parentheses.
*P<0.10, **P<0.05, ***P<0.01.
In the subsequent model 3B, we group the different group types into specialist interest groups composing trade and business, occupational associations, unions, and organizations representing regional and local government, whereas all remaining groups are placed in the diffuse category. The logged odds of being represented are 58% higher for specialist interest than for diffuse groups. However, it is interesting to know that this difference does not first and foremost arise from a business advantage, as trade unions are the group type with the highest probability of all being granted access.
In the second part of the analysis, we replicate these steps in an analysis in Table 4, which, rather than examining the chance of being represented, predicts the actual number of seats held by groups. The results are generally in line with the results of the logistic regression. We see that business groups do not generally dominate in number of seats over other group types, but that there is an overall advantage for specialist, as opposed to diffuse, interest groups. In addition to unions, occupational associations also contribute to the specialist group advantage here by having a higher number of seats than business groups.
Negative binomial regression predicting number of advisory committee seats

Standard errors in parentheses.
*P<0.10, **P<0.05, ***P<0.01.
In sum, and contrary to the expectation in Hypothesis 1a, the selection procedures to advisory committees do not systematically prioritize business over other actors, despite the regulatory character of the EU. The fact that business groups account for the largest share of seats on advisory committees in Table 1 is likely to be related to the fact that there is a high number of business groups engaged in EU lobbying in the first place. At the same time, our findings do not indicate that groups representing diffuse interests (such as public and identity groups) lead the game despite the Commission’s policy aimed at mobilizing exactly such interests. When it comes to being selected, the traditional interest groups representing specialist interests have priority. Business groups form part of this category. However, interestingly, the advantages enjoyed by specialist groups as a whole do not primarily result from a privileged position enjoyed by business itself but by some of the other specialist types of interest groups.
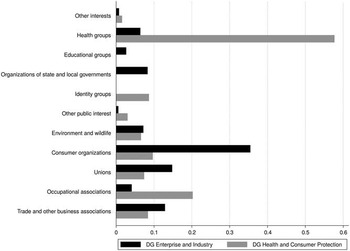
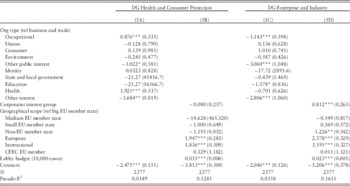
Next, we have run two additional negative binomial models for the areas of DG Health and Consumer Protection and DG Enterprise and Industry in Table 5 to test our prediction that the relative degree of access enjoyed by specialist and diffuse groups depends on the policy area of activity. Figure 2 displays the predicted counts of advisory committee membership for different group types in the two jurisdictions based on models 5A and 5C. Not surprisingly, we see a strong presence of health groups in the jurisdiction of DG Health and Consumer Protection, whereas business groups, unions, and organizations of state and local government play a strong role in the DG Enterprise and Industry area. Overall, these findings confirm the expectation in Hypothesis 1b that the policy area affects whether business groups enjoy an advantage. Moreover, when looking at specialist vs. diffuse groups in models 5B and 5C, we see that specialist groups have a significantly higher count of seats in advisory committees within DG Enterprise and Industry, but that the opposite does not hold. Rather than diffuse interests dominating the jurisdiction of DG Health and Consumer Protection, there is no significant difference between specialist and diffuse interests in this area.
Predicted count of seats on advisory committees by DG area and group type (models 5A and 5D).

Negative binomial regression predicting number of advisory committee seats on advisory committees per DG

Standard errors in parentheses.
*P<0.10, **P<0.05, ***P<0.01.
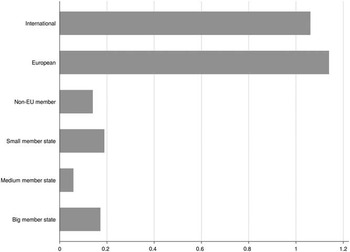
The next predictor of access considered is the level of geographical domain. In line with our expectation in Hypothesis 2a, we detect a strong advantage for groups representing a supranational scope in all our models. The models in Table 3 indicate that the odds for European and international groups of being represented on advisory committees are >650% higher than for groups from big member states. In addition, the predicted counts of seats for groups with an international or European scope in Figure 3 calculated based on model 4B is more than five times higher than groups representing any other geographical domain. Finally, the results for the individual policy areas in Table 5 confirm this pattern.
Predicted count of seats on advisory committees by geographical scope (model 4B).

At the same time, the results in Table 3 show that groups from big member states are not more but less likely to be represented than those from smaller ones against what we expected in Hypothesis 2b. In line with this, Table 4 shows that organizations from big member states do not have more seats than small ones, whereas they have a smaller advantage over those from medium-sized member states. Finally, contrary to the predictions in Hypothesis 3, we find no significant differences between organizations from new Central and Eastern European member states and other organizations when it comes to getting access to advisory committees in our models.
In sum, geographical scope is clearly a factor that matters for the Commission when granting access. One of the ideas of the founding theories of European integration, neo-functionalism, was that – over time – national-level interest groups would wither away as national citizens would shift their loyalties to the European level and be represented by European groups only (Haas, Reference Haas1958). Looking at the organizational landscape of the groups in Table 2, this has clearly not been the case. A high number of national groups are engaged in EU policy and listed in the Transparency Register. However, in accordance with the spirit of neo-functionalism, these national-level organizations are strongly disadvantaged over the supranational in the selection processes. Moreover, even if organizations from big member states might offer some of the same transaction cost savings for the Commission as Euro groups by representing a high number of citizens, their role is much more marginal and they are not advantaged over those from smaller countries. What counts for the Commission is whether groups can claim to represent a broader European interest. Finally, the low number of advisory committee members from the new Central and Eastern European member states is more likely to reflect the low number of active organizations from this region in the first place than a lack of prioritization of these countries by the Commission.
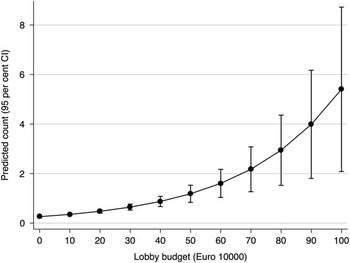
The size of the lobbying budget is our third predictor of access and has a highly significant effect in all our regressions in line with the expectation in Hypothesis 4a. According to model 3B in Table 3, an increase in the lobbying budget of an organization of 10,000 euros increases the logged odds of being represented by 3%. Moreover, Figure 4 illustrates how an increase in an organization’s lobby budget affects the predicted number of seats on advisory committees based on the results in model 4B in Table 4. However, we see that even if the lobbying budget clearly matters, it takes a relatively big increase in an organization’s lobbying budget to increase the predicted count of seats, especially for organizations with a relatively low lobbying budget.
Predicted count of seats on advisory committees by lobby budget (model 4B).

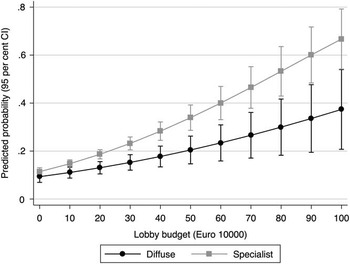
Our next step is to examine whether the effect of the lobbying budget is conditional upon group type, in line with what we expected in Hypothesis 4b. Model 3C finds some evidence that it is. The interaction effect is significant (P=0.057) with the expected direction. This indicates that specialist interests profit more from their lobbying budget when it comes to securing access than diffuse interest groups. In order to illustrate this relationship in more detail, we plot the predicted probability of having access by group type for different levels of the organizational lobbying budget in Figure 5. We see that, apart from lower levels, specialist groups are generally more likely than diffuse groups to be granted access for a given budget level. Moreover, we also see that a given budget rise increases the predicted probability of getting access more for specialist than diffuse interests. This gives leverage to the idea that specialist groups may be more dependent on budgetary resources when seeking access to advisory committees than diffuse interests. The latter may be able to capitalize on their privileged position as providers of political support and legitimacy to the Commission’s policies.
Predicted probability of having seats on advisory committees for different group types by lobby budget (model 3C).

In line with this, we also see that the coefficient indicating whether the effect of an organization’s lobbying budget on the predicted number of seats is conditional on group type in model 4C is positive in line with our expectations in Hypothesis 4b. However, in contrast to what we saw in the logistic regression, the interaction between group type and lobby budget is not significant here.
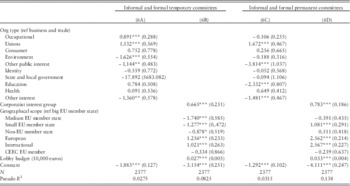
In a final set of regressions in Table 6, we examine whether there is a difference between potential biases in committees with different ‘time horizons’. We find some smaller differences in the access of different interest group types between models 6A and 6C: occupational groups have a significantly higher and environmental groups have a significantly lower number of seats than business groups on temporary committees, whereas educational groups are disadvantaged on the permanent ones. Rather than reflecting a preference for having specific group types on permanent and temporary committees, these differences are also likely to reflect variation in the usage of these types of committees between the policy jurisdictions in which these groups are active. At the same time, there are also similarities in the access patterns to permanent and temporary committees, for example, the trend for unions to have a higher and for ‘other public’ and ‘other interest groups’ to have a lower count across the two types of jurisdictions. Moreover, in models 6B and 6D, we also see that the effect of corporatist group type and lobbying budget is positive and significant in both areas.
Negative binomial regression predicting number of advisory committee seats on temporary and permanent advisory committees

Standard errors in parentheses.
*P<0.10, **P<0.05, ***P<0.01.
The main differences in access patterns to permanent and temporary committees relate to the geographical scope of the groups. Whereas groups from small member states have a significantly lower number of seats than those from big ones on temporary committees, the opposite pattern is found on the permanent ones. Moreover, compared with a group from a big member state, the predicted count of seats for a European and international group increases by a factor of 3.51 and 2.78, respectively, on temporary committees, whereas it increases by a factor of 12.96 and 13.02, respectively, on permanent ones. It is noteworthy that the Commission’s access policy allocates groups representing a supranational scope the strongest privileges on the committees, which can be expected to be the most attractive ones as a result of their long mandate.
Discussion
Inferences on bias in interest group access at the national and international level are typically drawn without a clear benchmark of assessment owing to a lack of valid data on the set of interest groups. By linking two new data sets on registered EU interest groups and membership of the advisory committees of the European Commission, we tackle this challenge in a study of selection effects to advisory committees.
On the one hand, our findings reinforce many of the ‘conventional wisdoms’ with regard to bias in access. The policy advisory committees of the European Commission do not consist of an equal number of different types of substantive interests and different interest groups do not have an equal chance of getting represented. Exactly as we would expect interest groups with large lobbying budgets and those representing specialist, material – as opposed to diffuse – public interests have a higher likelihood of being selected to advisory committees. This result holds no matter whether we look at access in general or the actual number of seats on the advisory committees.
On the other hand, our approach also provides a number of new findings, which nuance the conclusions in the existing literature. First, we see that the heavenly chorus is somewhat more diverse than often portrayed. In fact, the advantage of specialist interest groups is not first and foremost a ‘business advantage’. Business groups are not generally privileged over other group types as the literature suggests. The advantage of specialist groups as a whole is, not least, a result of the prominent role played by specialist groups other than business, especially trade unions. It is likely that the relatively low number of these types of interest groups in the population as a whole might act as a comparative advantage for them when it comes to securing representation. Future research should therefore explore the potential link between competition at the group type level and selection to advisory committees further by disaggregating the data down to more specific group types and issue niches.
Second, we also find considerable variation between policy areas in the relative importance of business groups specifically and specialist groups more generally in line with what pluralist disturbance theory would expect. It reminds us of the classical lessons from the public policy literature that policy areas inhibit different degrees of conflict and controversy, which may affect the type and number of mobilizing interests (Lowi, Reference Lowi1972; Wilson, Reference Wilson1974). At the same time, the existing research on bias in access has only devoted limited theoretical and empirical attention to how the character of policy affects mobilization of different group types (for an exception see Rasmussen and Carroll, Reference Rasmussen and Carroll2013).
Third, it is clear that a number of other factors play a role in securing access in addition to ‘the usual suspects’ discussed. In line with the Commission’s official policy, actors representing a supranational scope have a strong advantage, whereas the differences in access of national groups from countries of different sizes were more modest. This illustrates how the character of the ‘exchange relations’ between political institutions and interest groups is not simply one where all groups compete openly against each other, but one where the ‘rules of the game’ are shaped by the political institutions. Moreover, we see that the advantage of supranational actors is strongest in exactly the kind of committees that may be the most prestigious ones as a consequence of their long mandate, that is, the permanent ones. Future research on bias in access should explore ‘the institutional component’ of the exchange relation further by conducting comparative analysis of selection effects in different institutional systems at the national and international level.
Finally, our findings provide some preliminary evidence that the resource exchange between groups and political institutions may be a rather sophisticated one that works differently for different group types. It is interesting that even if the size of the lobbying budget affects the access of both specialist and diffuse groups, the former were able to capitalize more on a given lobbying budget than diffuse groups for getting access. These findings provide grounds for further exploration of the potential conditioning effect of group type on the effect of resources in subsequent theory building and empirical research on interest group access.
Future research should scrutinize our findings when the information in the existing registers of interest group populations and advisory committee membership are extended and subjected to additional reliability checks. Such studies should also extend our approach by examining the link between the structure of interest group population dynamics and access in other venues. Even if advisory committees play a key role, they are of course only one of the arenas in which interest groups participate in policy making. Finally, new data sets should be built that will allow us to examine the relationship between not only the structure of interest group populations and ‘access’ but actual ‘policy influence’.
Acknowledgement
The authors acknowledge financial support from the Montesquieu Institute in the Netherlands for data gathering and wish to thank the student assistants who participated in the coding of organizations. Finally, they are grateful to the participants in the workshop on “Interest Group Influence in an Era of Multi-Level Governance and Mediatization” at the 2012 ECPR Joint Sessions in Antwerp and four anonymous referees for comments on earlier drafts.
Supplementary material
To view supplementary material for this article, please visit http://dx.doi.org/10.1017/S1755773914000228