American voters have traditionally been required to cast their ballots at a designated polling place on a specific Tuesday, with some states allowing absentee mail voting if an individual was out of town or in some way incapacitated. Today, by contrast, American states and counties are increasingly allowing citizens to vote in ways other than at polling places on election day. Americans can vote over a period of days or weeks, in ways as diverse as at grocery stores in Nevada, curbside in Texas, by mail in the days or weeks leading up to the election, or at the polling place on election day. These “convenience” reforms, including early voting and election day registration, are thought to increase participation by decreasing the costs and increasing the convenience of casting a ballot. The continued expansion of these reforms suggests a perception that they are successful.Footnote 1
One prominent reform, adopted in 32 states, is “at-will” absentee voting, which allows citizens to choose to receive a mail ballot rather than vote at a polling place on election day (Larocca and Klemanski Reference Larocca and Klemanski2011). However two other states, Oregon and Washington, have moved entirely to all-mail elections: voters can only cast ballots by mail, thus ending the institution of polling place elections. All-mail elections offer an automatic reminder to citizens about the upcoming election—all active registrants are automatically mailed a ballot from their local elections official—and the registrant may vote at home at a time of their choosing and simply deposit the ballot in the mailbox at their own residence.Footnote 2 But all-mail elections are somewhat unusual compared to other reforms like at-will absentee voting because they also take away a voting option by eliminating the polling place. All-mail elections may therefore reduce turnout compared to at-will absentee voting.
For example, some citizens may prefer (or may only be mobilized by) the social experience of the polling place; recent research on turnout shows that the social dimension of politics is an important motivator to participate.Footnote 3 Campaigns may also have an easier time mobilizing turnout on election day.Footnote 4 Finally, the secrecy and accurate counting of mailed ballots may concern others and lessen interest in participation (Southwell and Burchett Reference Southwell and Burchett1997; Gerber et al. Reference Gerber, Huber, Doherty, Dowling and Hill2013). Overall, in light of these competing arguments, the effect of all-mail elections on turnout is uncertain.
Apart from the net effect of all-mail elections on overall turnout, an additional question is about what sort of citizens are affected by this reform. Prior research suggests that the move to all-mail elections, and convenience reforms more generally, may exacerbate the gaps between high- and low-participation groups. Berinsky (Reference Berinsky2005), for example, argues that these reforms increase turnout more for higher socio-economic status citizens, who already participate at high rates, than for low-participation segments of the population.
In this article, we assess the impact on turnout of moving to all-mail elections. The Washington State legislature authorized counties to hold all-mail elections in 2005 at each county's discretion. In contrast to previous analysis of the switch to all-mail elections in Oregon, where the entire state switched at once, we exploit variation in when Washington counties switched to all-mail in order to distinguish election-specific effects on turnout from the all-mail effect on turnout. We find that switching to an all-mail election increases aggregate turnout in Washington counties by two to four percentage points, depending on the election type. In an individual-level analysis, we show that all-mail elections in Washington increase participation more among registrants who rarely vote than among registrants who often vote.
This article makes two key contributions. First, we provide novel evidence about the effects of a large-scale move to all-mail elections. We use both aggregate and individual-level data to estimate a within-state, cross-election design with county fixed effects (a differences-in-differences approach). This distinguishes our work from prior research that examines the effects of small-scale local changes to the costs of voting that are generally experienced only by a small segment of the population (for example, polling place consolidation or shifting individual precincts to voting by mail). It also distinguishes our work from prior research that measures the effect of statewide shifts in voting rules, which makes it difficult to distinguish the effect of other factors (for example, election-specific factors) from the effect of the policy reform itself. With this design, we provide estimates of the effect of changing to all-mail elections that are less vulnerable to the threats to inference in existing work.Footnote 5
Secondly, we use the Washington State voter file to construct across-time panel observations of individual registered voters. This panel lets us track the behavior of polling place and absentee voters as their counties switch from mixed elections to all-mail elections. It is an innovative approach to studying an institutional reform's potentially heterogeneous effects across citizens that uses the full set of registered voters as the study population, rather than a public opinion sample.Footnote 6 Using this design, we provide new evidence that a large-scale shift to voting by mail does not appear to advantage groups that previously participated at higher rates. Instead, we estimate larger effects of moving to all-mail elections on the turnout rates of occasional voters and those who have never participated. Thus this reform does appear to modestly reduce turnout inequality between high- and low-participation groups.
We proceed by first describing the uncertain state of current estimates about the influence of all-mail elections on turnout. We then discuss our research design, which exploits the staggered implementation of all-mail elections in Washington State. After presenting county- and individual-level results, we conclude.
Convenience Reforms, Voting by Mail and Participation
Election administrators’ decisions can have important effects on who participates in, and even on who wins, elections.Footnote 7 A large body of research considers the effects of different convenience voting reforms—from election day registration to all-mail elections—on turnout and partisan outcomes.Footnote 8 These studies generally find that convenience reforms that increase opportunities for citizens to register or cast ballots have modest positive effects on turnout. Recent research has begun to use more innovative strategies to identify the effects of changes in transaction costs.Footnote 9 Interest in the effects of mail voting increased after Oregon began experimenting with all-mail elections in the mid-1990s and moved completely to all-mail elections after a statewide initiative in 1998.Footnote 10 A precursor to the Oregon studies looked at all-mail elections held in California, Oregon and Washington municipalities in the early 1980s (Magleby Reference Magleby1987).
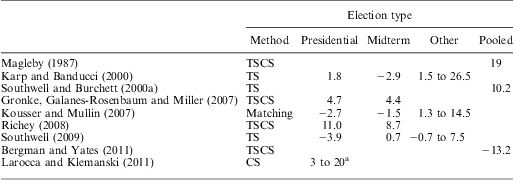
Measuring the direct effects of all-mail elections in Oregon is generally conducted by comparing turnout in Oregon elections held prior to the switch to all-mail elections with turnout in Oregon elections held after the switch. Different methods have been used to distinguish the effects of the switch to all-mail elections from other factors such as election-specific factors (for example, the quality of the candidates in a race) or changes in the composition of the electorate.Footnote 11Table 1 presents point estimates of the direct effect of all-mail elections on turnout across the published studies. Effect sizes range from −13 percentage points to more than 25 percentage points, depending on the election type and design.
Existing Estimates of All-Mail Effects on Turnout
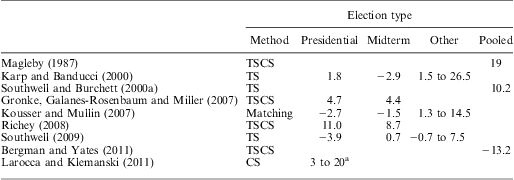
a = depends upon election year and demographic mediators.
CS = cross-section; TS = time-series; TSCS = time-series, cross-section.
While the early work of Magleby (Reference Magleby1987) estimated a large positive effect of all-mail elections on turnout in federal and local elections, more recent studies of all-mail elections in California find negative consequences for turnout in even-year primary, presidential and midterm elections (Kousser and Mullin Reference Kousser and Mullin2007; Bergman and Yates Reference Bergman and Yates2011) but a positive effect on turnout in local elections (Kousser and Mullin Reference Kousser and Mullin2007).Footnote 12 These studies estimate the effect of small-scale, precinct-level changes in institutions that may not extrapolate to county- or state-wide changes.
In addition to measuring the direct effect of all-mail elections on turnout and other outcomes, scholars have asked which citizens these reforms mobilize. Berinsky, Burns and Traugott (Reference Berinsky, Burns and Traugott2001) find that all-mail elections in Oregon increase the probability that previous voters will participate in subsequent elections, but do not increase the participation rates of previous non-voters. They conclude that all-mail elections increase the retention of habitual voters but do little for non-voters.Footnote 13
The literature as a whole is mixed on the presence of heterogeneity in response to all-mail elections. Some research finds no variation by demographics in the effect of all-mail elections on turnout (Magleby Reference Magleby1987; Southwell and Burchett Reference Southwell and Burchett2000b); some findings echo Berinsky, Burns and Traugott (Reference Berinsky, Burns and Traugott2001) (Karp and Banducci Reference Karp and Banducci2000); and still others find that all-mail elections mobilize lower-participating groups in some models and high-participating groups in others (Larocca and Klemanski Reference Larocca and Klemanski2011).
In summary, the existing literature on the effect of all-mail elections is heavily focused on the Oregon case, with point estimates of the direct effect of all-mail (and heterogeneity in the effect) varying across studies and designs. We argue that much of this instability is due to basic issues of research design. Comparing elections in Oregon before and after the change to all-mail voting to identify the effect of the change does not hold all else constant. Specifically, these designs cannot measure all election-specific influences on state-level turnout that change at the same time as the institutional reform.Footnote 14
We attempt to overcome this identification problem with observations from Washington State. Washington moved to all-mail elections county by county rather than as an entire state. This staggered implementation means that for each election held after 2005, some counties voted all-mail while others continued to offer polling places, with state-level election factors held constant. We measure the effect of all-mail elections while accounting for election-specific influences on turnout using a differences-in-differences approach, which we present formally in the appendix.Footnote 15
All-Mail Voting in Washington State
We investigate the effects of all-mail elections in Washington State. Beginning in 1967, elections in precincts with fewer than 100 voters could be conducted entirely by mail at each county's discretion, and by 2002 five rural counties (of 39 total counties) were conducting all-mail elections by drawing all of their precincts below the threshold. In 2005 the state passed legislation allowing each county, with the permission of both the county auditor and the county commission or council, to conduct all-mail elections regardless of precinct size. Twenty-three counties became all-mail immediately after the 2005 legislation, joining the original five rural counties. This left 11 counties with polling places in 2005. Six additional counties moved to all-mail voting in 2006, leaving only five counties holding polling place elections in the 2006 midterm election—Island, King (Seattle), Kittitas, Klickitat and Pierce (Tacoma). Island, Kittitas and Klickitat moved to all-mail in 2007 and 2008, and King moved to all-mail in 2009, leaving only Pierce County using polling places in 2010. In April 2011, the governor signed SB 5124 into law, which required all elections to be held all-mail.Footnote 16
Even before 2005, most Washington voters chose to cast ballots by mail, with more than half voting by mail in the 2000 presidential election and more than two-thirds voting by mail in the 2004 presidential election.Footnote 17 A key contribution of our investigation is to formally account for the citizens who were already taking advantage of all-mail elections, noting that the effect of the institutional shift may be moderated by the number of citizens who were already voting by mail. We exploit variation in both when Washington counties switched to all-mail and in the proportion of voters in each county already voting absentee prior to the shift. We estimate two separate quantities in this study: (1) the net effect of the switch to all-mail elections, which is the effect of the switch on total county turnout and (2) the effect of the reform on turnout by polling place voters (the individuals affected by the switch). The latter effect should be of larger magnitude than the former in counties that already had a notable proportion of the population voting by mail.
As with any design that takes advantage of the choice to change an institution (for example, comparing Oregon to other states, or certain precincts to others), one important concern is about the reliability of our estimates.Footnote 18 For example, suppose that county officials experiencing increases in participation chose to move to all-mail elections. In that case, the estimate of all-mail would be biased upward by a reform enacted in reaction to a trend in turnout. We argue that exploiting the staggered reform at the county level in Washington breaks the correlation between state-level election characteristics that often motivate marginal changes in turnout and the timing of reform implementation. In light of concerns about county-level factors that might affect both turnout and the move to all-mail elections, we have also examined the robustness of our results in models that attempt to account for the potential correlation between changes in turnout and the adoption of all-mail elections. Those results (for example, accounting for factors that explain the timing of the choice to adopt all-mail elections, excluding early adopting counties, and accounting for lagged county turnout) are reported in the appendix and are very similar to the estimates we report below.
The Effect of All-Mail Elections: County Results
We first investigate the effect of the switch to an all-mail election on total county turnout. We consider turnout in presidential, midterm and odd-year elections in Washington State from 1996 to 2010.Footnote 19 Our dependent variable is turnout as a proportion of registered voters, which varies in even-year elections from 61.5 percent (Cowlitz County, 1998) to 82.2 percent (Chelan County, 2000), and in odd-year elections from 31.4 percent (Clark County, 2003) to 74.2 percent (Garfield County, 2005).Footnote 20 Odd-year elections in Washington have both local issues and, when present, statewide initiatives. Statewide executive officers are elected in presidential years; midterm elections in our sample include state legislative contests in each election and US Senate races in 2010, 2006 and 1998 (but not 2002).
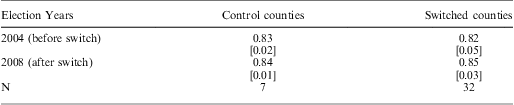
For our first analysis, we compute a non-parametric differences-in-differences estimate. Table 2 presents change in turnout in counties that do and do not switch. We compare average turnout in the 2004 presidential election, before the state law allowing all-mail elections, to turnout in the 2008 presidential election, after the law. The columns present average turnout in these two elections for the seven counties that maintained the same institutional status in these four years (five counties were all-mail and two counties maintained polling places in both elections) to the 32 counties that changed to all-mail elections after the 2005 legislation. Turnout is a simple average of county averages, not weighted by population or votes cast.
Average Turnout in Washington Counties that Switched and Did Not Switch to All-Mail Voting after the 2005 Legislation
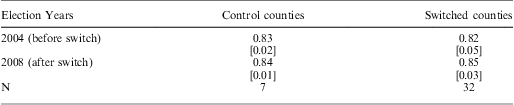
Note: cell entries are average turnout in row election year and column treatment status. Standard deviation of turnout within election year and treatment status in brackets. Turnout increases more in counties that switched to all-mail than in counties that did not switch. Coefficient and standard error on all-mail in differences-in-differences regression: 0.022 (0.016).
Table 2 shows that average turnout increased from 2004 to 2008 in both sets of counties. However the increase in turnout is larger in the 32 counties that switched from polling place elections to all-mail elections. Turnout in control counties increased one percentage point from 83 percent in 2004 to 84 percent in 2008, while turnout in switched counties increased three percentage points from 82 percent to 85 percent. In the absence of confounding, the difference of these two differences is an estimate of the treatment effect of switching to all-mail elections, which this analysis suggests is a boost to countywide turnout of two percentage points. We next turn to regression models that use all elections in all counties to estimate the effect of all-mail elections with more statistical control. All of these more complicated models estimate a more flexible version of the differences-in-differences reported in Table 2.
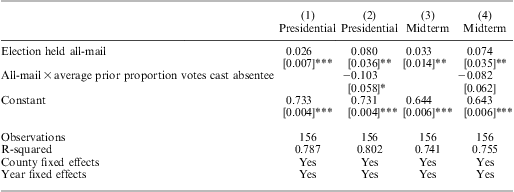
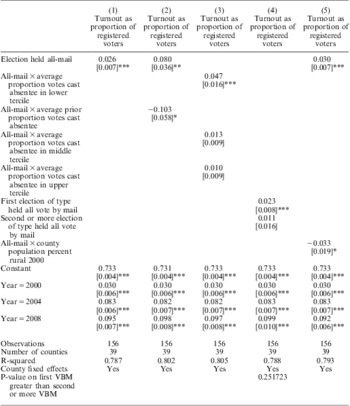
Expanding our analysis to include all elections in all counties in our set of observations, we present regression models in Table 3 that model county turnout separately for presidential and midterm elections across Washington's 39 counties.Footnote 21 We present a formal description of our specifications, and the connection to estimates of causal treatment effects, in the appendix.
County Turnout Models
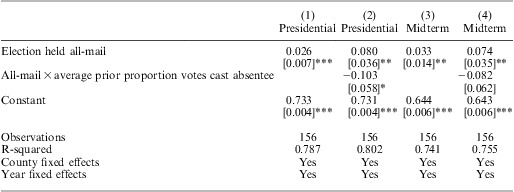
Note: robust standard errors in brackets. Standard errors in all models clustered on the county. Turnout measured as proportion of registered voters. **significant at 5%; ***significant at 1%.
Columns 1 and 3 are a basic model of turnout with election-year and county fixed effects and an indicator for whether that election was held all-mail. Robust standard errors across models are clustered by county because treatment is applied at the county level; the clustering helps alleviate a problem with differences-in-differences models that identify too many false positives (Bertrand, Duflo and Mullainathan Reference Bertrand, Duflo and Mullainathan2004). The all-mail coefficients in the basic models suggest that turnout increases in all-mail elections by 2.6 points in presidential years, 3.3 points in midterm years and 3.8 points in odd-year elections (see Appendix Table A3); each result is significant from 0 at p < 0.01. With election-year fixed effects, these estimates are potentially conservative and attenuated because so many counties switched to all-mail in the same year (2005).
In Columns 2 and 4, we include the all-mail indicator as well as an interaction of that indicator with the average proportion of the county votes that was cast absentee in the two elections of the same type prior to the switch to all-mail. This interaction generates a negative coefficient in each election-type model: higher prior absentee rates decrease the (positive) effect of switching to all-mail elections. The coefficient on the all-mail indicator in these specifications measures something similar to a treatment effect on the treated, rather than the intent-to-treat effects estimated in Columns 1 and 3. These results suggest that all-mail elections would increase turnout for registrants who would not vote by mail if merely given the option (rather than being required to do so) by 8.0 points in presidential elections and 7.4 points in midterm elections.
In summary, our county-level models show that all-mail elections increase total turnout in Washington State counties by about three percentage points in presidential, midterm and odd-year elections.Footnote 22 We estimate a marginal effect of about seven points for the polling-place voting population in federal elections, a number that we return to below in our individual-level analysis.
We turn now to the construction of our individual-level panel dataset from the Washington State voter files. This panel allows us to support our proposed mechanism for the county-estimated effects above and assess heterogeneity in the treatment effect across the eligible population.
Polling Place Voters and Heterogeneous Effects: Individual-Level Results
For our individual models, we first show that the pattern of coefficients supports our proposed mechanism—that the reform had a greater effect on those previously voting at the polling place than those already voting by mail—to support our county-level results. We then estimate heterogeneity in the all-mail effect by sub-groups of the population.
Our individual models consider only the counties that switched to all-mail elections after 2006, because the statewide voter file is most accurate beginning with this election.Footnote 23 Our cases therefore come from four of the five counties that held elections in which voters cast ballots at polling places in 2006: Island, King, Kittitas, Klickitat and Pierce. We drop Kittitas from the analysis because the number of by-mail voters reported in the voter file diverges substantially from the number of absentee votes reported in the county aggregate records, which suggests that the by-mail status recorded in the voter file for Kittitas may be inaccurate. By contrast, the data on mode of voting in the voter file closely match the official county totals for the other four counties. While we have no reason to believe that the effects of moving to all-mail elections in these counties are not representative of the effects in the entire state, we note this potential limitation.Footnote 24
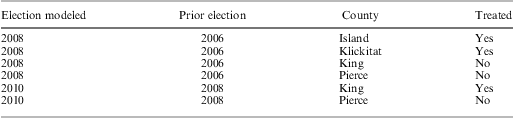
We begin with models that estimate the treatment effect of all-mail elections pooled across counties and elections. We summarize the source counties and elections used in this model in Table 4. We model turnout in either 2008 or 2010, depending on when the county switched to all-mail. The 2008 turnout cases are registrants from Island and Klickitat Counties, which switched to all-mail between 2006 and 2008, along with registrants from King and Pierce Counties, which continued to hold polling place elections in 2008 as control cases. The 2010 turnout cases are treated registrants from King County, which switched to all-mail between 2008 and 2010, and control registrants from Pierce County, which continued to hold polling place elections in 2010. We stack these two elections together so that the dependent variable is turnout in the first election after the switch, taking a value of 1 for a vote in 2008 or 2010 and 0 otherwise. King County registrants thus enter the sample as control cases in 2008 and as treated cases in 2010.
Source Counties and Elections for Stacked Individual Regression Models
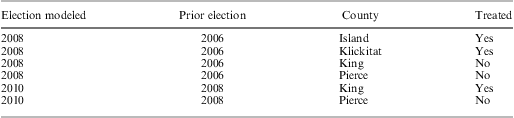
Note: election modeled is the election for which turnout is the dependent variable. Prior election is the election for which registration at the polling place is measured.
In all cases, measurement of the polling place status of the registrant in the election before the switch in treated counties and prior to the non-switch in control counties is taken from a voter file produced before the institutional change (that is, pre-treatment). We indicate these elections in the second column of Table 4. We allow for precinct-election specific effects on turnout through precinct-election fixed effects.Footnote 25 This allows each precinct in each election to have a separate baseline level of turnout, thereby accounting for any underlying precinct-election factors (for example, local campaign activity or context). We interact all covariates with the election whose turnout is being modeled, and cluster all standard errors on the county-election intersection (for example, King in 2008 separately from King in 2010), which is the level at which treatment is applied.
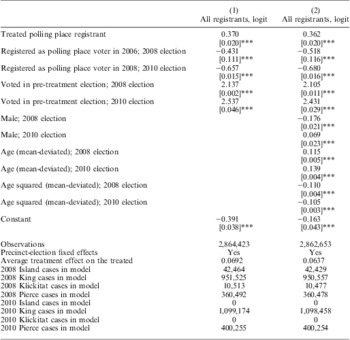
In Table 5, we present results of our basic individual-level models. The number of cases from each county election is noted in the final rows of the table. We present two different specifications using a logit model, with and without individual covariates. In each column the coefficient for the treatment effect is presented in the first row. The variable indicates that the registrant was registered as a polling place voter in the pre-treatment election (2006 for 2008 turnout cases and 2008 for 2010 turnout cases) and resides in a county that switched to an all-mail election in the post-treatment election (Island or Klickitat for 2008 turnout cases, King for 2010 turnout cases). We present the estimated average treatment effect on the treated population at the bottom of the table.Footnote 26 We control for being registered to vote at a polling place in the pre-treatment election with the indicator variables in rows two and three. These variables allow us to estimate a different effect of being previously registered to vote at a polling place on turnout in 2008 and 2010.
Individual Models of Turnout

Note: logit models of individual turnout. Cell entries are coefficient estimates with standard errors in brackets. All models include precinct-election fixed effects (note the filters described in the text). Final rows count the number of cases from each election and county. Standard errors in all models clustered on the county election. Robust standard errors in brackets. ***significant at 1%.
Recall that the county-level models shown in Table 3 (Columns 2 and 4) estimated a marginal effect of all-mail elections on previous polling place voters of about seven percentage points using aggregate data. Using these individual-level data, in Table 5 we estimate effects of 6.9 points without covariates (Column 1) and 6.4 points with covariates (Column 2). These estimates are based on the individual turnout records of 2.9 million Washington registrants in the four counties for which we have data to estimate individual effects. The similarity of the aggregate- and individual-level estimates suggests that individuals who previously voted at the polling place were more affected by this institutional change than those who last voted by mail. (The average effect of the move to all-mail elections is absorbed into each precinct-election fixed effect). It also suggests that these four counties are reasonably representative of the state as a whole. Using this same sample, we next turn to estimating heterogeneous treatment effects across sub-sets of the population.
Previous research suggests that all-mail elections are more likely to increase the retention of citizens who are already likely to vote, while doing little to increase turnout for those who are unlikely to vote (Karp and Banducci Reference Karp and Banducci2000; Berinsky, Burns and Traugott Reference Berinsky, Burns and Traugott2001). Others find important variation in the effect of voting reform by residential stability and age (Larocca and Klemanski Reference Larocca and Klemanski2011). We use our individual-level voter file data and staggered institutional design to identify heterogeneity in the effect of instituting all-mail elections.
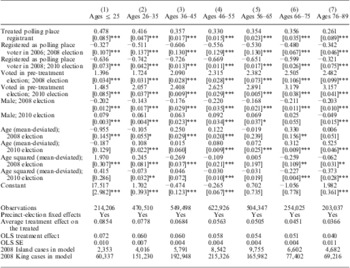
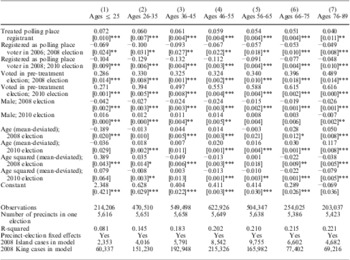
We consider heterogeneous effects by two individual characteristics. First, we examine variation in the treatment effect of all-mail elections by age of registrant, following on the findings of Berinsky, Burns and Traugott (Reference Berinsky, Burns and Traugott2001) and Larocca and Klemanski (Reference Larocca and Klemanski2011). We do not find any statistically significant differences across groupings of age in 10-year bins, and so present these results in Appendix Tables A7 and A8. We do note, however, that point estimates suggest treatment effects are larger for the youngest registrants and decrease in size for the oldest registrants. Though some have suggested that mail elections hurt turnout for the less residentially stable compared to the more residentially stable because mail ballots must find their way to the appropriate physical address (Larocca and Klemanski Reference Larocca and Klemanski2011, 82), we find the largest treatment effect for the youngest group of voters and the smallest effect among older citizens, but this difference is not statistically significant at p < 0.05.
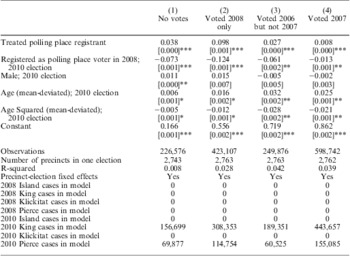
Secondly, we allow the treatment effect of moving to all-mail elections to vary by the prior vote history of individual registrants. These results provide stronger evidence that all-mail elections in Washington State increased the turnout of low-participation citizens more than they did for high-participation citizens, contrary to the estimates of Berinsky, Burns and Traugott (Reference Berinsky, Burns and Traugott2001). To measure heterogeneity with respect to individual propensity to participate, we model the effect on 2010 turnout for King and Pierce County registrants only. We limit the analysis to this sample because we want a longer history of prior election turnout behavior. We use general election turnout in the 2008, 2007 and 2006 elections to partition the sample into four categories of increasing participation: those who voted in none of the three elections, those who voted only in the 2008 presidential election, those who voted in the 2006 midterm but not the 2007 odd-year election, and those who voted in at least the 2007 odd-year election.Footnote 27
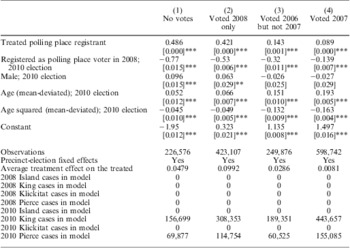
Table 6 presents logit models with precinct-election fixed effects partitioned by pre-treatment prior vote history. As before, the treatment effect is identified by previous polling place registrants in counties that switched to all-mail and previous polling place registrants in counties that did not. In Table 6, each comparison is within that partition of the population.Footnote 28
Heterogeneous Individual-Level Treatment Effects

Note: logit models of individual turnout. Cell entries are coefficient estimates with standard errors in brackets. All models include precinct fixed effects (note the filters described in the text). Standard errors in all models are clustered on the county election. Vote history is partitioned by general election votes in 2006, 2007 and 2008, modeling 2010 turnout in King and Pierce Counties only. Final rows count the number of cases from each county election used in each specification. Robust standard errors in brackets. **significant at 5%; ***significant at 1%.
We find the largest treatment effect of all-mail elections on 2008-only presidential voters.Footnote 29 Per Column 2, the average treatment effect on the treated of moving to all-mail elections is 9.8 points for individuals registered to vote at a polling place in 2008. The second-largest effect is among the least-likely participants: the treatment effect estimate is 3.8 points for those with no record of having voted in any of the three elections (Column 1). The effect is 2.7 points for midterm voters (Column 3) and near 0 for those who voted in 2007 (Column 4). Each of these differences is statistically significant at p < 0.05. Overall, we find that the switch to all-mail elections in King County had almost no effect on habitual participants who had been voting at the polling place prior to the switch, a result that contrasts with arguments that all-mail elections increase participation more in high-participating groups (Berinsky, Burns and Traugott Reference Berinsky, Burns and Traugott2001; Berinsky Reference Berinsky2005).
In summary, the evidence from Washington suggests that all-mail elections increase turnout most among groups that are less likely to participate. We have suggestive evidence that this is true for young voters, and direct evidence that registrants with little or no prior vote history are more likely to vote when their county switches to all-mail elections.
Discussion
In this article, we present evidence that moving to all-mail elections—in which all registered voters are automatically mailed a ballot, there are no polling places and voting is principally conducted by mail—increases aggregate turnout by two to four percentage points in the presidential, midterm and odd-year elections following the switch from traditional polling place elections with liberal absentee voting rules. Among individuals registered to vote at a polling place prior to the switch, turnout increases by around seven percentage points. We show that this increase in turnout is more pronounced among registrants who are not habitual voters, suggesting that this institutional reform may reduce differences in participation between high- and low-participation groups. The estimated increase in turnout is also larger for younger registrants, although differences in the effects of moving to all-mail elections across age groups are not statistically significant.
In order to estimate the effect of moving to all-mail elections, we use a differences-in-differences approach that exploits the staggered implementation of this institutional reform by Washington State counties. Because this design allows us to account for both county- and election-specific influences, we believe it provides a more accurate estimate of the effect on turnout of adopting all-mail elections on turnout than is provided in previous studies. While others have found point estimates of the effect of all-mail elections on turnout in Oregon and California ranging from negative 10 or 15 points to positive 25 points depending upon election type, we find consistent results across election types using both individual (voter file) and aggregate (county returns) data. We also estimate, again in contrast to other work, heterogeneous treatment effects that suggest a positive effect on participation for groups that are less likely to vote otherwise. This institutional reform seems to increase participation across the population, but more so among those who were previously participating at lower rates, despite the fact that it eliminates the opportunity for traditional polling place voting.
While our analysis of Washington State's staggered implementation of all-mail voting has treated this reform as a quasi-experiment, it is not immune to the serious limitations of observational work. We now discuss those potential limitations, noting that these types of concerns are present in all observational work. We have assumed as-if random assignment of when counties switch their elections to all-mail, conditional on the election and county fixed effects in our models. Because counties were able to move to all-mail voting at their discretion, it is possible that the decision to hold all-mail elections is correlated with unobservable factors that also affect turnout, and that our estimate of the effect of holding all-mail elections on turnout is therefore biased. To account for this selection, we have estimated models with county fixed effects, which hold constant all time-invariant county characteristics. We also estimated models with prior mail voting rate, with lagged turnout, with measures of county factors that predict the timing of the move to all-mail voting and on counties that did not change their institutions at times other than those offered by the legislature. In each case, we find similar results. Nonetheless, because it is impossible to rule out some heretofore unidentified source of variation in both turnout and voting rules, caution is fully justified.
Although our results differ from those found in research that studies the effect of California's all-mail precinct institution, which suggests that all-mail voting depresses turnout, the divergent results are not necessarily incompatible. It is possible that when an entire county moves to all-mail elections, as in Washington, get-out-the-vote organizations and campaigns adjust their activities to the new institution. In California, by contrast, when only a few voters in a few precincts were assigned to vote by mail, organizations (and even election officials) may not effectively target these registrants. Consequently, in the absence of a full county switch to all-mail, California registrants in the all-mail precincts may not have received the information they needed to cast their votes.Footnote 30 Thus our results do not necessarily refute the existing evidence from California. However, it may be misleading to use results from California precincts to estimate the effect of whole counties or states switching to all-mail elections. For policy makers considering a move to all-mail elections at the county level, our results imply that turnout would increase modestly; the size of those effects would depend on how many citizens already avail themselves of a voluntary option to vote by mail.
More generally, our results suggest that all-mail elections may be an effective way to increase turnout among registrants who have not historically participated as much as others. When estimating heterogeneity in the treatment effect, we find the largest effect of switching to all-mail elections on presidential-only voters, and the second-largest effect on registrants who had not previously cast a ballot. We find almost no effect on voters who had habitually participated in recent elections. These results imply that the positive turnout effects of all-mail elections may outweigh the loss of the social experience of polling places and the ability of campaigns to manage election day mobilization. Finally, additional evidence from other places and times that adopt this reform would allow more robust measurement of the potential gains in participation that may follow implementation of all-mail elections.
Identification Strategy
Because not all counties in Washington switched to all-mail elections in the same year, a reasonable way to estimate the effect of the switch is by using a differences-in-differences approach, which compares control counties that did not switch their institution to treatment counties that did switch. The comparison is made both in the election prior to the switch and in the election after the switch.
Our differences-in-differences design exploits variation across Washington State counties in when each county shifted to holding its elections all-mail. We first model county turnout in each election as a function of county- and election-specific shocks, along with an all-mail status indicator. Letting Yij measure turnout in county i in election j, then:
 $${{Y}_{ij}}\, = \,{{\alpha }_j}\, + \,{{\delta }_i}\, + \,\gamma {{x}_{ij}}\, + \,{{{\epsilon}}_{ij}},$$
where αj is the election-specific intercept, δi is the county-specific intercept that does not vary by election (allowing each county to have higher or lower average turnout separate from the institutional switch), xij is an indicator taking the value of 1 if county i held an all-mail election in election j, and εij is a county-specific shock in election j. Our interest focuses on the parameter γ, which captures the effect of holding an all-mail election on turnout averaged across the elections and county shifts observed in the data.
Our estimate of γ is unbiased under standard econometric assumptions. County and election fixed effects account for any county- or election-specific correlation with the introduction of all-mail across counties and elections. Bias occurs if, on average, xij is correlated with εij, the county-election specific shock. The county-election shock is the set of factors specific to each county in a specific election that is not measured by our explanatory variables or state-level election factors.Footnote 31 We discuss and undertake efforts to assess several potential sources of bias in our empirical sections.
In a second county-level model, we expand our specification to more closely measure the effect of a move to all-mail elections. Residents of Washington State had the option of voting by mail before their county moved to all-mail elections. For those already voting by mail, the institutional reform is potentially irrelevant, while for those voting at the polling place, the reform changes the costs and benefits of casting a ballot. The effect of a move to all-mail elections, then, should vary with the proportion of the county electorate already voting by mail before the switch to all-mail elections. In this specification,
 $${{Y}_{ij}}\, = \,{{\alpha }_j}\, + \,{{\delta }_i}\, + \,\gamma {{x}_{ij}}\, + \,\beta {{x}_{ij}}{{v}_i}\, + \,{{{\epsilon}}_{ij}},$$
where vi measures the average proportion of votes cast by mail in the two elections prior to the switch to all-mail elections. Through the interaction of vi and xij (the latter indicates whether an election is held all-mail), the parameter β modifies the effect of γ by the proportion of the electorate that previously voted by mail. We expect β to be the opposite sign of γ, attenuating the effect on turnout of adopting all-mail elections as the proportion voting by mail vi in prior elections increases. In this specification, γ is an estimate of the effect of moving to an all-mail election on county turnout if, in the two elections prior to the switch, 0 percent of the electorate voted by mail (vi = 0).Footnote 32 We assume that the prior proportion voting by mail, vi, has no direct effect on subsequent turnout except through the holding of an all-mail election.Footnote 33
An unbiased estimate of γ and β in Equation A2 again requires (on average) zero correlation between xij and εij, but also requires (on average) zero correlation between vi and εij. The assumption of no correlation between the prior vote-by-mail rate and the county-election shock may be violated if mobilization drives differentially target newly all-mail counties based on their prior absentee rate or if all-mail elections mobilize absentee voters at a different rate than all-mail elections mobilize polling place voters.Footnote 34
Individual-Level Identification Strategy: Which Voters are Affected?
We model the effect of all-mail elections at the individual level by observing the turnout choices of registered citizens recorded in the statewide voter file across elections. Our approach again follows the basic logic of differences-in-differences. We start with an individual-level behavioral model in which turnout for individual k in election j is a function of election- and individual-specific factors. We estimate the effect on turnout of moving to all-mail elections for individuals who were previously registered to vote at the polling place, the population we study.Footnote 35
In this case, those registered to vote by mail prior to the switch to mandatory all-mail voting form our control group, while those registered to vote at the polling place prior to the switch are our treatment group, which allows a within-county estimate of the effect. This specification thus estimates the change in turnout for those previously registered to vote at the polling place relative to those who were previously registered to vote by mail. If the institution does not affect those who were previously registered to vote by mail, as it might be reasonable to assume, the treatment effect is the total effect of forcing polling place voters to vote by mail. If there is some effect on those previously registered to vote by mail, the estimated treatment effect is the net effect relative to the effect on those previously registered to vote by mail.
More specifically, we model individual turnout as a function of the county in which each registrant resides, whether or not each registrant was previously registered to vote by mail or at the polling place, the interaction of this previous behavior with the all-mail status of the county, and individual covariates such as age and previous voting history. Formally, the turnout behavior  $$${{Y}_{kj\ell }}$$$
(1 = yes, 0 = no) for individual k in election j in county
 $$$\ell $$$
is:
 $${{Y}_{kj\ell }}\, = \,{{\alpha }_{j\ell (k)}}\, + \,\delta jvkj\, + \,\gamma {{v}_{kj}}{{x}_{j\ell (k)}}\, + \,{{\beta }_{{\mib{j^{\prime}}}}}{{{\mib{z}}}_{\mib{k}}}\, + \,{{{\epsilon}}_{kj}},$$
where  $$${{\alpha }_{j\ell (k)}}$$$
is a county-election shock for each county in each election,
 $$$\ell (k)$$$
returns the county
 $$$\ell $$$
of voter k, vkj is an indicator taking the value of 1 if registrant k in election j registered to vote at the polling place in election j − 1,
 $$${{x}_{j\ell (k)}}$$$
is an indicator taking the value of 1 if individual k ‘s county
 $$$\ell $$$
held an all-mail election in election j, z k is a vector of individual covariates, and εkj is an individual election shock to turnout for k in j.
Using logit and OLS regression, we estimate parameters γ, δj and  $$${\bibeta_{\bi j}}$$$
, along with fixed effects
 $$${{\alpha }_{j\ell (k)}}$$$
; γ is our parameter of interest: the average effect on turnout for individuals who are registered to vote at the polling place in election j − 1 and who reside in a county holding an all-mail election in election j. This quantity captures the difference-in-difference relative to registrants who were previously registered to vote by mail. δj is the difference in turnout in election j between those who previously registered to vote at a polling place and those who previously registered to vote by mail independent of the county's all-mail status, and β j is an incidental vector of election-specific coefficients. This specification allows turnout to vary by county x election, by whether the citizen registered to vote at the polling place or to vote by mail, by the interaction of the citizen's mail registration and the county's institution, and by individual covariates such as age.
Appendix Tables and Figures
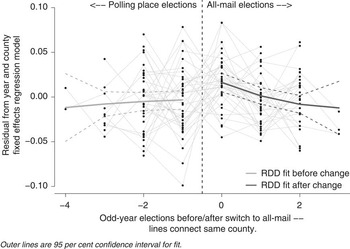
In Appendix Figure A1, we plot odd-year turnout across the switch to all-mail elections. Each point measures residual turnout in a county in an election year; the residual is taken after a regression of county turnout on year and county fixed effects. This residual, therefore, is the variation in turnout not accounted for by election- or county-specific factors. This figure may underestimate the effect of the switch to all-mail elections because so many counties switched in the same election year (and thus that year's fixed effect may pick up much of the shift in turnout). The x-axis plots the number of elections since the switch so that 0 is the first election held all-mail, +1 is the second election held all-mail and −1 is the last election held with polling places. Lines and confidence intervals are fitted values from a regression discontinuity fit with polynomial power two. The plot shows an increase in turnout in the first odd-year election held all-mail relative to the last election held at the polling place, with some evidence of decay in the effect.
Residual county turnout before and after switch to all-mail (odd-year elections) Note: each point represents one county in one election; the y-value is the residual turnout from a regression of turnout on election-year and county fixed effects; the x-value is the number of elections before or after that county switched to all-mail elections, with year 0 the first odd-year election held all-mail.

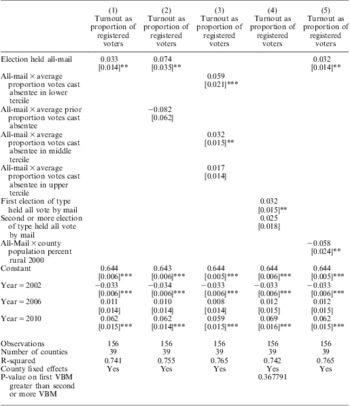
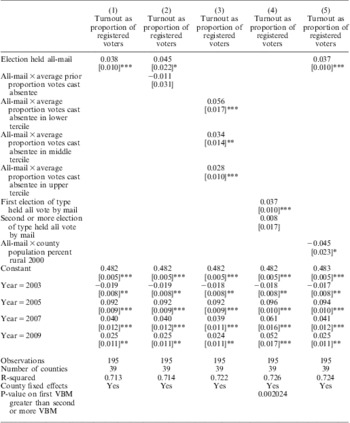
In Appendix Tables A1, A2 and A3, we present full specifications and results for county turnout models. The models in Columns 1 and 2 in each table correspond to the two models presented in Table 3 for presidential and midterm elections. In Column 3 of each table, we present a specification in which the all-mail indicator is interacted separately with indicators for the tercile of average prior absentee rate across counties in the first election of that type held all-mail: bottom third, middle third and top third. This approach allows a separate estimate of the all-mail effect for counties with low, middle and high absentee vote rates prior to each switch, relaxing assumptions about linearity and monotonicity. Results are consistent with the more basic linear model, with the largest effect in the lowest tercile and the smallest effect in the highest tercile. For example, in Table A1, Column 3, the coefficient of 0.047 means that counties in the lowest third of absentee vote rate prior to switching to all-mail experienced a 4.7 percentage point increase in turnout when they switched to all-mail elections. In contrast, we estimate that counties in the middle third of absentee rates experienced an increase of 1.3 points, and counties in the highest third an increase of 1.0 points. We estimate similar patterns of higher effect in lower absentee counties for midterm and odd-year elections. Differences between the bottom tercile and top tercile are statistically significant for midterm and presidential elections (p < 0.05).
County Models of Turnout (Presidential Elections)

County Models of Turnout (Midterm Elections)

County Models of Turnout (Odd-Year Elections)

In the fourth column in each table, we present specifications to estimate decay in the all-mail effect, which has been described as the novelty effect of convenience voting reforms (Gronke, Galanes-Rosenbaum and Miller Reference Gronke, Galanes-Rosenbaum and Miller2007, 642). Instead of the single all-mail indicator taking on the value of 1 for any election held all-mail, we specify two variables that measure the first election (of that type) held all-mail, and a second indicator for all subsequent elections (of that type) held all-mail. We find some evidence of a novelty effect: in each election type, the first all-mail election coefficient point estimate is larger than the second-and-later coefficient. We estimate that the first election held all-mail increases turnout by 2.3, 3.2 and 3.7 percentage points in the presidential, midterm and odd-year elections, respectively, while subsequent elections held all-mail increases turnout by 1.1, 2.5 and 0.8 points. Due to the recency of the reform, however, we have few observations of second-and-later all-mail elections. The difference in the coefficients on first and subsequent all-mail elections is only significant in Table A3 for odd-year elections, as indicated by the p-value at the bottom of the column. Overall, we do find suggestive evidence of a novelty effect, but lack the data to have strong confidence in the result.Footnote 36
Selection
To investigate the selection mechanism, we report here four results. First, we modeled when each county switched to all-mail elections. We find that prior absentee rate is a strong predictor of the switch in the absence of election fixed effects but that it goes away with election fixed effects (since most counties switched in 2005), and that the percentage of the population that is rural predicts a switch even in the presence of election fixed effects (results are available from the authors on request).
Secondly, we present in Column 5 of Tables A1 to A3 models that interact all-mail elections with the proportion of the county's population that is rural as measured by the 2000 census. Proportion rural was the county characteristic most closely related to the early switch to all-mail elections, and so potentially confounded with the treatment effect.Footnote 37 The estimated treatment effect does not differ substantially.
Thirdly, we estimated robust models of the county-level results limiting the analysis only to counties that switched to all-mail elections after the 2005 legislation. This model drops from analysis counties that had redrawn precincts prior to 2005 in order to have de facto all-mail elections. These models, available from the authors on request, estimate similar effects to those above. Fourthly, we present a plot of turnout across the discontinuity in Figure A1 for odd-year elections. This plot shows little evidence of a large increase or decrease in turnout in counties prior to the switch, suggesting that our result is not driven by election administrators implementing all-mail elections in response to a surge or decline in county turnout.
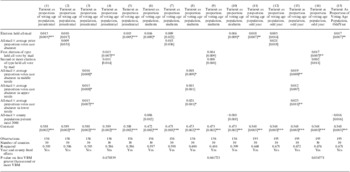
To add robustness to the conclusions we present above, we present two alternative regression models in Tables A4 and A5. We first show that our results are robust to measuring turnout as a proportion of the voting age population to address concerns that the result may be due to changes in the size of the registered voter population. If county election officials made greater efforts to purge their registration lists of old records with the move to all-mail elections, the effect we identify for turnout as a proportion of registrants could be due to removing non-voters from the rolls without any additional votes being cast: a smaller denominator increases the size of the ratio even if the numerator is held constant. In Table A4, we change the dependent variable from that presented in Tables A1 to A3 to measure turnout as a proportion of each county's voting age population.Footnote 38 These specifications show that the effect of the all-mail reform is not caused by a change in the number of registered voters, the denominator of the turnout ratio.
County Models of Turnout as a Proportion of Voting Age Population

Lagged County Turnout Models

Although the coefficients in Table A4 are smaller than those in our main results tables, this is to be expected because adding counts of unregistered citizens inflates the denominator of the dependent variable without changing the numerator of votes cast. In fact, if we deflate the three coefficients from Column 1 of Tables A1, A2 and A3 (0.026, 0.033 and 0.038) by the average ratio of registrants to voting age population in Washington counties in the year prior to their shift to vote by mail (0.74), we get coefficients of 0.019, 0.024 and 0.028, roughly similar to the estimated coefficients. These numbers do not add up exactly because of variation across counties in the ratio of registrants to the voting age population. In regression models not presented, we predict registrant counts as a proportion of voting age population using the same explanatory variables as in Columns 1 and 2 of Tables A1–A3. This varies in 2010 from a low of 48 percent registered in Franklin County to a high of 89 percent registered in San Juan County. Only one of the nine all-mail coefficients is statistically different from 0 at 10 percent confidence: we estimate a 1.1 percent decline in registration rate in odd-year elections for the first election held all-mail. All other magnitudes are less than 1 percent and are smaller than their standard errors, with the mean effect in even-year elections of −0.3 percent.
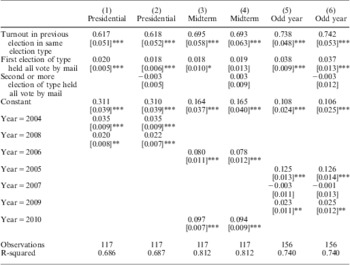
To address concerns about serial correlation in the time-series residuals, we present in Table A5 models that control for lagged overall turnout instead of including county fixed effects. For each set of models, we find results that are similar to the models that use county fixed effects.
Finally, in Tables A6, A7 and A8, we present models of heterogeneous treatment effects for prior vote history estimated using OLS and models of heterogeneous treatment effects by age of registrant estimated using logit and OLS.
Heterogeneous Treatment Effects at the Individual Level (OLS Vote History)

Individual-Level Heterogeneous Treatment Effects (Logit Age)

Individual-Level Heterogeneous Treatment Effects (OLS Age)