Introduction
Studies have repeatedly indicated that co-morbidity among common mental disorders can be understood in terms of broad dimensions of psychopathology (Krueger & Markon, Reference Krueger and Markon2006). These dimensions have been demonstrated across multiple disorders (e.g. Krueger & Markon, Reference Krueger and Markon2006; Slade & Watson, Reference Slade and Watson2006) and cultures (Krueger et al. Reference Krueger, Chentsova-Dutton, Markon, Goldberg and Ormel2003), and have been extremely successful in accounting for relationships between psychopathology and other constructs (Krueger et al. Reference Krueger, McGue and Iacono2001), and in explaining the etiology of psychopathology (Kendler et al. Reference Kendler, Prescott, Myers and Neale2003).
Although successful, these models have been based on diagnoses that are assumed to be homogeneous. As the diagnoses may in fact be heterogeneous in nature (see e.g. Brown & Barlow, Reference Brown and Barlow2005; Clark, Reference Clark2005; Watson, Reference Watson2005; Widiger & Samuel, Reference Widiger and Samuel2005), it may be advantageous to examine symptoms, which are presumably more homogeneous. Existing symptom-level analyses of psychopathology structure have provided important insights, but have tended to focus on particular domains, such as classical Kraepelinian disorders or internalizing disorders. Here, in an attempt to integrate syndromal and symptom-level perspectives, the joint hierarchical structure of Axis I and II symptoms is explored. A model is presented that extends existing syndrome-based frameworks ‘downward’ as well as ‘outward’ by analyzing symptoms rather than syndromes, and by integrating various disorders in the same framework.
Syndrome-based models of psychopathology structure
The Internalizing–Externalizing (IE) model
The IE model (Achenbach, Reference Achenbach1966; Lahey et al. Reference Lahey, Applegate, Waldman, Loft, Hankin and Rick2004; Krueger & Markon, Reference Krueger and Markon2006) posits that psychopathology reflects two superordinate dimensions: internalizing and externalizing. Internalizing is distinguished by prominent problems with negative emotion, and influences liability to disorders such as major depression, generalized anxiety disorder, phobias, and panic disorder. Externalizing is distinguished by prominent problems with disinhibition, and influences liability to disorders such as substance abuse and dependence, antisocial personality disorder, and conduct disorder.
The Internalizing–Externalizing–Psychosis model
Although the IE model has proved successful in explaining relationships between mental disorders, it has been limited to relatively common forms of psychopathology. When severe psychopathology has been assessed with more common disorders, results have suggested that psychosis represents a third major form of psychopathology, distinct from internalizing and externalizing. Wolf et al. (Reference Wolf, Schubert, Patterson, Grande, Brocco and Pendleton1988), for example, demonstrated that schizophrenia forms a distinct third factor together with internalizing and externalizing. These findings suggest that certain forms of psychopathology cannot be easily explained within the IE framework, that the model needs to be expanded to explain severe mental disorder. The extent to which these results generalize is unclear, however, as other studies have found that psychosis acts as an internalizing disorder (e.g. Harkness et al. Reference Harkness, McNulty, Finger, Arbisi and Ben-Porath1999; Verona et al. Reference Verona, Sachs-Ericsson and Joiner2004).
Four-factor personality disorder models
Studies of Axis II co-morbidity have suggested that a common structural framework can account for diverse forms of personality pathology. Four traits seem to account for much personality pathology: a trait reflecting neuroticism or negative emotionality; a trait reflecting disagreeableness and related traits, such as aggression; a trait reflecting conscientiousness or lack thereof; and a trait reflecting extroversion, positive emotion, or lack thereof (O'Connor & Dyce, Reference O'Connor and Dyce1998). Personality disorders show predictable relationships with the Big Four personality traits (Saulsman & Page, Reference Saulsman and Page2004), and demonstrate a four-factor structure in their patterns of genetic and environmental relationships (Livesley et al. Reference Livesley, Jang and Vernon1998; Kendler et al. Reference Kendler, Aggen, Czajkowski, Roysamb, Tambs, Torgersen, Neale and Reichborn-Kjennerud2008).
Symptom-based models of psychopathology structure
Insight into how severe forms of psychopathology relate to more common forms of psychopathology can be found in broadband studies of symptoms conducted over past decades. Since the middle of the last century, numerous studies have examined factor structures of instruments designed to comprehensively assess symptoms of acute psychopathology. These instruments have varied in format, from self-report (e.g. Sheeran & Zimmerman, Reference Sheeran and Zimmerman2004), to informant-report (Wittenborn, Reference Wittenborn1951), to structured interviews (e.g. Spitzer et al. Reference Spitzer, Fleiss, Endicott and Cohen1967). Many have focused on classical Kraepelinian symptoms, such as mood and psychotic symptoms (e.g. Krabbendam et al. Reference Krabbendam, Myin-Germeys, De Graaf, Vollebergh, Nolen, Iedema and Van Os2004; Dikeos et al. Reference Dikeos, Wickham, McDonald, Walshe, Sigmundsson, Bramon, Grech, Toulopoulou, Murray and Sham2006), although other constructs have been examined, such as substance use symptoms (e.g. Sheeran & Zimmerman, Reference Sheeran and Zimmerman2004).
Despite significant variation in format, construct representation and era, the factor structures of these symptom measures are remarkably consistent. Some of the earliest studies, conducted during the DSM-I era (Wittenborn, Reference Wittenborn1951; Wittenborn & Holzberg, Reference Wittenborn and Holzberg1951; Lorr, Reference Lorr1957), report lower-level symptom factors that are strikingly similar to those conducted more recently during the DSM-IV era (e.g. Krabbendam et al. Reference Krabbendam, Myin-Germeys, De Graaf, Vollebergh, Nolen, Iedema and Van Os2004; Dikeos et al. Reference Dikeos, Wickham, McDonald, Walshe, Sigmundsson, Bramon, Grech, Toulopoulou, Murray and Sham2006). These factors also resemble those reported in structural analyses of co-morbidity (Slade & Watson, Reference Slade and Watson2006) and analyses of specific symptom domains (e.g. Zinbarg & Barlow, Reference Zinbarg and Barlow1996).
Higher-order structures have also been consistent. Lorr et al. (Reference Lorr, Klett and McNair1963), for example, reported higher-order factors resembling internalizing, mania, psychosis and hostility. Bedford & Deary (Reference Bedford and Deary2006) reported a similar three-factor structure, including internalizing, mania and psychosis.
Integrating syndrome- and symptom-based models of psychopathology structure
These two traditions, of syndrome- and symptom-based modeling, have been extremely useful and successful in explaining the broadband structure of mental disorder. Integrating the two traditions, in an approach where symptoms of various disorders are considered simultaneously, might provide links between the two literatures and help to clarify psychopathology structure. Here, in an attempt to integrate syndromal and symptom-level approaches, a ‘bottom-up’ hierarchical analysis was adopted, to characterize the joint structure of Axis I and II disorder symptoms. By focusing on symptoms rather than diagnoses, problems related to heterogeneity of diagnoses were amelioriated. Moreover, by examining symptoms across Axis I and II, it was possible to expand existing frameworks to forms of psychopathology that have not been considered together in symptom-level analyses. Understanding of factor structure was expanded ‘downward’ as well as ‘outward’ in this way by examining symptom structure in the British Office for National Statistics Survey of Psychiatric Morbidity (ONSPM; Singleton et al. Reference Singleton, Lee and Meltzer2002). This epidemiological survey is ideal for these purposes, as it is large, population representative, and relatively detailed in its level of assessment of symptoms.
Method
Sample
The purpose of the ONSPM was to examine the prevalence of, and risk factors for, various psychiatric problems among individuals living in private households (Singleton et al. Reference Singleton, Lee and Meltzer2002), and is part of a set of psychiatric epidemiological surveys conducted in Great Britain during recent decades (Jenkins et al. Reference Jenkins, Bebbington, Brugha, Farrell, Gill, Lewis, Meltzer and Petticrew1997).
Individuals in the ONSPM were recruited using a stratified multi-stage random probability sample strategy. Details regarding this strategy are available elsewhere (Singleton et al. Reference Singleton, Lee and Meltzer2002). Data on 8405 individuals were available for the current analyses; 44.7% were male, 55.3% were female, and the average age was 45.98 years, with a range of 18–74 years. In analyses of correlation matrices rather than raw data, a sample size of 7396 was used; this corresponds to the minimum sample size per covariance term, recommended for conservative inference in factor analysis (Enders & Peugh, Reference Enders and Peugh2004).
Measures
Participants were assessed by trained lay interviewers using computer-assisted structured interviewing (CAI). A small subset of participants (n=874) were followed-up with a second interview by clinicians using the SCID (First et al. Reference First, Gibbon, Spitzer, William and Benjamin1997) and SCAN (Wing et al. Reference Wing, Babor, Brugha, Burke, Cooper, Giel, Jablensky, Regier and Sartorius1990), in order to refine diagnostic algorithms used in the entire sample (e.g. to refine the assessment of psychosis). The present analyses are based on interviews conducted in the entire sample to maximize power and avoid difficulties in statistical analysis caused by selection procedures for follow-up interviews.
Instruments
Psychopathology was assessed in five areas: neurotic disorders, psychotic disorders, personality disorder, alcohol use problems, and drug use problems. Neurotic disorders were assessed using the revised version of the Clinical Interview Schedule (CIS-R; Lewis & Pelosi, Reference Lewis and Pelosi1990; Lewis et al. Reference Lewis, Pelosi, Araya and Dunne1992), which assesses various current symptoms of anxiety, fear, and depressive disorders. The CIS-R has been used in a variety of settings and has demonstrated validity in a large number of published studies (e.g. Connell et al. Reference Connell, Barkham, Stiles, Twigg, Singleton, Evans and Miles2007). Psychosis was assessed using the Psychosis Screening Questionnaire (PSQ; Bebbington & Nayani, Reference Bebbington and Nayani1995), which assesses psychotic experiences during the past year, has been used in a variety of studies (e.g. Johns et al. Reference Johns, Nazroo, Bebbington and Kuipers2002; Groom et al. Reference Groom, Bates, Jackson, Calton, Liddle and Hollis2008) and has demonstrated construct validity (Bebbington & Nayani, Reference Bebbington and Nayani1995; Johns et al. Reference Johns, Cannon, Singleton, Murray, Farrell, Brugha, Bebbington, Jenkins and Meltzer2004; Wiles et al. Reference Wiles, Zammit, Bebbington, Singleton, Meltzer and Lewis2006). Personality disorder was assessed using the SCID-II personality disorder screen (First et al. Reference First, Gibbon, Spitzer, William and Benjamin1997), a self-report measure of personality pathology that assesses disordered personality characteristics during the past several years. Alcohol use problems were assessed using the Alcohol Use Disorders Identification Test (AUDIT; Babor et al. Reference Babor, de la Fuente, Saunders and Grant1992) and the Severity of Alcohol Dependence Questionnaire (SAD-Q; Stockwell et al. Reference Stockwell, Murphy and Hogson1983). The AUDIT was developed as part of a collaborative multi-site World Health Organization (WHO) program, has been used in numerous studies, and has demonstrated good reliability and validity (e.g. Maisto et al. Reference Maisto, Conigliaro, McNeil, Kraemer and Kelley2000). The SAD-Q similarly measures alcohol dependence symptoms, has been used in numerous studies, and has demonstrated good reliability and validity (e.g. Stockwell et al. Reference Stockwell, Murphy and Hogson1983; Cooney et al. Reference Cooney, Meyer, Kaplan and Baker1986). Finally, drug use problems were assessed using items written for the Epidemiological Catchment Area Study (Robins & Regier, Reference Robins and Regier1991) and used in ONS studies. These items inquired about use of a wide variety of drugs during the past month, year, and lifetime, including cannabis, amphetamines, crack, cocaine, ecstasy, tranquillizers, opiates, hallucinogens, and solvents. Participants were asked about the frequency of use, subjective dependence on the substances, inability to stop using the substance, physiological tolerance, and physiological withdrawal. Further details regarding the measures are available in Singleton et al. (Reference Singleton, Lee and Meltzer2002).
Coding
To link instruments within a common symptom framework for analysis, variables were coded to assess individual DSM-IV criteria. Criteria included in analyses are presented in Table S1 (available as online supplementary material) and Table 3 (see also Singleton et al. Reference Singleton, Lee and Meltzer2002). In most cases, measures included pre-existing items or scales designed to measure specific criteria, and were used as indicators of those criteria (e.g. the CIS-R, which has scales targeting specific symptoms of mental disorder, such as concentration problems, irritability, and obsessions). In a few cases, however, items of instruments were recoded to capture symptoms (e.g. items of the CIS-R phobia subscale were recoded to assess individual DSM-IV criteria, as opposed to a single phobia dimension). Criteria were not duplicated. For example, ‘lacks close friends or confidants other than first-degree relatives’ appears as both Schizoid and Schizotypal Personality Disorder criteria; this criterion was included only once, and is listed in Table S1 (online), Table 3 and elsewhere as a Schizotypal Personality Disorder criterion. The number of possible responses varied by symptom; nearly all variables were treated as discrete, although a few count variables (e.g. number of phobic fears and antisocial aggression behaviors) had a sufficient number of possible responses to be treated as continuous. Among variables treated as discrete, the number of possible responses varied from two to eight.
Details of some symptoms are important to note. First, the elevated mood symptom of mania as assessed was not simply positive mood, but included the criteria that it had lasted for several days, had not been associated with any apparent cause, and others perceived it to be strange or complained about it. Second, because it is difficult to rule out medical explanations for somatic symptoms, the CIS-R does not inquire about such explanations in assessing somatic symptoms. However, participants were asked whether or not the somatic symptoms in question were ‘brought on or made worse’ because of ‘feeling low, anxious, or stressed’. As such, they were conceptualized as roughly corresponding to symptoms of Undifferentiated Somatoform Disorder or Somatoform Disorder Not Otherwise Specified (NOS).
Analyses
Analyses proceeded in two phases: an initial exploratory phase using exploratory factor analysis (EFA) and cluster-analytic approaches to generate candidate models, followed by a confirmatory phase using confirmatory factor analysis (CFA) to evaluate and compare models generated during the exploratory phase. Analysis proceeded in these two phases for both subordinate and superordinate structural analyses, to provide consistency in modeling strategy across levels of factor hierarchy. Analyses were conducted on pairwise-estimated polychoric–polyserial correlation matrices to avoid difficulty factors, which are spurious factors reflecting response frequency in categorical data. Factor models and polychoric–polyserial correlations were estimated using Mplus (Muthen & Muthen, Reference Muthen and Muthen2007), and other analyses were conducted using R (R Development Core Team, 2008).
Because the polychoric correlation matrix was non-positive definite, maximum-likelihood (ML) estimates could not be obtained using the raw matrix. Instead, following Yuan & Chan (Reference Yuan and Chan2008), smoothing was used to obtain a positive-definite matrix, and the resulting ML estimates and model selection statistics were corrected to account for the smoothing. The matrix was smoothed using a Ledoit–Wolf estimator (Ledoit & Wolf, Reference Ledoit and Wolf2004; see also Bickel & Levina, Reference Bickel and Levina2008), which estimates the population correlation matrix using the sample correlation matrix eigenvalues, corrected by estimated bias to account for non-positive definiteness. The Ledoit–Wolf smooth itself does not affect the rank ordering of likelihood-based statistics, which forms the basis of relative fit indices (e.g. the Bayesian Information Criterion; BIC). However, as it does overestimate fit reflected in absolute fit indices (e.g. the root mean square residual; RMSR), we adjusted such values by adding a small constant proportional to the magnitude of the smoothing correction (cf. Yuan & Chan, Reference Yuan and Chan2008). This effectively penalized absolute fit indices for the smoothing, providing a conservative estimate of absolute model fit.Footnote 1Footnote †
Exploratory analyses
Two forms of exploratory analyses were conducted: ML EFA and cluster analysis. EFAs were evaluated using the BIC and the bootstrap CNG (Cattell–Nelson–Gorsuch) scree test (Gorsuch & Nelson, Reference Gorsuch and Nelson1981; Gorsuch, Reference Gorsuch1983; Hong et al. Reference Hong, Mitchell and Harshman2006). The bootstrap CNG scree test formalizes Cattell's scree test in terms of the linear decrease in successive eigenvalues, where linear decrease is operationalized using successive triads of eigenvalues; bootstrap methods are used to evaluate the significance of drops in rate of eigenvalue decrease (i.e. provide significance levels for breaks in scree plots).
Cluster-based structure analyses were performed using Revelle's (Reference Revelle1979, Reference Revelle2007) ICLUST algorithm. ICLUST is a form of hierarchical cluster analysis, where indicators are clustered on the basis of internal consistency. Clusters are merged to the extent that doing so increases the general factor saturation and estimated reliability of the resulting higher-order cluster. ICLUST can be used to explore hierarchical factor structure, in that lower-order factors are assumed to reflect higher-order factors to the extent that their indicators all covary relatively extensively and homogeneously. Factor analysis in this sense can be thought of as identifying clusters of relatively homogeneous covariance structure. Cluster analysis has been used successfully in previous studies of psychopathology structure (e.g. Krueger et al. Reference Krueger, Markon, Patrick, Benning and Kramer2007). It is a useful complement to EFA in the delineation of factor structure, especially in the presence of hierarchy or highly correlated factors, where it often outperforms EFA in characterizing latent structure (Revelle, Reference Revelle1979; Bacon, Reference Bacon2001; Tate, Reference Tate2003; van Abswoude et al. Reference van Abswoude, Vermunt, Hemker and van der Ark2004).
Confirmatory analyses
Potential models identified during the exploratory phase were compared in a second, confirmatory phase. These models were also compared to a DSM-IV model, where symptoms were modeled as having loadings from factors representing their respective DSM disorders. Symptoms that are criteria for multiple DSM disorders were allowed to cross-load on those disorders, and DSM disorders represented by only one symptom had single loadings on that symptom fixed at one. Factors in this DSM model were allowed to correlate. All confirmatory models were estimated using ML structural equation modeling and compared using the BIC, RMSR and Comparative Fit Index (CFI).
Results
Subordinate structure
Exploratory analyses
EFA
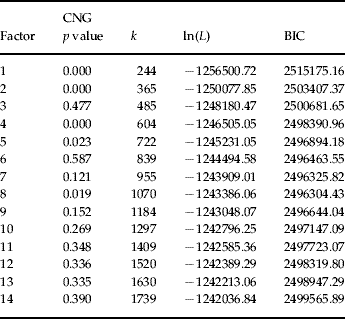
Model selection statistics, including BIC values for the EFA models and bootstrap CNG test p values, are presented in Table 1. Overall, both tests favored an eight-factor model. The bootstrap CNG scree test involves selecting the smallest significant eigenvalue; using a traditional 0.05 threshold, this would suggest eight significant components (p=0.019). The optimal, smallest BIC value was also associated with an eight-factor model (BIC=2496304.43).
Exploratory model selection statistics

k, Number of model parameters; ln(L), log likelihood; BIC, Bayesian Information Criterion.
p values reported are for the bootstrap CNG scree test, as described in the text.
Quartimin-rotated estimates from the eight-factor EFA suggested factors similar to those reported previously in the literature (see Table S2, online). The first factor reflected internalizing problems; the second, schizoid characteristics or introversion; the third, substance use problems; the fourth, antisociality; the fifth, alcohol use problems; the sixth, attention-seeking problems; the seventh, social anxiety or avoidance; and the eighth, inflexibility.
Cluster analysis
Because the choice of a stopping criterion was unclear in the present context, clusters were demarcated conservatively, using the following strategy: cut the clustering tree so as to leave the maximum number of clusters possible, subject to the condition that each cluster has at least two indicators (for factor identification purposes) and to leave as few ‘orphaned’ single indicators as possible. Clusters were also retained if they met the preceding conditions, and corresponded either to existing DSM constructs or to constructs identified in the EFAs. Following this procedure, if single orphaned indicators remained, they were assigned to clusters based on their largest correlation with an established cluster.
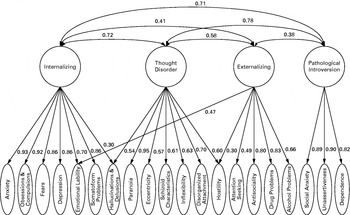
Using this procedure, 20 construct clusters were identified, along with 10 orphaned single indicators. Allocation of orphaned indicators to the 20 clusters using maximum correlations resulted in conceptually compelling assignments (e.g. the phobic fears criterion, an orphaned single indicator, was assigned to a cluster with the phobic avoidance criterion and the panic attack criterion). This resulted in a final set of 20 clusters (Table 3 and Fig. 1).
Path diagram for final full model. Lower-order and higher-order latent factors are shown; observed indicators and associated paths are not shown because of space constraints, and are presented in Table 3.

Many of the construct clusters resembled existing DSM diagnoses. For example, the Anxiety cluster comprised symptoms of generalized anxiety disorder, the Obsessions and Compulsions cluster corresponded to obsessive–compulsive disorder, the Drug and Alcohol Problems clusters reflected symptoms of drug and alcohol abuse and dependence, and the Antisociality cluster reflected antisocial personality disorder, including its conduct disorder criterion.
Other clusters reflected modified DSM constructs. For example, although the Fears cluster included symptoms of specific phobia, it also included symptoms of panic. The Depression cluster, similarly, included emotional and cognitive symptoms of major depression, but somatic symptoms clustered with those of somatoform disorder in the Somatoform Problems cluster. The Social Anxiety cluster comprises symptoms of avoidant personality disorder, specifically those involving social anxiety, together with the schizotypal personality disorder social anxiety criterion. The Unassertiveness cluster comprises symptoms of avoidant and dependent personality disorder involving reluctance, indecisiveness and lack of initiative. Finally, the Dependency cluster includes symptoms relating to fears of independence or relying on others to be responsible for one's affairs. Symptoms of borderline personality disorder, similarly, split into three clusters: Emotional Lability, Disorganized Attachment, and Attention Seeking. Although borderline impulsivity is included in the Attention Seeking cluster, most of that cluster's indicators are narcissistic and histrionic personality disorder criteria. The Attention Seeking cluster reflects attention seeking, melodramatic style, or pretensiveness, consistent with previous factor analyses of personality disorder criteria (e.g. Austin & Deary, Reference Austin and Deary2000; Nestadt et al. Reference Nestadt, Hsu, Samuels, Bienvenu, Reti, Costa and Eaton2006).
Confirmatory analyses
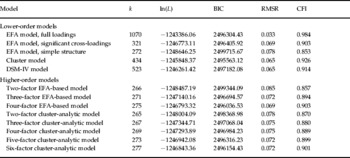
The results of confirmatory analyses are shown in Table 2. Three variants of the eight-factor EFA model were modeled: the full EFA model, in which all loadings were included (also reported in Table S2, online); a variant in which only significant loadings from the EFA were retainedFootnote 2; and a simple-structure variant in which each variable had only one loading, corresponding to its greatest loading in the EFA model. A model reflecting the cluster-analytic solution was also fit, as was the model reflecting DSM structure.
Confirmatory model selection statistics

k, Number of model parameters; ln(L), log likelihood; BIC, Bayesian Information Criterion; RMSR, root mean square residual; CFI, Comparative Fit Index.
RMSR values were adjusted upwards to correct for smoothing, as described in the text. BIC and CFI were not adjusted.
The optimal, most parsimonious model was the cluster-analytic model (Table 2; BIC=2495563.12), which also fit the correlation matrix well in an absolute sense (RMSR=0.065). Although the full EFA model reproduced the correlation matrix more closely, it required over twice as many parameters to do so, resulting in worse fit overall. When cross-loadings were eliminated from the EFA model, the fit decreased further. The DSM model, in general, fit relatively poorly; although it reproduced the correlation matrix roughly as closely as the cluster-analytic model, the cluster-analytic model did so more efficiently, with fewer parameters. The DSM model also produced anomalous parameter estimates, some being at their boundaries (e.g. the estimated correlation between alcohol abuse and dependence was 1.0).
Superordinate structure
As the best-fitting model comprised 20 factors, its higher-order structure was examined. As in the initial analyses, exploratory models were generated using EFA and cluster analysis, and these exploratory models were compared using confirmatory methods. Exploratory (i.e. EFAs and cluster) analyses were conducted on the estimated interfactor correlations from the lower-order cluster-analytic model. Confirmatory models, however, were fit to the symptom-level correlations (i.e. higher-order and lower-order structures were included together simultaneously in the same models) to evaluate final overall model fit.
In modeling higher-order structure, various EFA-based and cluster-analytic models were compared simultaneously. Four EFA-based models were included in the comparisons, comprising between two and four factors. Models comprising more factors than this were not included for various reasons: the fifth eigenvalue of the lower-order factor intercorrelation matrix was less than 1, the fifth factor of a five-factor EFA was marked by only one lower-order indicator, and a six-factor model would not converge. Similarly, cluster-analytic models comprising between two and six clusters were included in model comparisons. Models having more than six clusters were not considered because they would result in factors with single indicators. Cross-loadings >0.30 in EFA solutions were included in confirmatory models.
The results of the higher-order model comparisons are presented in Table 2. The optimal, most parsimonious model was based on the four-factor EFA (BIC=2496036.53, RMSR=0*"/>
Lower-order loading estimates from the final higher-order model

s.e., Standard error.
Factor names correspond to those presented in Fig. 1. Variable descriptions contain an abbreviation indicating which criteria they correspond to; each abbreviation indicates the name of the disorder and criterion number, as reflected in Table S1 (online).
The final hierarchical model is illustrated in Fig. 1. The first higher-order factor, Internalizing, closely corresponds to Internalizing factors reported in previous literature, but also includes emotional lability and somatoform problems. Externalizing, similarly, resembles previously reported Externalizing factors, but is expanded to include attention-seeking problems. The Thought Disorder factor resembles psychosis factors that have been reported in some studies, comprising hallucinations and delusions, paranoia, eccentric behavior, and schizoid characteristics, but is broader in scope. It includes, for example, inflexibility and also disorganized attachment problems. The final factor, Pathological Introversion, resembles similar factors reported in analyses of personality pathology (O'Connor & Dyce, Reference O'Connor and Dyce1998; Markon et al. Reference Markon, Krueger and Watson2005; Kendler et al. Reference Kendler, Aggen, Czajkowski, Roysamb, Tambs, Torgersen, Neale and Reichborn-Kjennerud2008), comprising social anxiety, lack of assertiveness and dependency, which have been linked to introversion (O'Connor & Dyce, Reference O'Connor and Dyce1998; Saulsman & Page, Reference Saulsman and Page2004).
The final model includes cross-loadings. Emotional Lability, for example, has cross-loadings from Internalizing and Externalizing, consistent with evidence that emotional instability shares features of negative emotionality and also of disinhibition (Miller & Pilkonis, Reference Miller and Pilkonis2006; see also James & Taylor, Reference James and Taylor2008). Hostility, similarly, cross-loads on Externalizing and Thought Disorder, probably because of its conceptual relationships with aggression and paranoia. Finally, hallucinations and delusions have a relatively small cross-loading from Internalizing, consistent with previous research (e.g. Verona et al. Reference Verona, Sachs-Ericsson and Joiner2004).
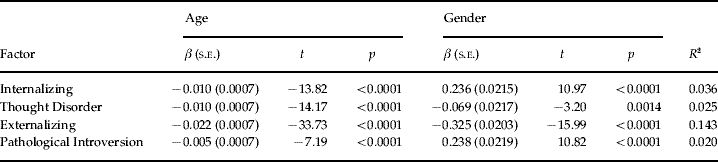
Relationships between the superordinate factors, age and gender are presented in Table 4. ML factor score estimates were regressed on the demographic variables. Levels of all traits decreased with age; levels of Internalizing and Pathological Introversion were greater in females and levels of Externalizing and Thought Disorder were greater in males, although this latter association was fairly small. The overall proportion of variance accounted for by demographic variables, although significant, was generally small in magnitude, ranging from 0.02 to 0.14.
Relationships between the higher-order factors, age and gender

Values given are regression β weights, together with their standard errors (s.e.), associated t statistics and p values, and the overall R 2 for the model. Gender was coded as a dummy variable; β weights reflect the effect of being female relative to male (i.e. positive values reflect greater levels of the factor in females).
Discussion
The hierarchical model presented here extends existing accounts of psychopathology structure in important ways. First, by including a variety of Axis I and also Axis II psychopathology, the model extends existing accounts focused on Axis I disorders (e.g. Krabbendam et al. Reference Krabbendam, Myin-Germeys, De Graaf, Vollebergh, Nolen, Iedema and Van Os2004; Dikeos et al. Reference Dikeos, Wickham, McDonald, Walshe, Sigmundsson, Bramon, Grech, Toulopoulou, Murray and Sham2006), Axis II disorders (e.g. O'Connor & Dyce, Reference O'Connor and Dyce1998), or some relatively limited subset of both (Krueger & Markon, Reference Krueger and Markon2006). Second, by modeling symptoms rather than disorders, a full hierarchy can be delineated, relatively free of assumptions about lower-level structure.
Relationships with existing structural accounts
Similarities with existing accounts
The current model reinforces a large body of research documenting the distinction between internalizing and externalizing psychopathology (Krueger & Markon, Reference Krueger and Markon2006). However, the current model is also consistent with extensions that include psychosis as another major form of psychopathology. The results of the present analyses are strongly consistent with those of Wolf et al. (Reference Wolf, Schubert, Patterson, Grande, Brocco and Pendleton1988), who demonstrated that schizophrenia reflects a distinct liability dimension, separate from either internalizing or externalizing.
Subordinate features of the current model are also consistent with previous literature. The current model, for example, is consistent with structural studies of depression that distinguish between cognitive and somatic components (Shafer, Reference Shafer2006). The model suggests that somatic symptoms function as a distinct indicator of internalizing, at the same level of hierarchy, rather than as a subordinate construct of depression per se (cf. Watson et al. Reference Watson, O'Hara, Simms, Kotov, Chmielewski, McDade-Montez, Gamez and Stuart2007; Simms et al. Reference Simms, Gros, Watson and O'Hara2008).
The demarcation of separate emotional lability, disorganized attachment, and impulsivity components of borderline psychopathology is also consistent with previous research (Sanislow et al. Reference Sanislow, Grilo, Morey, Bender, Skodol, Gunderson, Shea, Stout, Zanarini and McGlashan2002). Similarities involving the subordinate structure of psychosis are also evident; the distinction between hallucinations and delusions, eccentricity, and schizoid characteristics has been demonstrated in several studies (e.g. Lorr et al. Reference Lorr, Klett and McNair1963; Dikeos et al. Reference Dikeos, Wickham, McDonald, Walshe, Sigmundsson, Bramon, Grech, Toulopoulou, Murray and Sham2006).
Differences from existing accounts
Although the current model replicates existing models in various respects, there are also notable differences between the current model and previous models. For example, although a distinct Fear factor was delineated, Internalizing did not bifurcate into distinct Distress and Fear components. There are various explanations for this, the most notable being that it is impossible to model an intermediate level of hierarchy, presumably where the Distress–Fear distinction appears, when observed indicators are at the symptom level. Depression and Internalizing, for example, may be more prominent structural features than Distress, even though Distress is discernable under appropriate circumstances. Conversely, disorder-level analyses might inflate the prominence of certain structural features. The constrained representation of symptoms in diagnoses may result in an exaggeration of certain features, such as Fear, distorting apparent factor structure.
It is also important to note that the current model differs from the four-factor model prominent in personality theory and research (e.g. Markon et al. Reference Markon, Krueger and Watson2005). Although there are conceptual parallels between the two models, there are not separate Agreeableness and Conscientiousness factors in the current model, and no analogue to Thought Disorder in the Big Four of personality.
Despite differences between the current model and the Big Four of personality, it is possible to integrate the two conceptually. As has been mentioned, Externalizing, which has parallels with the personality trait of Disinhibition (e.g. Markon et al. Reference Markon, Krueger and Watson2005), bifurcates into aggressive and non-aggressive factors (e.g. Loeber & Schmaling, Reference Loeber and Schmaling1985; Tackett et al. Reference Tackett, Krueger, Sawyer and Graetz2003, Reference Tackett, Krueger, Iacono and McGue2005; Krueger et al. Reference Krueger, Markon, Patrick, Benning and Kramer2007), which parallel Agreeableness and Conscientiousness in the Big Four of personality. Although the Thought Disorder factor of the current model has no parallel within the Big Four, emerging research suggests that Thought Disorder-related phenomena reflect a separate personality dimension (Chmielewski & Watson, Reference Chmielewski and Watson2008; Tackett et al. Reference Tackett, Silberschmidt, Krueger and Sponheim2008; Watson et al. Reference Watson, Clark and Chmielewski2008). Thus, although the current model differs from the Big Four in many ways, it is highly consistent with the Big Trait hierarchy.
Novel features of the current model
Social maladjustment as a major psychopathology dimension
The prominence of social maladjustment as a major structural dimension, especially as manifested in introversion and positive emotionality, is well documented in theory and research on normal and abnormal personality variation (Markon et al. Reference Markon, Krueger and Watson2005; Depue & Lenzenweger, Reference Depue, Lenzenweger, Krueger and Tackett2006; Kendler et al. Reference Kendler, Aggen, Czajkowski, Roysamb, Tambs, Torgersen, Neale and Reichborn-Kjennerud2008). However, its status vis-à-vis other, more acute forms of psychopathology has been less clear. The current model expands the status of social maladjustment as a primary dimension of psychopathology to other constructs, clarifying its relationship with other forms of psychopathology. The current results, for example, are consistent with previous research demonstrating that social anxiety reflects low levels of positive emotion, and can be distinguished from many other internalizing problems in that regard (e.g. Watson et al. Reference Watson, Clark and Carey1988; Bienvenu et al. Reference Bienvenu, Samuels, Costa, Reti, Eaton and Nestadt2004; Bagby et al. Reference Bagby, Costa, Widiger, Ryder and Marshall2005; Naragon & Watson, Reference Naragon and Watson2007). According to the current model, social anxiety has more in common with problems such as unassertiveness and dependency than other internalizing difficulties.
Expanded scope of thought disorder
One feature of the current model is its broadened representation of thought disorder. In addition to classical indicators of thought disorder, such as hallucinations and delusions, eccentricity and schizoid behavior, the current model includes problems such as disorganized attachment and inflexibility. This research replicates evidence that thought disorder-related phenomena are more heterogeneous than has traditionally been recognized (Chopra & Beatson, Reference Chopra and Beatson1986; O'Connell et al. Reference O'Connell, Cooper, Perry and Hoke1989; Sbrana et al. Reference Sbrana, Dell'Osso, Benvenuti, Rucci, Cassano, Banti, Gonnelli, Doria, Ravani, Spagnolli, Rossi, Raimondi, Catena, Endicott, Frank, Kupfer and Cassano2005; Chmielewski & Watson, Reference Chmielewski and Watson2008; Watson et al. Reference Watson, Clark and Chmielewski2008).
This expanded conceptualization of thought disorder is consistent with the endophenotype paradigm, which assumes that some core process, possibly involving deficits in processing speed (Dickinson et al. Reference Dickinson, Ramsey and Gold2007), executive function (e.g. Johnson-Selfridge & Zalewski, Reference Johnson-Selfridge and Zalewski2001; Lenzenweger et al. Reference Lenzenweger, Clarkin, Fertuck and Kernberg2004; Lee & Park, Reference Lee and Park2005) or other variables, manifests in numerous ways depending on context (Meehl, Reference Meehl1962; Gottesman & Shields, Reference Gottesman and Shields1973; Cannon & Keller, Reference Cannon and Keller2006). The current model, by highlighting additional manifestations of thought disorder, may help to better define it and study its etiology and treatment.
Questions for further inquiry
Further studies should attempt to replicate the current findings in another sample, to determine how well the model presented here generalizes to other individuals, measures and designs. Future studies can also extend the current results by examining additional forms of psychopathology and by exploring temporal and developmental influences on psychopathology structure.
Other forms of psychopathology
Although the current model expands representation of different forms of psychopathology beyond many existing accounts, some important forms of psychopathology were either under-represented or not represented at all. Mania, for example, was poorly represented, and there was no representation of eating disorders or trauma-related disorders. Some of these omissions are due to inherent difficulties in assessment; for example, mania, negative symptoms and disorganization of psychosis are difficult to assess by lay interview (Kessler et al. Reference Kessler, Birnbaum, Demler, Falloon, Gagnon, Guyer, Howes, Kendler, Shi, Walters and Wu2005). Inclusion of different forms of psychopathology, or better representation of forms that were under-represented in the current study, might lead to different conclusions about Axis I and II structure.
Parallels between the findings reported here and previous research, however, suggest that the current model is likely to be robust to changes in measures. As has already been noted, the current model bears strong similarities to existing models based on different indicators (e.g. Lorr et al. Reference Lorr, Klett and McNair1963; Shafer, Reference Shafer2005; Krueger & Markon, Reference Krueger and Markon2006; Kendler et al. Reference Kendler, Aggen, Czajkowski, Roysamb, Tambs, Torgersen, Neale and Reichborn-Kjennerud2008). Moreover, some forms of psychopathology not examined here have been examined in other studies, providing a context in which to understand the current results. For example, studies suggest that eating disorder forms a subfactor of Internalizing, and that purging and compensatory behavior additionally seem to reflect Externalizing (Forbush et al. Reference Forbush, South, Krueger, Iacono, Clark, Keel and Watson2007). Studies similarly suggest that post-traumatic stress disorder behaves as an Internalizing disorder. Nevertheless, further research using different assessment methods will help to clarify the placement of many psychopathology symptoms.
Temporal and developmental factors
One question not addressed by the current paper is how the time-frame affects symptom structure. Different symptoms, for example, were assessed using different time-frames in the current study. To some extent, these differences reflect current diagnostic paradigms, with Axis I phenomena assumed to be potentially shorter in duration than Axis II phenomena. Moreover, as most of the factors comprise indicators using different time-frames, the time-frame is unlikely to entirely explain the structure identified here. Nevertheless, it is possible that assessment using a more uniform time-frame might lead to slightly different conclusions.
A broader related issue is how features of psychopathology structure relate to each other temporally and change over the course of development. Differences in longitudinal trajectories may provide important information about etiology or future functioning. Structures, moreover, may causally interact with each other and with other variables in important ways. One important question, for example, is why the superfactors are so substantially correlated with each other (Fig. 1). There are many explanations, and they may all reflect a very general liability to psychopathology, for instance, or they may cause each other, and future research is needed to distinguish between these explanations.
Etiology of the observed structure
Another fundamental question to be addressed is how the observed structure is mediated etiologically. Kendler et al. (Reference Kendler, Aggen, Czajkowski, Roysamb, Tambs, Torgersen, Neale and Reichborn-Kjennerud2008), in work on personality disorder, have identified factors similar to those presented here, including a higher-order factor marked by avoidant personality disorder. Their results also suggest that the genetic and environmental architecture of personality disorder may differ, in that genetic and environmental factors contribute to different patterns of co-occurrence among psychopathology syndromes.
Different forms of psychopathology have been linked to related but dissociable pathways in the brain (e.g. Davidson et al. Reference Davidson, Putnam and Larson2000; MacDonald & Carter, Reference MacDonald and Carter2003; Depue & Lenzenweger, Reference Depue, Lenzenweger, Krueger and Tackett2006). Expanding our understanding of how neural substrates mediate the emergence of distinct forms of psychopathology is crucial. An interesting question raised by the current findings is how Pathological Introversion is mediated neurobiologically. Depue and colleagues (Depue & Morrone-Strupinsky, Reference Depue and Morrone-Strupinsky2005; Depue & Lenzenweger, Reference Depue, Lenzenweger, Krueger and Tackett2006) have speculated that variation in affiliative traits is mediated by consummatory reward systems involving opiate pathways in the nucleus accumbens and ventral tegmental area. Further research is needed to examine the possibility that disruptions in this pathway mediate problems with social maladjustment, and to determine how these systems may be related to other extraversion-related traits.
Note
Supplementary material accompanies this paper on the Journal's website (http://journals.cambridge.org).
Acknowledgments
L. A. Clark, D. Watson and R. Krueger provided many useful recommendations during the preparation of the manuscript.
Declaration of Interest
None.