Introduction
Anorexia nervosa (AN) is a potentially life-threatening eating disorder characterized by intense body dissatisfaction and a relentless pursuit of thinness, to the point of starvation. Treatments for anorexia are often ineffective (Steinhausen, Reference Steinhausen2002; Fassino & Abbate Daga, Reference Fassino and Abbate Daga2013; Walsh, Reference Walsh2013), and this makes research into the brain mechanisms that trigger and maintain the disorder critical in order to develop targeted approaches and new treatment options (Schmidt & Campbell, Reference Schmidt and Campbell2013). Several authors have investigated the presence of structural brain alterations that could be linked to the symptoms of anorexia. For example, volumetric decreases have been found in the gray matter in the cerebellum (Boghi et al. Reference Boghi, Sterpone, Sales, D'Agata, Bradac, Zullo and Munno2011; Brooks et al. Reference Brooks, Barker, O'Daly, Brammer, Williams, Benedict, Schioth, Treasure and Campbell2011; Amianto et al. Reference Amianto, Caroppo, D'Agata, Spalatro, Lavagnino, Caglio, Righi, Bergui, Abbate Daga, Rigardetto, Mortara and Fassino2013a ; Fonville et al. Reference Fonville, Giampietro, Williams, Simmons and Tchanturia2014), frontal cortex (Joos et al. Reference Joos, Kloppel, Hartmann, Glauche, Tuscher, Perlov, Saum, Freyer, Zeek and Tebartz van Elst2010), anterior cingulate (Muhlau et al. Reference Muhlau, Gaser, Ilg, Conrad, Leibl, Cebulla, Backmund, Gerlinghoff, Lommer, Schnebel, Wohlschläger, Zimmer and Nunnemann2007; Friederich et al. Reference Friederich, Walther, Bendszus, Biller, Thomann, Zeigermann, Katus, Brunner, Zastrow and Herzog2012), temporal and parietal areas (Castro-Fornieles et al. Reference Castro-Fornieles, Bargallo, Lazaro, Andres, Falcon, Plana and Junqué2009; Joos et al. Reference Joos, Kloppel, Hartmann, Glauche, Tuscher, Perlov, Saum, Freyer, Zeek and Tebartz van Elst2010; Gaudio et al. Reference Gaudio, Nocchi, Franchin, Genovese, Cannata, Longo and Fariello2011), occipital areas (Suchan et al. Reference Suchan, Busch, Schulte, Gronemeyer, Herpertz and Vocks2010; Amianto et al. Reference Amianto, Caroppo, D'Agata, Spalatro, Lavagnino, Caglio, Righi, Bergui, Abbate Daga, Rigardetto, Mortara and Fassino2013a ; Fonville et al. Reference Fonville, Giampietro, Williams, Simmons and Tchanturia2014) and localized white matter regions (Kazlouski et al. Reference Kazlouski, Rollin, Tregellas, Shott, Jappe, Hagman, Pryor, Yang and Frank2011; Frank et al. Reference Frank, Shott, Hagman and Mittal2013). In addition, total white matter (Boghi et al. Reference Boghi, Sterpone, Sales, D'Agata, Bradac, Zullo and Munno2011; Bomba et al. Reference Bomba, Riva, Veggo, Grimaldi, Morzenti, Neri and Nacinovich2013; Fonville et al. Reference Fonville, Giampietro, Williams, Simmons and Tchanturia2014) and total gray matter (Katzman et al. Reference Katzman, Lambe, Mikulis, Ridgley, Goldbloom and Zipursky1996; Bomba et al. Reference Bomba, Riva, Veggo, Grimaldi, Morzenti, Neri and Nacinovich2013) reductions have been reported in some studies. In contrast, volumetric increases in specific gray matter regions (Brooks et al. Reference Brooks, Barker, O'Daly, Brammer, Williams, Benedict, Schioth, Treasure and Campbell2011; Amianto et al. Reference Amianto, Caroppo, D'Agata, Spalatro, Lavagnino, Caglio, Righi, Bergui, Abbate Daga, Rigardetto, Mortara and Fassino2013a ; Frank et al. Reference Frank, Shott, Hagman and Mittal2013) and in cerebrospinal fluid and ventricles (Castro-Fornieles et al. Reference Castro-Fornieles, Bargallo, Lazaro, Andres, Falcon, Plana and Junqué2009; Bomba et al. Reference Bomba, Riva, Veggo, Grimaldi, Morzenti, Neri and Nacinovich2013; Fonville et al. Reference Fonville, Giampietro, Williams, Simmons and Tchanturia2014) have also been reported. However, results from these studies have not been translated into clinical practice. A major limitation has been the fact that previous studies have largely utilized univariate data analytic techniques – which compute statistical inferences at a voxel-by-voxel basis and cannot utilize multiple measurements to make predictions at an individual subject level. Consequently, in this study, we adopted a multivariate machine learning approach, which has two noticeable benefits: first, the ability to utilize multiple neuroanatomical measurements to classify or predict individual subjects; second, this method allows the researcher to select neuroanatomical measurements most relevant in predicting individual subjects through a feature reduction process (Mwangi et al. Reference Mwangi, Ebmeier, Matthews and Steele2012). These techniques have recently been developed and applied successfully in neuroimaging research (Mwangi et al. Reference Mwangi, Ebmeier, Matthews and Steele2012, Reference Mwangi, Tian and Soares2014b ). Notably, these techniques are usually implemented in two stages: first, neuroanatomical measurements from multiple subjects and corresponding diagnostic labels (e.g. 1 = healthy controls, 2 = anorexia) are used to ‘train’ a classifier. Second, the classifier accuracy (sensitivity and specificity) is evaluated using ‘novel’ data not utilized during the classifier ‘training’ stage. This process is referred to as ‘cross-validation’, which in this study was implemented using the ‘leave-one-out’ method. This entails ‘training’ the classifier using all subjects but one, a process which is repeated until all subjects are left out at least once and prediction results are aggregated as well as reported. These techniques have been successfully applied in multiple disorders such as major depression (Mwangi et al. Reference Mwangi, Ebmeier, Matthews and Steele2012), bipolar disorder (Mwangi et al. Reference Mwangi, Spiker, Zunta-Soares and Soares2014a ), attention-deficit/hyperactivity disorder (Johnston et al. Reference Johnston, Mwangi, Matthews, Coghill, Konrad and Steele2014) and autism (Ingalhalikar et al. Reference Ingalhalikar, Parker, Bloy, Roberts and Verma2011). Most notably, some machine learning techniques provide probabilistic outcomes at the individual subject level, which quantify the probability of a subject having a disorder (Mwangi et al. Reference Mwangi, Spiker, Zunta-Soares and Soares2014a ). These probabilities may be useful clinically to guide individualized treatments (Fu & Costafreda, Reference Fu and Costafreda2013).
In this study T1-weighted magnetic resonance imaging (MRI) scans of 15 AN patients and 15 matched healthy controls were acquired from the Center for Eating Disorders in Turin, Italy. These data have previously been reported elsewhere (Amianto et al. Reference Amianto, Caroppo, D'Agata, Spalatro, Lavagnino, Caglio, Righi, Bergui, Abbate Daga, Rigardetto, Mortara and Fassino2013a ). Our primary aim in this study was to develop and apply a highly accurate predictive classifier able to discriminate neuroanatomical scans from AN patients and healthy controls. Specifically, the Least Absolute Shrinkage and Selection Operator (LASSO) algorithm (Tibshirani, Reference Tibshirani1996) was used. The second aim was to compute the probability of a subject of belonging in the AN group based on the subject's MRI scan and establish whether there is a relationship between individual subjects’ probabilities and key symptoms of anorexia. This aim was investigated by testing the correlation of the probability with two dimensions of the Eating Disorder Inventory 2 (EDI-II) (Garner, Reference Garner1991): ‘drive for thinness’ and ‘body dissatisfaction’, which express the core psychopathology of AN (Russell, Reference Russell and Price1970; Bruch, Reference Bruch1973; Vansteelandt et al. Reference Vansteelandt, Pieters, Vanderlinden and Probst2010), and with the BMI.
Method
Participants
Patients were recruited after being diagnosed with AN at their first visit at the out-patient service of the Center for Eating Disorders of the University of Turin. Matched healthy controls were recruited through local advertisements. Diagnosis was established for all subjects by a psychiatrist expert in the assessment of eating disorders using the Structured Clinical Interview for DSM-IV-TR (SCID). A further assessment for Axis II disorders was also performed with the SCID-II for DSM-IV-TR. A total of 15 AN patients (12 restricting-type, three binge-purging type) and 15 healthy controls were enrolled. Inclusion criteria were: female sex, age 16–30 years, right-handedness, no past or present neurological diseases, no psychiatric Axis I or Axis II co-morbidity for patients, no drug or alcohol abuse or dependence, no psychiatric diagnosis for controls, no past or present medication or psychotherapeutic treatment, duration or illness shorter than 2 years, BMI > 15 kg/m2 for patients. The EDI-II (Garner, Reference Garner1991) was administered to all participants. All subjects provided their written informed consent to the study. The study was approved by the Ethical Committee of the San Giovanni Battista Hospital, Turin. Statistical analyses were conducted using SPSS 20.0 (USA). Demographic and clinical group differences between patients and healthy controls were assessed with t tests.
MRI scan acquisition
Data were acquired at the Neuroscience Department, San Giovanni Battista Hospital, Turin, on a Philips Achieva1.5 T scanner (The Netherlands). T1-weighted three-dimensional turbo gradient-echo sequences (image matrix = 256 × 256; voxel size = 1 × 1 × 1 mm3; number of slices = 190; repetition time (TR) = 7 ms; echo time (TE) = 3 ms; turbo spin echo, TFE shots = 89) were acquired with full brain coverage and isotropic voxels. This sequence was equivalent to a magnetic prepared rapid acquisition gradient echo (MPRAGE). The acquisition time was approximately 5 min.
MRI scan pre-processing
All T1-weighted scans were inspected to ensure no presence of gross artefacts and subsequently pre-processed using the FreeSurfer software library (http://surfer.nmr.mgh.harvard.edu/) version 5.3.0 (Fischl, Reference Fischl2012). This process was achieved using an automated method which is described in detail elsewhere (Desikan et al. Reference Desikan, Ségonne, Fischl, Quinn, Dickerson, Blacker, Buckner, Dale, Maguire, Hyman, Albert and Killiany2006; Rosas et al. Reference Rosas, Lee, Bender, Zaleta, Vangel, Yu, Fischl, Pappu, Onorato, Cha, Salat and Hersch2010). Lastly, neuroanatomical volumes were extracted using a brain atlas of 109 anatomical regions (41 subcortical and 68 cortical) as described elsewhere (Fischl et al. Reference Fischl, van der Kouwe, Destrieux, Halgren, Ségonne, Salat, Busa, Seidman, Goldstein, Kennedy, Caviness, Makris, Rosen and Dale2004; Desikan et al. Reference Desikan, Ségonne, Fischl, Quinn, Dickerson, Blacker, Buckner, Dale, Maguire, Hyman, Albert and Killiany2006) and tabulated in the online Supplementary material. All anatomical volumes were scaled with the total intracranial volume (ICV) and used as predictor variables or features in the ensuing machine learning analyses.
Multivariate machine learning
Predictor variables were normalized by subtracting the mean and dividing by the standard deviation. The LASSO algorithm was set up to perform a prediction task of classifying or distinguishing healthy controls from AN patients. Anatomical volumes (ICV normalized) also referred to as predictor variables or features were represented as x
ij
. Target group membership labels (1 = healthy controls, 2 = anorexia) were represented as y
i
, where i = 1, 2, 3, … N represents study subjects (healthy controls, AN) and j = 1,2,3, … M stands for the number of predictor variables (anatomical volumes – ICV normalized). Consequently, the LASSO algorithm (Tibshirani, Reference Tibshirani1996, Reference Tibshirani2011) computed a set of coefficients (
 $\hat \beta $
) by minimizing the following objective function:
 $$\mathop \sum \limits_{i = 1}^N \left( {y_i - \mathop \sum \limits_{\,j = 1}^M x_{ij} \beta _j} \right)^{\!\!2} +\ \lambda \mathop \sum \limits_{\,j = 1}^M \vert\beta _j \vert$$
where λ is a parameter used to encourage model sparsity – meaning few model coefficients (
 $\hat \beta $
) with non-zero weighting values and high model prediction accuracy (Tibshirani, Reference Tibshirani1996; Bunea et al.
Reference Bunea, She, Ombao, Gongvatana, Devlin and Cohen2011; Mwangi et al.
Reference Mwangi, Tian and Soares2014b
). In the present study, the λ parameter was selected through a 5-fold cross-validation using training data only and the parameter which maximized prediction accuracy was selected. The LASSO objective function was solved using the coordinate descent optimization algorithm as explored in detail elsewhere (Friedman et al.
Reference Friedman, Hastie and Tibshirani2010). This optimization was solved using a Matlab (The Mathworks, Inc.) routine freely provided by Friedman et al. (Reference Friedman, Hastie and Tibshirani2010). Most notably, in the current study the LASSO algorithm was preferred as compared to equivalent algorithms (e.g. ridge regression or non-regularized ridge) as it promotes ‘sparsity’ – meaning few model coefficients with non-zero weighting values (Bunea et al.
Reference Bunea, She, Ombao, Gongvatana, Devlin and Cohen2011; Mwangi et al.
Reference Mwangi, Tian and Soares2014b
). Sparse models are reportedly more accurate as they remove non-redundant predictor variables and are more interpretable as there are few anatomical regions to consider when interpreting the model (Mwangi et al.
Reference Mwangi, Tian and Soares2014b
).
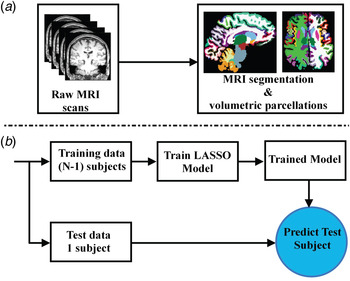
The model was ‘trained’ to estimate the probability of a subject belonging to the AN or the healthy control group. Importantly, the leave-one-out cross-validation (LOOCV) method as introduced below was used to train and test the models shown in Fig. 1b . This process entailed training the model using all subjects but one and this was repeated until all subjects had been left out at least once (Johnston et al. Reference Johnston, Mwangi, Matthews, Coghill and Steele2013). Lastly, the validity of the model was assessed using multiple metrics such as accuracy, sensitivity, specificity, positive predictive value (PPV), negative predictive value (NPV) and area under receiver operating characteristic curve (AUROC). These predictive classifier quantification metrics are explored in detail elsewhere (Mwangi et al. Reference Mwangi, Ebmeier, Matthews and Steele2012). The model probability, which quantifies whether the subject belongs to the patient or healthy control group, was tested for correlations with the drive for thinness and body dissatisfaction scores of the EDI-II and the BMI. This calculation was performed to establish the relationship between the machine learning model probability outcome and dimensions that define the key diagnostic criteria for AN. Furthermore, partial correlations using weight as a covariate were performed, in order to assess whether the relationship between the model probability and psychopathology at an individual subject level was accounted for by BMI.
Flow diagrams showing both the magnetic resonance imaging (MRI) scan during the pre-processing stage and during the model training/testing process. (a) Volumetric measurements were extracted using FreeSurfer software version 5.3. (b) A leave-one-out cross-validation process was used to separate training and testing data and the model was trained using training data only. The model was used to predict the left-out subject (circled in blue). LASSO, Least Absolute Shrinkage and Selection Operator.

Results
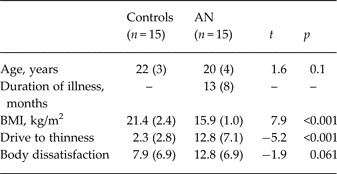
Table 1 summarizes the sociodemographic and clinical details of the participants. There were no significant differences between groups with regards to age. As expected, AN patients had a significantly lower weight and a higher drive for thinness. There was a trend for higher body dissatisfaction in AN patients (p = 0.061).
Clinical and demographic characteristics and differences between means (t test)

Data are given as mean (standard deviation).
AN, Anorexia nervosa; BMI, body mass index.
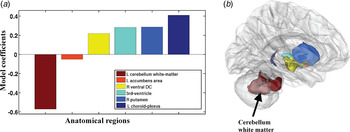
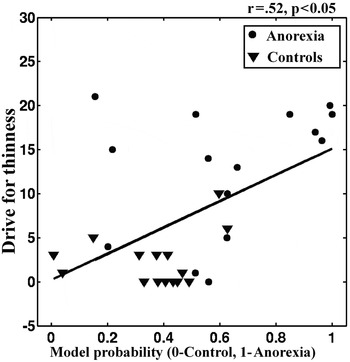
The LASSO multivariate machine learning model assigned 25 out of 30 subjects the correct label (12 AN patients and 13 controls were correctly classified). This result translated to a sensitivity of 86.7%, 80.0% specificity and overall accuracy of 83.3%. In addition, the model reported a PPV = 85.7%, NPV = 81.2%, and an AUROC of 0.796. These predictions were statistically significant (p < 0.001) through a χ 2 test between actual categorical labels and the model's predicted labels. Anatomical regions that were most relevant to the model predictions are shown in Fig. 2b . Anatomical regions that presented volumetric reductions in AN patients include white matter of the left cerebellum, and the left accumbens area. Conversely, the left choroid plexus, the right putamen, the third ventricle and the right ventral diencephalon presented volumetric increases in AN patients as compared with healthy controls as shown in Fig. 1b . The individual score of probability of being assigned to the group of anorectic patients showed a linear relationship with the drive for thinness scale (r = 0.52, p < 0.005) (see Fig. 3) and with BMI (r = −0.45, p = 0.01). No relationship was found with body dissatisfaction. A partial correlation between the probability score and drive for thinness controlling for the BMI indicated a persisting trend towards a positive correlation (r = 0.35, p = 0.060).
(a) Anatomical regions that were most relevant to model predictions. The dimensions of the bars represent the β weights of the regions (= relative contribution to the model). (b) The same regions are shown in the brain. L, Left; R, right; DC, diencephalon.

Scatterplot showing the relationship between model probability and Eating Disorder Inventory 2 drive for thinness scores for patients with anorexia and controls.

Discussion
AN is a serious psychiatric disorder that affects mainly adolescent and young adult women. It is associated with medical complications (Fairburn & Harrison, Reference Fairburn and Harrison2003) and it has one of the highest mortality rates among all psychiatric disorders (Sullivan, Reference Sullivan1995).
To the best of our knowledge, this is the first neuroimaging study utilizing a machine learning technique to predict AN diagnosis at an individual subject level. Markedly, probabilities assigned to individual subjects by the machine learning model showed a linear relationship with the drive for thinness scores and with the BMI.
Brain regions identified by the model as most relevant in classifying AN patients from healthy controls are consistent with published group-level studies and with findings of the previous study performed on this dataset: one example of this is the presence of alterations in the cerebellum.
The cerebellum is involved in feeding, behavior and emotion regulation (Schmahmann & Sherman, Reference Schmahmann and Sherman1998; Zhu & Wang, Reference Zhu and Wang2008), and several recent studies point to alterations in the cerebellum in eating disorder patients (Boghi et al. Reference Boghi, Sterpone, Sales, D'Agata, Bradac, Zullo and Munno2011; Brooks et al. Reference Brooks, Barker, O'Daly, Brammer, Williams, Benedict, Schioth, Treasure and Campbell2011; Fonville et al. Reference Fonville, Giampietro, Williams, Simmons and Tchanturia2014; Amianto et al. Reference Amianto, Caroppo, D'Agata, Spalatro, Lavagnino, Caglio, Righi, Bergui, Abbate Daga, Rigardetto, Mortara and Fassino2013a , Reference Amianto, D'Agata, Lavagnino, Caroppo, Abbate-Daga, Righi, Scarone, Bergui, Mortara and Fassino b ). The reduction in the white matter of the left cerebellum in particular dovetails with a recent diffusion tensor imaging study by Nagahara et al. (Reference Nagahara, Nakamae, Nishizawa, Mizuhara, Moritoki, Wada, Sakai, Yamashita, Narumoto, Miyata, Yamada and Fukui2014) which found lower fractional anisotropy in the white matter of the left cerebellum in anorectic patients compared with controls. However, there were also differences from previous results. Group differences that the previous voxel-based morphometry (VBM) analysis showed in this database (e.g. in the paracentral lobule and the supplementary motor area) (Amianto et al. Reference Amianto, Caroppo, D'Agata, Spalatro, Lavagnino, Caglio, Righi, Bergui, Abbate Daga, Rigardetto, Mortara and Fassino2013a ) were not found to be relevant in distinguishing individual AN patients and healthy controls using a multivariate machine learning approach. This may be due to the process of feature selection or ‘regularization’ (Bunea et al. Reference Bunea, She, Ombao, Gongvatana, Devlin and Cohen2011; Mwangi et al. Reference Mwangi, Tian and Soares2014b ): LASSO ‘prunes’ (assigns zero β weight to) variables that may be ‘redundant’, meaning that they may not provide significant improvement to the model (Bunea et al. Reference Bunea, She, Ombao, Gongvatana, Devlin and Cohen2011).
The increased volume in the choroid plexus was an unanticipated result. This could be attributed to the fact that multivariate machine learning techniques may be more sensitive to volumetric patterns, as compared with conventional mass-univariate approaches (Fu & Costafreda, Reference Fu and Costafreda2013). The choroid plexus has been implicated in recent studies as a relevant and understudied area of investigation in psychiatry (Sathyanesan et al. Reference Sathyanesan, Girgenti, Banasr, Stone, Bruce, Guilchicek, Wilczak-Havill, Nairn, Williams, Sass, Duman and Newton2012; Turner et al. Reference Turner, Thompson, Bunney, Schatzberg, Barchas, Myers, Akil and Watson2014). Sathyanesan et al. (Reference Sathyanesan, Girgenti, Banasr, Stone, Bruce, Guilchicek, Wilczak-Havill, Nairn, Williams, Sass, Duman and Newton2012) showed that chronic stress alters the expression of several genes and down-regulates 5HT2C receptors in the choroid plexus; the authors suggest that these mechanisms play a role in stress-induced decrease in glucose intake in rats. Alterations of serotonergic circuits and the effects of stress are thought to be involved in the neurobiology of AN (Kaye et al. Reference Kaye, Wierenga, Bailer, Simmons and Bischoff-Grethe2013). Another study in rats showed that the stimulation of melanocortin receptors in circumventricular organs, among which the choroid plexus, has potent inhibitory effects on food intake (Trivedi et al. Reference Trivedi, Jiang, Tamvakopoulos, Shen, Yu, Mock, Fenyk-Melody, Van der Ploeg and Guan2003). Further investigation of this anatomical region in anorexia is warranted. Lastly, the putamen and accumbens are regions involved in reward processing and alterations in the reward system have been repeatedly reported in this patient population (Frank, Reference Frank2013; Frank et al. Reference Frank, Shott, Hagman and Mittal2013; Titova et al. Reference Titova, Hjorth, Schioth and Brooks2013). In addition, ventricular enlargement confirms previous studies (Swayze et al. Reference Swayze, Andersen, Andreasen, Arndt, Sato and Ziebell2003; Fonville et al. Reference Fonville, Giampietro, Williams, Simmons and Tchanturia2014).
Some structural alterations reported in AN are thought to be related to stage of illness (e.g. early versus chronic), lowest illness-related attained BMI and current BMI status (as can be expected since low BMI is a criterion for AN diagnosis) (Roberto et al. Reference Roberto, Mayer, Brickman, Barnes, Muraskin, Yeung, Steffener, Sy, Hirsch, Stern and Walsh2011; Fonville et al. Reference Fonville, Giampietro, Williams, Simmons and Tchanturia2014; Fuglset et al. Reference Fuglset, Endestad, Landrø and Rø2015; King et al. Reference King, Geisler, Ritschel, Schober, Seidel, Roschinski, Soltwedel, Zwipp, Pfuhl, Marxen, Roessner and Ehrlich2015). Consequently, it is unclear whether the pattern identified by the model expresses trait or state features of the illness. However, the patient population of this study is characterized by a short duration of illness; therefore our findings are not likely to be due to effects of prolonged/chronic illness. A longitudinal study is currently underway with the aim of investigating structural changes related to BMI increase after treatment as well as testing whether individual differences in the model probability among AN patients at the time of diagnosis will predict course of illness and response to treatment.
The relationship between the model probability and drive for thinness and BMI shows that the model is able to capture relevant dimensions of AN at an individual subject level. The partial correlation between the probability score and drive for thinness was close to significance after controlling for BMI (r = 0.35, p = 0.06). Therefore, it is plausible that the relationship between the model probability and the psychological dimension of drive for thinness is independent of weight. Noticeably, the two subjects in the healthy comparison group that were misclassified by the model as anorectics had the highest drive for thinness scores among healthy controls (10 and 6, respectively), and their BMIs were within normal limits. These findings support current efforts to integrate dimensional models to the categorical diagnostic systems in use with the aim of elucidating underlying neurobiological mechanisms (Cuthbert, Reference Cuthbert2014).
The model's selection of the choroid plexus was unexpected and the accuracy, sensitivity and specificity dropped to 57, 53 and 60%, respectively, after removing this region from the model. This finding suggests that drive for thinness might be encoded within a distributed network of brain regions, which makes a multivariate data analysis approach most appropriate as compared with a univariate approach.
Neuroimaging research in eating disorders has substantially increased in the last few years (Eddy & Rauch, Reference Eddy and Rauch2011), but it has so far failed to have an impact on clinical practice. The identification of neuroimaging-based biomarkers for anorexia could present significant potential for clinical translation: individually targeted treatments, a more accurate individual prognosis and the prediction of clinical response to treatment are paramount to find new approaches in treatment of eating disorders and improve outcomes (Schmidt & Campbell, Reference Schmidt and Campbell2013). An example of a possible application could be to use neuroanatomical indicators of a more severe illness to initiate more intensive or combined therapies at an earlier stage (Fu & Costafreda, Reference Fu and Costafreda2013). Techniques like LASSO that provide significant information at an individual level are ideally suited to provide an added value to clinical management and decision making.
Some limitations of this study must be noted. Our sample of AN patients were mostly restricting AN subjects (AN-R), with three binge-purging AN subjects (AN-BP). Although this might have introduced some degree of inhomogeneity in the sample, the presence of substantial differences between AN-R and AN-BP is still debated. These two subtypes might reflect variations on a continuum instead of distinct categories (Murphy et al. Reference Murphy, Straebler, Cooper and Fairburn2010; Olatunji et al. Reference Olatunji, Broman-Fulks, Ciesielski, Zawilinski, Shewmaker and Wall2012). The small sample size is also a limitation. Some of our results (i.e. the choroid plexus contributing to the model) have not previously been reported in the literature and require replication. However, the sample of AN patients recruited for this study has several desirable features, among which the absence of relevant psychiatric co-morbidities, no psychopharmacological or psychotherapeutic previous treatment, and a short illness duration, that allowed us to exclude the effects of chronic illness in interpreting the results. Also, strong points of the study are the use of FreeSurfer to implement an automated well-validated procedure (Fischl et al. Reference Fischl, van der Kouwe, Destrieux, Halgren, Ségonne, Salat, Busa, Seidman, Goldstein, Kennedy, Caviness, Makris, Rosen and Dale2004, Reference Fischl, Stevens, Rajendran, Yeo, Greve, Van Leemput, Polimeni, Kakunoori, Buckner, Pacheco, Salat, Melcher, Frosch, Hyman, Grant, Rosen, van der Kouwe, Wiggins, Wald and Augustinack2009; Fischl, Reference Fischl2012; Cardinale et al. Reference Cardinale, Chinnici, Bramerio, Mai, Sartori, Cossu, Lo Russo, Castana, Colombo, Caborni, De Momi and Ferrigno2014) and the use of a multivariate machine learning approach. Future studies will consider machine learning algorithms able to account for non-linear relationships (e.g. non-linear support vector machines) as compared with a LASSO which is linear.
In summary, we report highly accurate prediction of individual subjects with AN using T1 MRI scan data. The model presented here assigned a probability score to each individual which correlated with drive for thinness and BMI. Individual measures derived from brain structure with a machine learning approach appear promising for clinical translation: future studies should investigate the relevance of these measures for predicting illness course and response to treatment at an individual subject level, in order to make neuroimaging approaches relevant in the clinical management of anorexia.
Supplementary material
For supplementary material accompanying this paper visit http://dx.doi.org/10.1017/S0033291715000768
Acknowledgements
The present study was sponsored by the ‘Compagnia di San Paolo’ Bank Foundation with the ‘Bando Neuroscienze’ grant (code: 3929IT/PF2008.2242) assigned in 2009 to S.F. and F.A. and by IARPsrl generic 20BW320110719008513915033 Casale Monferrato ‘Resistenza ai trattamenti nei DCA’. The study was also supported in part by the Pat Rutherford, Jr. Endowed Chair in Psychiatry (J.C.S.).
Declaration of Interest
J.C.S. has participated in research funded by Forest, Merck, BMS and GSK and has been a speaker for Pfizer and Abbott. All the other authors report no biomedical financial interests or potential conflicts of interest.