1 INTRODUCTION: UNEQUAL LAND, UNEQUAL VOTES, POOR SCHOOLING?
Latin America has long been known for its inequality of wealth and income relative to nations in other regions (Chenery et al. Reference Chenery1974; DeFerranti et al. Reference Deferranti, Perry, Ferreira and Walton2004; Baten et al., Reference Baten and Mumme2010). It has also been known for lagging behind in the development of mass education. Are the two long-perceived tendencies of Latin America real, have they been changing, and are they causally linked? The conventional view answers all three questions in the affirmative. International agencies and academics have agreed that Latin America’s inequality of non-human capital and of political power yields less education and more unequal human capital, thus reinforcing the initial inequalities (Plank Reference Plank1996; Plank et al. Reference Plank1996; Mariscal and Sokoloff Reference Mariscal and Sokoloff2000; DeFerranti et al. Reference Deferranti, Perry, Ferreira and Walton2004; Ioschpe Reference Ioschpe2004; Frankema Reference Frankema2009; Engerman et al., Reference Engerman, Mariscal and Sokoloff2009; Nugent and Robinson Reference Nugent and Robinson2010; Reference WegenastWegenast 2010).
The conventional view has been spread most widely among scholars by the research team of Stanley Engerman, Elisa Mariscal and Kenneth Sokoloff (hereafter EMS). They have summarized and tentatively explained the lag in Latin American schooling behind that of the Canada and the northern United States. Reaching back to the colonial era for root causes, they argue that low and unequal education, like other symptoms of Latin American inequality in the 19th and early 20th centuries, stemmed from inequality in political power and landownership. They conclude that
«although investment in schooling is strongly and positively correlated with per capita income over time and across countries, much variation remains to be explained [by forces other than income]. Moreover, the extent of inequality in political power, as reflected in the proportion of the population who can vote, does seem to be associated with lower literacy and schooling rates» (Engerman et al., Reference Engerman, Mariscal and Sokoloff2009).
Reinforcing this line of suspicion, Frankema (2009) has now compiled a fuller database on Latin America’s unequal landholding, supplementing the EMS evidence on unequal voting rights for the period since the 1870. He has also magnified the apparent lag, and the apparent inequality, in Latin America’s education by exposing a bias in the enrollment data. The Latin American enrollments not only are a bit lower than in other regions, for a given income per capita, but also consist of a higher share of grade repeaters and dropouts, and a lower share of true primary-school completers. He thus finds that the postwar catching-up in Latin American enrollments may hide a loss in educational quality, relative to other continents (Frankema Reference Frankema2009, Chs 3 and 4).
This paper does not overturn the emerging consensus, but instead arms it with evidence allowing a firm rejection of some competing ideas and giving a clearer view of how Latin American schooling is evolving. This section begins by noting some empirical vulnerabilities of the consensus view that unequal landholding and unequal voting caused low and unequal schooling and summarizes the paper’s findings, which offer further defense for the emerging consensus. Section 2 describes a simple method for extracting the most relevant tests from a broad historical record that typically defies state-of-the art econometric testing. These relevant tests are performed on education vs. income anomalies, of which there were several in Latin American history. Section 3 convenes the historical court by introducing the usual popular suspects and the kinds of «fingerprint» evidence that could indict each of them. Sections 4 and 5 present the fingerprint evidence most relevant to the exposed anomalies. They also liberate the conventional view from its dependence on cross-sections by utilizing the recent differences in Latin American countries’ democratization and schooling, leading us to a new set of conclusions and research agenda.
For all the impressive circumstantial evidence supplied by the EMS team and others, the prosecution’s case against the Latin American elites is not yet persuasive. It suffers from four main vulnerabilities.
First, the evidence is rich in contrasts between countries but has not explored changes over time. While EMS tend to emphasize persistence in inequalities over the five centuries since the conquistadors, other scholars are beginning to argue that there were dramatic movements in income inequalityFootnote 1. While the time-series evidence is still being developed, one should expect that the movements both differed by countries and had different effects on education.
Second, the cross-sectional contrasts have not been explored as fully within Latin America as they have been between Latin America and the OECD leaders. Over such a long-time span, surely differences in institutional barriers should have retarded education much more in some Latin American countries than in others. Nugent and Robinson (Reference Nugent and Robinson2010) have emphasized such contrasts between two pairs of countries (Costa Rica and Colombia vs. Guatemala and El Salvador), and one suspects that other contrasts may deserve to be developed.
The third vulnerability is the literature’s failure to hold income constant when making comparisons. The positive feedbacks between average income and educational attainment are infamously strong, yet historical data almost never allow us to estimate the structure of these interactions with suitable statistical instruments. Not knowing the true slopes of interaction between income and education, it is hard to be sure about the influence of any other causal force (e.g. elite control of government or social exclusion of large groups from more skilled occupations).
The final vulnerability springs from the EMS solution to this problem of statistical estimation. They have used a reduced-form approach, which links the colonial and early republican inequalities of landownership and political power directly to 20th century lag in education. One drawback of the reduced-form approach is that we lack a test of the intervening links in the imagined chain of influence. If the hypothesis is correct, we should be able to find that more serious inequalities were accompanied by lower, and more unequal, public expenditures on behalf of education. Following this money trail leads us to much firmer conclusions.
This paper offers several improvements that solidify the basis for blaming Latin America’s education lag on its concentration of wealth and power:
(1) Focus on historical anomalies: Extra empirical leverage is gained by focusing on those pairs of countries for which the richer country lags in education. In such anomalous cases, it is clearly not income that is holding education, and we can turn to other suspects. Two of the leading anomalies introduced here are the education lag of rich Venezuela behind most of its poorer neighbors since 1900 or earlier, and the lag of Argentina behind poorer parent countries, and even behind much of Eastern Europe and Japan.
(2) Rejection of alternative explanations of the Latin lag: Latin American did not lag in education attainment because of any lower market demand for schooling, or higher reliance on child labor, or greater discrimination against educating girls or lower charitable giving.
(3) Public expenditures on primary education: Latin America offered less tax support per child of school age than countries on other continents with the same incomes. This shortfall in tax support for mass schooling has been the region’s clearest failing. Its source appears to be the inequality of political voice, as the conventional view has imagined.
(4) Favoritism of higher education over primary and secondary: Relative to the leading OECD countries, most Latin American countries have subsidized higher education to a degree that is inegalitarian and possibly bad for economic growth.
2 FINDING EDUCATION OUTPUT ANOMALIES IN THE PAST
An economist’s preferred technique for quantifying the influence of inequalities on education performance would be a randomized natural experiment based on demonstrably exogenous institutional shocks. While future studies will expand our supply of such scientific experiments, most of the human record does not lend itself to such techniques. The EMS team and others have turned instead to well-documented international correlations between economic–political inequalities and low levels of education. This approach immediately confronts the simultaneity of education and income as joint products of many third variables, including the inegalitarian Latin American institutions they seek to indict. Given the strong education–income feedbacks, past regimes can use what we can call the poverty defense. Their public investments in education may have been so low simply because their incomes were so low for reasons other than poor education, such as bad historical or geographic luck.
To avoid throwing away all history that does not yield data for ideal econometric testing, we should at least pick some low-hanging fruit. Many historical contrasts yield education–income anomalies, in which an «impoverished and sophisticated» country A has produced more education than a richer and less-educated country B. In such cases, we can rule out any poverty defense on behalf of country B. One cannot claim that it was less educated because it had lower incomes due to poorer geographic luck or a bad draw from history. Rather the only reasons for its having produced less education than country A must relate to the direct determinants of education itselfFootnote 2.
To find such anomalies in history, a first step is to clarify how the «outputs» and «inputs» of education are to be measured, given the limitations of the data. The output concept we would prefer, namely the contribution of the education sector to human welfare, including its contributions to health and psychic income as well as to earnings, cannot be captured in historical data. For Latin America, since the 1960s, we must be content with measuring output as the years of educational attainment of adults, supplemented with a few test scores for primary and secondary students since the 1990s. The output is even more elusive for earlier decades, forcing us to use enrollment rates as our best proxies for cohorts’ eventual educational attainment.
On the input side, too, Latin American data are thinner before the 1960s. Lacking sufficient data on the length of the school year or on the quality of instruction, we can only use the teacher/pupil ratio or expenditures per pupil or per child of school age. To focus on the political economy that seems central to explaining differences in outcomes, the sections that follow will focus on the expenditure measure of inputs, and particularly on expenditures made by local and national governments. Looking at the tax-based part of expenditures will not really narrow our focus, because of what an economist might call «history’s corner solution». Every country that has achieved prosperity — say reaching $10,000 of GDP per capita in 1990 international PPP dollars — has done so with a primary-education system that is paid for predominately by taxes, usually at the local government level. Thus, our causal investigation will follow not only the money, but, especially also the public money, revealing some wide differences in expenditure rates.
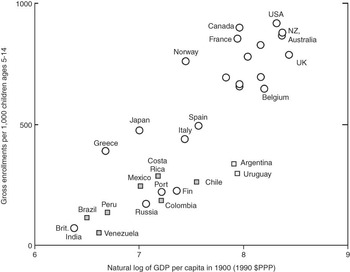
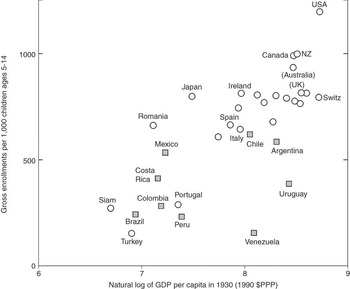
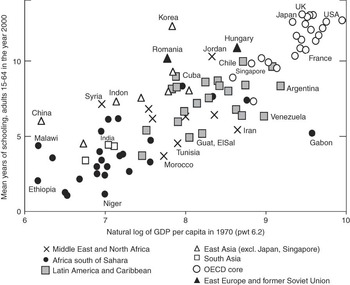
Using the output measures, Latin American history allows us to identify several education–income anomalies since the late 19th century. Figures 1–3 compare the national enrollment rates with income levels across the 20th century. Not surprisingly, the general correlation between enrollments and income is clearly positive. Yet some persistent education–income anomalies also emerge, in 1900 (Figure 1), in 1930 (Figure 2) and late in the century (Figure 3). Latin America as a whole tended to lean toward the lower right — that is, it tended to enroll a smaller share of children in school than did poorer countries in other regions. We can also cast certain countries within Latin America in the anomalous role of «country B», the country with lower education despite higher income per capita. The relatively rich Southern Cone countries are shown in less favorable light here than in the EMS writings, which simply noted that they had relatively high education by Latin American standards, without taking account of their income levels. In 1900 and again in the 1930 data, Argentina and Uruguay had lower enrollments than did several poorer countries, including the Mediterranean countries that sent the Southern Cone most of its settlers. Thus, the position of the Southern Cone countries in education history depends on what other countries we compare them with. On the global level, they have tended to be slight under-achievers relative to countries in other regions with the same or lower incomes.
Primary and secondary enrollments per child 5-14, in 1900
Sources and notes: The estimates of GDP per capita in 1900 and 1930, expressed in 1990 international PPP dollars, are those of Angus Maddison (1995 and 2001). The enrollment data are derived from other sources in Lindert (2004, vol. 2, Appendix A), from the Bank’s post-1815 database and from Benavot and Riddle (1988), in that order of priority. In some cases where it was impossible to obtain the 5-14 population denominator from the Lindert’s sources or from the Banks, I used the school-age population denominator from Benavot and Riddle, introducing some differences in the ratio definition.

Primary and secondary enrollments per child 5-14, in 1930
See the sources and notes given for figure 1.

Enrollments accumulated across the late twentieth century
Sources and notes: The estimates of GDP per capita in 1970 in 1990 international PPP dollars are taken from the Penn World Tables, version 6.2, measure RGDPCH. The same source is used for GDP per capita in Figures 5–7. As a proxy for enrollments sometime around that 1970 date, I used the educational attainment of the 15-64-year age group, as measured 30 years later, in 2000. These year-2000 data are drawn from http://soto.iae-csic.org/Data.htm, accessed June 18, 2009. This source is cited, and the estimates explained in Cohen and Soto (2007).

An even worse performer on the education front, given its income, was Venezuela in 1930, after its dictatorship had begun to reap oil revenues. Venezuela’s school enrollment rates in the 1930 were no higher than those of much poorer Turkey, and also below those of Mediterranean Europe, as well as such distant poor countries as Japan, Romania and even Siam (Figure 2). Closer to home, Venezuelan children have remained consistently less schooled than those in at least five poorer neighbors: Colombia, Costa Rica, Guyana, Trinidad-Tobago and Mexico.
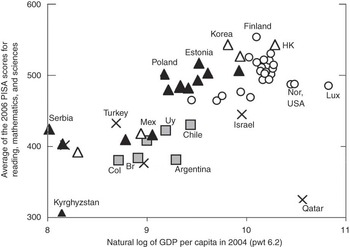
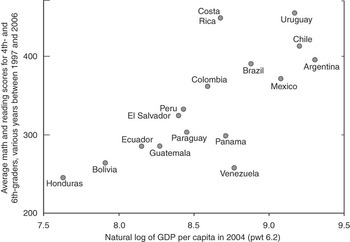
By the end of the second millennium, several countries had reached full enrollment at the primary level, so that international differences in human capital came to depend more critically on the quality of primary and secondary schooling than on the quantity of years over which the average student enrolled. In the emerging 21st century environment, indirect indicators of educational quality, such as curriculum achievement test scores, have come to carry more weight. Latin America is just beginning to participate in tests that are internationally comparable. Figures 4 and 5 show some early results. In the rapidly expanding project on International Student Assessment (PISA) tests, the Latin American countries scored poorly, and Argentine students in particular tested lower than their counterparts in some poorer countries in Eastern Europe and Turkey (Figure 4). To be fair to the few Latin American countries that participated in the OECD-based PISA tests, however, one should compare them with countries that were not sampled in the PISA examinations. Fortunately, Eric Hanushek and Ludger Woessmann have collected some internationally comparable examination results from several Latin American countries. While these early test results are a crude amalgam of tests taken at different dates between 1997 and 2006, they tell some clear stories illustrated in Figure 5. There is again a clear positive relationship between GDP per capita and children’s average test score, tracing a line from Honduras to Chile. The most anomalous departures from this line are the high score of Costa Rican children and the poor marks of Venezuelan children. Even in the 21st century, Venezuela’s sixth graders have received the second-lowest national average sample score in mathematics and reading out of sixteen countries. Thus, the recent test scores, like the early enrollment numbers, emphasize that the English language literature on Latin American education needs to pay more attention to VenezuelaFootnote 3.
PISA Averages for 15-year-olds in 2006, vs. income levels in 2004
Sources and notes: The average reading, mathematics and science achievement scores of 15-year-olds are from the PISA 2006 examinations (OECD, PISA 2007).

Reading and math test scores in latin america 1997-2006
Sources and notes: The reading and mathematics scores are combinations of different LLECE 1997 scores and SERCE 2006 scores, from Hanushek and Woessmann (Reference Hanushek and Woessmann2009b, Table A1).

3 THE USUAL SUSPECTS AND THEIR FINGERPRINTS
The anomalies are so striking that they can be explained by applying common sense, historical study and very basic economics. Infact, these tools will not yield firm quantitative estimates of the causes of the differences in education output, but in some cases they yield firm qualitative conclusions, linking a clear positive or negative difference to a single dominant cause.
Using this simple toolkit begins by lining up the forces most often suspected of holding back education. The suspects are grouped into demand-side and supply-side forces in the market for primary schooling. This section comments only on a few variables most relevant to the debate over Latin American inequality in educationFootnote 4.
The most obvious demand-side force that might have retarded education for millennia would be a lack of demand for educated occupations requiring literacy, numeracy and other skills that schools might help to deliver. We might suspect that Latin America’s schooling lagged behind that of other regions, because its economy had no jobs that called for schooling. One might blame the Latin American market economy if the backward state of its technology somehow forced people to make their living with raw labor. Such low demand for skills should have lowered the adult wage gains from education, lowered all rates of return on education and raised the relative child (unskilled) wage.
Another force, lower adult life expectancy in country B than in A, could have shortened the average work career and held down the rates of return on schooling, even though it may also have bid up the wage premium by supplying less-skilled labor per year. This prolonged restraint was removed only with the arrival of modern health improvements. One background reason for why educational attainment is higher in Latin America today than in England or America back in the early 19th century, with roughly comparable incomes, is that Latin Americans can now expect to use their skills over longer careersFootnote 5.
It is particularly natural to attribute the long delay of formal schooling to fundamental social attitudes toward schooling. This rubric is meant to include a host of inertial instincts that parents might have, such as «Your grandparents didn’t need schooling to live a decent life, nor did I, and neither do you» or «Don’t try to move into a strange life where you’re not wanted». If it were the dominant retarding force in context B, then we should expect to see a persistence of high skill premiums and high rates of return to extra schooling for those few who obtained it.
Discrimination is also a leading suspect, on both the demand and the supply sides of the market for primary schooling. On the demand side, it has checked demand for schooling when employers or powerful competing «insider» groups deny «outsiders» their free access to jobs that would use the schooling. On the supply side, discrimination can also be practiced in the education admission process, by restricting entry from any of the same groups of outsiders. Either kind of discrimination lowers the use of persons with high ability, and drags down outsiders’ incentive to get that schooling.
Supply-side discrimination would show up in the data, however, in a deceiving way. The measured skilled wage premiums and the rates of return to education would all look higher, even though the true wage rates and rates of return are lower for those denied access. The literature on rates of return to education has repeatedly reminded us of this point when discussing «screening» and the use of best schools’ connections to allocate and restrict top jobs in government or guilds. Where screening is based on ability (innate talent plus parental background), the marginal product of schooling looks deceivingly high because those outside the margin would be less productive. Even in the less ability-biased kinds of discrimination, the returns can still deceive, because competition would have bid down the rates of pay being protected by discriminatory education. When discrimination is a prime suspect, the historian and economist must decide with the help of other clues. In some cases, that is easy. For example, discrimination against female education retards education and output in ways that are easy to quantify once one has data on education and wages by gender.
The suspect that will end up being featured in this paper, namely the relative denial of tax support for basic education, leaves a distinctive set of fingerprints. Without tax support, the private returns to schooling will be lower and the restricted group receiving the schooling will enjoy higher pay premiums. Society as a whole will also get lower returns. Unlike other suspected causes of low schooling, the denial of tax support in one setting relative to another will leave its traces in relatively available fiscal data.
A fundamental reason for featuring the local governments’ supply of tax money is the fact that capital market failure is so fundamental when it comes to paying for children’s education. The poorer a household or a whole society, the harder it is to gain the trust of private lenders, for education or any other long-term investment. Other forces must intervene to remove these constraints. One might wish that improvements in the private financial sector would have provided the keys to financing schooling, yet history offers relatively little hope of a low-risk premium on private student loans for the masses. Rather the crucial capital for mass private education has been provided by tax-based subsidies from the government. Hence history’s corner solution: no country has achieved universal primary education without relying mainly on taxes. Thus, for primary education, the issue is why some countries have been slower than others in supplying the tax funding that would solve the credit constraint for primary education.
Each of the usual suspects leaves its set of fingerprints. The rest of this section reviews the three main types of fingerprint evidence, with quick summary comments on their role in 20th century Latin America.
3.1 Market Rates as Fingerprints
3.1.1 Child wages
The opportunity cost of school children’s foregone earnings has dropped with economic development, a rough tendency that partly explains the long delay in educational attainment. We know that it dropped as nations became rich, because the value of hired child labor became nearly zero by law. Once a nation passed laws making schooling mandatory, there was no employment opportunity during school hours and therefore no opportunity cost. Before the passage of compulsory schooling laws, opportunity costs loomed large as a share of the total cost of going to school. In most of David Mitch’s calculations for Victorian England, the opportunity cost was four-fifths of the total cost of attending school. In Lewis Solmon’s calculations for the United States in 1880 and 1890, the lost wages were about half the total cost of schooling in the countryside, and well above half in the cities (Solmon Reference Solmon1970, Reference Solmon1975; Mitch Reference Mitch1982, Reference Mitch1984, Reference Mitch1992). Awaiting more quantitative data from other settings, we can only conclude that the decline of child labor opportunities was an important part of the rise of schooling. Still, as we shall see in rate-of-return calculations below, even with the higher estimates of the opportunity cost of child labor, extra schooling brought high returns to all parties, leaving us to explore why those returns were often passed up.
3.1.2 Direct school costs and the relative price of teachers
Did most of world history deliver so little education because schooling of given quality was more costly and less affordable for a typical family than it has become in today’s rich countries? Unencumbered by data, our intuition could run in either direction. Perhaps teachers were an expensive elite in less-developed times and regions, and have become cheaper. Or perhaps the opposite, if the quality of schooling declined and/or teachers became scarce with development. We are still far from a global or even multinational economic history of school costs, and equally far from a global history of teacher pay, the key input price in this sector. Nor is it easy to relate relative teacher wage rates to relative unit costs unless one can hold quality constant.
A straightforward answer requires measurement of the average cost of a pupil’s week or month in school, relative to a standard income. Such data, in a form that is comparable across countries or decades, are hard to find for any time before the 1980s. It is hard to correct any time series on school costs or fees for the upward drift in quality caused by the historical lengthening of the school year, improvements in teacher quality and pedagogy and class size reduction. The problem seems soluble, especially with US historical data, but only after much careful handlingFootnote 6. Since the 1980s, the international agencies (OECD, UNESCO and the World Bank) have made international comparisons. There are noteworthy differences between countries in unit costs, relative teacher pay, class size and test scores. Daily school costs per child seem to rise over the course of economic development. The most likely reason, however, is a rise in school quality and not a rise in the price of a given quality of schooling. Curriculum achievement test scores are clearly higher in the richest and highest-spending countries than among test-taking students in developing countries, suggesting an upward drift in the quality of deliveryFootnote 7. Yet despite this rise in quality, the direct cost of schooling of given quality, relative to general wage rates, has no clear trend over the course of development.
3.1.3 Wage premiums
Measuring the percentage gain in adult pay that comes with extra education can help us reach an early decision on the top-row suspect, namely a low market demand for skilled labor in the less-schooled settings. As noted, many might suspect that there has been less schooling for centuries because less-developed settings had less demand for skilled labor. Perhaps these settings lacked skilled-intensive technology or had low tastes for skilled-intensive goods before, say, the Industrial Revolution or the arrival of direct foreign investment from more advanced countries. Had it existed, the lower demand would have manifested itself in the form of a lower skilled-wage premium. Yet, as we shall see, Latin American countries that lagged in education had higher, not lower, wage markups for the higher-skilled jobs, suggesting no weakness in market demand for the fruits of education.
3.2 Rate-of-Return Fingerprints
We can also make careful use of rates of return on education, both as concepts and as empirical measures produced by a scholarly cottage industry in the late 20th century. The rates of return have typically been used as clues about underinvestment or overinvestment in formal education. Somebody (private and/or public entities) has underinvested in the sense of lowering GDP if the rate of return is too high, and overinvested if they have driven the rate of return to levels that are too low.
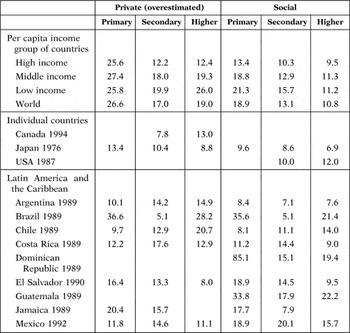
The vast literature measuring postwar rates has revealed important patterns that probably held throughout modern history. Table 1 highlights two patterns. First, the social rates of return are usually higher in poorer countries, as one might expect from the greater severity of credit constraints in poor settings. This seconds a suggestion made by other authors in the emerging economic history of wage structure: the economic gains from education were probably even higher in the past than they are today. Second, the rate of return is usually higher at the earlier levels of education. The social return on primary education exceeds the social return on higher education, even without externalities, which should have been larger in primary schoolingFootnote 8.
AVERAGE RATES OF RETURN TO INVESTMENT IN EDUCATION BY LEVEL, 1970s-1990s, BY PER CAPITA INCOME GROUP (INTERNAL RATES OF RETURN, IN PERCENT PER ANNUM)

Source: For rates of return, Psacharopoulos and Patrinos (Reference Psacharopoulos and Patrinos2004, Table A1).
Notes: High-income group: GDP per capita at or above $9266 in 1990 PPP dollars, with group mean of $22,530.
Low-income group: GDP per capita at or below $755, with mean of $363.
The middle-income group had a mean income of $2966, and the world mean was $7669. The private rates are overestimated because they assume zero taxation of the extra earnings gained from education.
3.3 The Relative Public Input Fingerprints
Next, let us turn to a pair of tax-support clues that allow us a direct view of political and fiscal efforts in support of education. The first clue is a support ratio defined as:Footnote 9

This ratio scales the generosity of the subsidy in terms of the population’s ability to pay. Such a measure is already displayed in publications by the OECD and UNESCO, as well as in the scholarly literatureFootnote 10. What is the norm for this ratio? If it is lower in setting B than in higher-education A, is that a bad thing for B? The answer will depend on whether or not A has overinvested in subsidizing and delivering primary education. The empirical literature tends to approve of the levels of primary-education support in today’s most-educated societies. Granted, there is a hot debate over whether adding more money would do any good in the public schools of the United States and other OECD countries, with Eric Hanushek’s amassing evidence for the null hypothesis, and there is good reason to wonder whether the subsidies need to be restricted to publicly-supplied schooling (Hanushek and Woessmann (Reference Hanushek and Woessmann2008, Reference Hanushek and Woessmann2009). Yet, nobody in these debates has mustered evidence in favor of actually cutting primary school subsidies or in favor of cutting attendance toward the lower levels of the past. It seems safe, when comparing this ratio between two settings, to presume that the more educated setting A has not yet reached the point of overinvesting in primary education, especially since those rates of return continue to run so high (see Table 1).
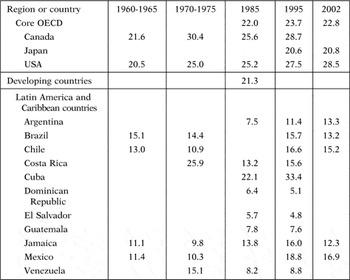
A quick examination of postwar rates of public support (Table 2) for primary schooling helps to bring this simple public-expenditure fingerprint into focus. Globally, those countries whose children went to school less and got lower test scores (as in Figures 4 and 5) tended to be countries that were less willing to spend taxes even in relation to their average incomes (Table 3). Some of these countries were poorer, of course, allowing them the excuse that they simply could not afford to spend as high a share of their income on public education. Yet, this poverty defense falls short in the cases in which richer countries chose to spend less on public schooling. We will find that most of history’s education–income anomalies were such cases, with richer countries achieving less education largely because they spent less of their incomes on taxes for schools.
PRIMARY-SCHOOL SUPPORT RATIOS IN CORE OECD COUNTRIES AND LATIN AMERICA 1960-2002

Sources: OECD Education at a Glance (1992, p. 63) (primary school only); idem (2005, pp. 172-173); IMF, International Financial Statistics (various years); and UN (2001) for age distributions. The «1985» figure for the OECD core uses data from 1988.
The «1995» figures for the OECD and for developing countries use data from 1999.
The figures for Canada and the United States aggregate secondary education with primary. Argentina’s figures use from 1984-1985 and 1994-1996 as «1985» and «1986».
Notes: The support ratio = (public «current» primary-school expenditures per pupil)/(GDP per person 15 or older).
See also the notes to Table 3.
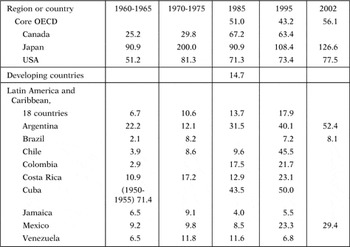
WHICH POSTWAR GOVERNMENTS HAVE SHORT-CHANGED PRIMARY EDUCATION RELATIVE TO HIGHER EDUCATION?

Sources: UNESCO, World Education Report (1991-1998); OECD Education at a Glance (1992, p. 63); Ioschpe (Reference Ioschpe2004, p. 184); and Claudia Goldin’s compilations in Carter et al.(2006, vol. 2). I am indebted to Ewout Frankema for his calculations for 1960-1965 through 1990-1995, from his paper-in-progress on «Mass Education in Twentieth-century Latin America: A Quantity-Quality Trade off?», which used UNESCO data. The 1960s and 1970s data for Brazil are my own calculations from the UNESCO Statistical Yearbook and IMF International Financial Statistics.
Notes: Each cell number is a ratio of public support of primary education per pupil, as a percentage of public support of higher schooling per pupil. This percentage should be at least 50 (see text).
Most of the expenditure figures refer to current expenditures. They omit tax breaks and some household subsidies for education, and they omit capital costs.
Notes on years covered: The years covered in «1960-1965» and «1970-1975» vary from country to country. The year «1995» is really 1999 in the case of core OECD, Brazil and developing country average. For Chile, the 1970-1975 figure refers to the post-coup year 1975 only.
For the United States, the expenditure-per-student denominator ratio combines primary and secondary public schools. The 1985 figure refers to a 1980-1985 average in the cases of Argentina, Chile, Colombia, Cuba, El Salvador, Guatemala, Mexico, Nicaragua, Panama, Paraguay, Uruguay and Venezuela. For Cuba, the 1995 figure is also an average for 1990-1995.
The OECD’s numbers for 2002 are based on full-time school year equivalents.
For want of data on private expenditures, the 2002 data for Brazil are for total expenditures, which were predominantly but not completely public. For all other countries in 2002, expenditures for primary schooling had to be allocated between private and public according to the ratios given for the larger aggregate of primary, secondary and non-tertiary post-secondary education.
The figures for expenditures on tertiary institutions generally include expenditures on research and development, along with expenditures on instruction. For 2002, the instructional shares of the total tertiary budgets were 79% for core OECD countries and 89% for the United States.
The second selected support measure also reveals much about education finance in the 20th and 21st centuries. It is a double ratio, by level of education:

where tertiary refers to university education and other training beyond secondary school. The lower this ratio in country B relative to country A, the more favor given by B’s governments to higher education.
Again, the ratio cannot be used to judge education policies until we have a norm, a «best» balance between subsidizing primary education and subsidizing tertiary. One guide is that the case for externalities from education spending has been stronger for primary than for higher education. It was primary education that Adam Smith, Thomas Jefferson and Milton Friedman considered most worthy of subsidy on the ground that mass schooling created citizens and social order, and the econometric evidence cited above also emphasized spillovers from primary and secondary education. Granted, institutions of higher learning in the United States and a few other advanced countries generated great spillover benefits from their research and development. Yet the returns from the instructional part of higher education are arguably more privateFootnote 11.
By itself, the fact that externalities might be greater for lower levels of education does not tell us the «best» balance of public subsidies. Yet if we accept the notion that the per-student externalities could reasonably be larger at the primary level, then the «best» value of the primary/tertiary ratio should not be below one in any country. Alternatively, in the OECD countries this ratio tends to be one-half (50 per cent), as shown at the top of Table 3. To err on the side of acquitting too many governments of developing countries, a later section will assume that the efficiency norm is 50 per cent.
4 EXPLAINING THE ANOMALIES
With the help of the fingerprint guidelines, this section and the next offer additional perspectives on the Latin American lag in education. The first task is to acquit some suspects, after which we «follow the money», using the two kinds of relative public input fingerprints defined in section 3.3.
Three standard suspects cannot have been responsible for the average Latin American lags in education outcomes. First, discrimination against female students has never been as great in Latin America as in South Asia and the Middle East. Second, child labor has also been much less conspicuous in Latin America. On both of these points the historical data sources agree with the most recent data.
The third suspect to be acquitted is the notion that education was delayed because Latin America’s economy had a relatively low demand for skilled labor. As noted earlier, it might seem natural to suspect that in all less-developed contexts little education was sought because the demand for skills was still not strong enough. Yet the wage-premium fingerprints reveal no relative lack of market demand for the skills of more educated workers in any less-developed setting, either in Latin America or in elsewhere. We know this because in less-developed settings the relative incomes of employees with higher-salary occupations, such as physicians or bookkeepers or teachers, are higher. Richard Freeman and Remco Oostendorp show this for most Latin American countries, and for low-income countries around the world, in the period 1988-1992. Ten out of twelve Latin American countries had higher percentage wage gains for more skilled occupations than any of the main OECD countries. The only two exceptions, with lower-skilled-wage premiums, were Costa Rica and Mexico, two of the region’s better education performers (i.e. better, given their income levels)Footnote 12. Less-educated countries clearly had a demand for the skills that education would have helped to supply.
Our next task is to extend the implication of Table 2 that in recent years every data-supplying country in Latin America and the Caribbean — except for CubaFootnote 13 — gave less tax support to each primary-school student than the OECD standard of 20-29 per cent of the level of GDP per adult. Which country has most under-funded primary education, given its income level, and how has the level of public support evolved across the 20th century?
The most egregious postwar case of low subsidization of primary schooling in Latin America is that of oil-rich Venezuela. Here, even more than in other countries, the culprit seems to have been a political bias against mass education. That bias was spotlighted back in 1959, when Shoup et al. (Reference Shoup1959) published their task-force study of the whole fiscal structure of Venezuela:
«Education has such a low priority in the national investment program that the level of education relative to income is one of the lowest in the world. Further progress in the non-petroleum sectors, particularly industry, agriculture, and government, will depend heavily on better education.» (Shoup et al. Reference Shoup1959, p. 409)
So they concluded in 1959, at the time of 20th century Venezuela’s first sustained switch from caudillo rule to democracy. Yet Venezuela still has not caught up, despite three rounds of sudden enrichment from oil price hikes.
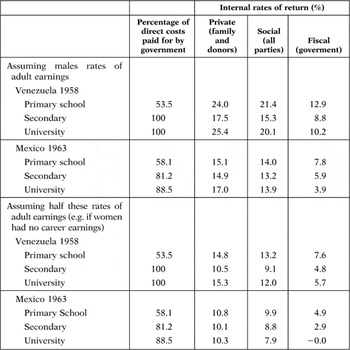
So large were the human-capital windfalls passed up by Venezuela’s politicians that they may even have missed a high rate of return to government itself. That is, the fiscal rate of return may have exceeded the opportunity cost of funds. The Venezuelan data in Table 4 suggest that the underinvestment may have reached this extreme, to judge from data around 1958. The cost of public funds for investments like education was thought to be about 10 per cent. On the assumption that people worked full time after their education, not only the rest of society but also the government itself could have reaped a net gain from extra investment in any level of education (far right column). On the pessimistic assumption that people worked only half time, the same would not be true, so that the lost social gains might not have translated into losses for government itself.
ESTIMATED RATES OF RETURN TO INVESTMENT IN EDUCATION, VENEZUELA 1958 AND MEXICO 1963

Sources and notes: The main source for Venezuela is Shoup et al. (Reference Shoup1959), and for Mexico the works of Martin Carnoy (Reference Carnoy1964, Reference Carnoy1967a, Reference Carnoy1967b). These are supplemented with life-table survival rates based on data from 1959-1961 for Mexico and 1963 for Venezuela.
Carnoy conducted his own survey of a few thousand urban Mexican workers and their family members in 1963, and based his published rates of return on these micro-data. By contrast, Shoup et al.(1959) based their estimates of present values and rates of return for Venezuela on aggregate average relationships of earnings to occupation, age and schooling.
Both sets of data have been reworked here, however, to refine the fiscal side of education.
My retention of most of Carnoy’s assumptions yields rates of return in the same range as his. For Venezuela, however, my rates of return are below the eye-popping estimates announced by Shoup et al.(1959). The main reasons for the discrepancy are (a) that Shoup and collaborators omitted any opportunity costs of the student’s time; and (b) they omitted indirect taxation (usually 10-11% of income) from their calculations of private and social returns, and omitted any fiscal rates of return.
Such evidence of bias does not emerge in all cases. As Table 4 shows, the same was not true of Mexico around 1963, suggesting that Mexico’s bias against subsidizing primary education was less strong. Still, the fiscal rates of return in Table 4 were not negative, which underlines a more basic point: Investing in education could have raised revenues for government, contrary to the assumption commonly implied. Again, the main culprit, the clearest proximate source of the lag in education, was the unwillingness of those in power to provide public money.
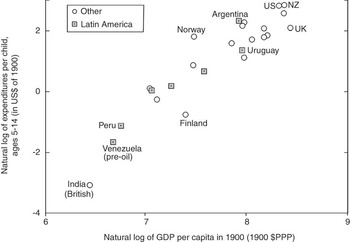
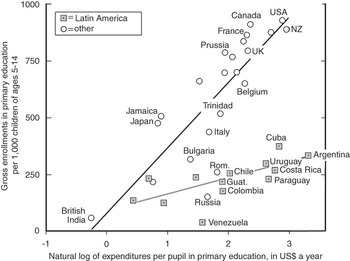
Can a similar undersubsidization of primary education be shown with expenditure numbers from earlier in the 20th century? Thanks to an early survey by the US Commissioner of Education, we can compare Latin American support for education with that of other regions around 1900Footnote 14. Figures 6 and 7 present the results from two perspectives, revealing a regional pattern of unequal spending. First, in Figure 6, the Latin Americans seemed to spend as much per child of school age in 1900 as one would have predicted from the global pattern of that time, given their GDP per capita. That is, Figure 6 shows no anomalies for Latin America. Figure 7, however, reveals a Latin American pattern in the allocation of those expenditures. The richer the Latin American country, the more it spent per pupil, but on a smaller share of the children of school age. If the enrollment rate was low for supply-side reasons, with the school funds being offered more generously in Buenos Aires and other rich localities, Figure 7 implies that around 1900 the subsidies were tilted toward those who were better off, as the conventional view would imply. So far, however, we lack the right income data for estimating whether Latin America had lower tax-support ratios than other continents back in 1900. Until such data can be assembled, the pattern for 1900 does not yet reveal an education–income anomaly, though even without clear anomalies it could have been true that unwillingness to pay taxes for mass schooling was a key to underdevelopment.
Primary school expenditures per child ages 5-14 vs. GDP per capita, c1900
Sources and notes: The enrollment rates are from the same sources listed above for Figures 1–2. The current expenditures per pupil, expressed in US dollars, are taken from the US Commissioner of Education (1899-1900; 1900-1901). These can include private expenditures in some cases, though differences in public expenditures probably dominate the expenditure differences shown here.

primary school enrollment outcomes vs. expenditures per pupil, c1900
See the sources and notes given for figure 6.

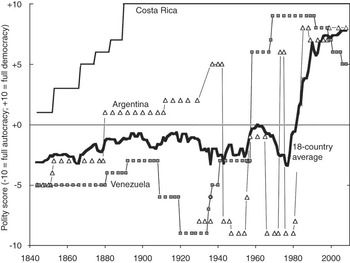
A high-priority extension of the recent data on primary-school subsidies would be to cover cases in which different countries had much different rates of change in their distribution of political power. This would allow a direct double-difference test of the EMS view that more equal political power is key to the advance of mass schooling. Such an experiment is now in progress. Over the last third of a century, there have been major shifts toward the formal institutions of democracy and political competition in nine Latin American countries — Argentina, Bolivia, Brazil, Dominican Republic, Mexico, Nicaragua, Panama, Paraguay and Peru. No country has yet reverted from democracy in the 1960s to full autocracy today, despite some ominous signs in Venezuela. Figure 8 traces this unprecedented convergence toward formal democracy since 1977Footnote 15. Similar shifts have followed in Africa and in Eastern Europe after the breakup of the Soviet Union.
Polity scores in latin America 1844-2008
Sources and notes: The polity scores on the vertical axis are based on the 2008 version of polity IV, from http://www.systemicpeace.org/polity/polity4.htm.

The relative abundance of data for the late 20th and the early 21st centuries allow us at least a rough comparison of changes in countries’ political environment and changes in their education performance. Consistent with the EMS emphasis on voice and schools, there has indeed been a tendency for the faster-liberalizing countries to shift more public expenditure toward education than in countries where the political climate has changed relatively little. True to the EMS emphasis, the eighteen data-supplying countries exhibited a moderately positive correlation (+0.30) between changes in their polity scores between 1970 and 1999 and the shares of GDP devoted to public spending on education in the same periodFootnote 16. The group that democratized strongly, and raised its tax effort on behalf of education by more than 1 per cent of GDP, included Argentina, Brazil, Paraguay, Bolivia, and Mexico. The slower-changing group consists mainly of perennial democracies, such as Costa Rica, Jamaica and Trinidad-Tobago. By implication, the tax efforts on behalf of education have begun to converge within Latin America. A key test of the arguments of EMS and Nugent-Robinson will come in the next dozen years: Will Guatemala and El Salvador both strengthen their democracy and catch up in tax support for schooling?
Thus far, however, the correlations remain only moderate. One reason is that the Unesco data on expenditures contain some puzzling noise. Another is that autocracy is not unambiguously anti-education. Its communist variant, illustrated by Cuba and now partially by Venezuela, has devoted more resources to primary education than did the classic caudillos. As noted elsewhere, the historical contrast in styles of expenditure for education and other social programs is not between autocracies and democracies. Rather the split is between elitist and populist governments, whether they are autocratic or democratic (Lindert, Reference Lindert2003, especially pp. 341-344).
5 A LATIN AMERICAN BIAS TOWARD HIGHER EDUCATION?
Table 3 has revealed that many Latin American (and Asian) countries spend less than half as much tax money on each primary student as on each student in higher education, causing us to wonder how the case for subsidizing those at the top could be stronger in countries with more illiterates and less research-agglomeration efficiencies of the sort experienced in the world’s top research centers. This section first adds reasons to believe that the tilt toward higher education has been not only inegalitarian but also anti-growth, and then presents some counter-arguments that still need to be confronted.
There are several exhibits in the case against the tilt toward higher education. The first is a recent study finding that inequality in educational attainment, an outcome fostered by favoring higher- education subsidies, has had a negative effect on economic growth since 1960 (Castelló and Doménech Reference Castelló and Doménech2002). Second, we should note that primary vs. tertiary fingerprint of Table 3 offers telling evidence even without an education–income anomaly. Countries with relative primary-support ratios well below 50 per cent in Table 3 cannot use their poverty as an excuse, since the same education budget could have been reallocated from tertiary to primary education. The third support for this suspicion comes from the international rates of return evidence: for the same money spent, higher education brings a lower social rate of return than primary. The fourth relates to externalities. As noted, positive externalities have been more easily demonstrated for primary education than for tertiary. If «more easily» means that the effects were probably larger, then a lower primary/tertiary ratio of subsidies per student looks even worse. Finally, the social rates of return to different stages understate the case for investing at the earlier stages because they are based on a stoppage assumption. The rate for primary schooling assumes that the student’s primary education does not enhance his participation and performance in the later stages of education. Thus, the rates of return miss the fact that primary education raises the ability and achievement of those entering secondary and higher education.
Some counter-arguments challenge this suspicion about overinvestment in tertiary education. First, recall that investments in higher education yield research and development benefits, for example, from top university laboratories, which are hard to separate from the returns to instruction alone (see Behrman and Birdsall Reference Behrman and Birdsall1987; Birdsall Reference Birdsall1996). A second rebuttal is the infant-industry, or Gerschenkronian, argument: the start-up costs are more massive, and excellence more delayed, in higher education than in primary. Given competition from the world’s top scholarly institutions, might it not be necessary to subsidize home-grown higher education for a long time, to achieve excellence?
The infant-industry argument has received both guarded approval and perennial suspicion among specialists in international economics. The guarded approval grants the theoretical point that in a second-best world it is possible to reap a high rate of return in the long run by helping the infant industry early. The suspicion, however, is well based in history. Many industries that have been subsidized or protected against outside competition have remained dependent and inefficient infants forever. The suspicion seems valid for the high postwar rate of subsidization to Latin American universities. By 2009, the infants still had not grown up. The region still imported more university services from North America and Europe than it exported. And in the world university rankings by either Shanghai Jiao Tong University or Times Higher Education, all of Latin America, like India and China and other top subsidizers of higher education, lagged far behind. In all of Latin America, no university ranks in the top 100 worldwide, according to the Shanghai Jiao tong and the Times Higher Education rankings, and only UNAM, the University of Buenos Aires and the University of Sao Paulo rank in the top 200Footnote 17. Thus, there are good reasons to suspect that the relative favoring of higher education in Latin America has been anti-growth as well as egalitarian, yet the debate remains openFootnote 18.
6 CONCLUSIONS
Focusing on education–income anomalies, in which a richer country delivers less education than a poorer country, seems a promising way to harvest a part of the rich history that does not lend itself to econometrics. Using this simple device has yielded better tests of the EMS hypothesis that inequality of land ownership and political voice have caused Latin America’s lag in human capital formation. To complete the chain of causation, one must follow the public money, or lack of it, in as many contexts as the data allow. Public funding for mass schooling is the hitherto hidden middle link in the chain. The circumstantial evidence is now much stronger, though still far from complete. Particularly strong is the evidence for a political failure in relatively affluent Venezuela and Argentina to support the mass primary and secondary schooling that would have promoting both growth and equality. Other explanations for the lag in education do not fit the evidence as well. The same is presumably true of other education laggards, such as Guatemala and El Salvador, but other sources of their poverty might have caused them to invest less in schools. It is for this reason that this paper has concentrated on just a few anomalous cases.
Finally, we should step back from the details and remind ourselves of a global reason why we should have suspected all along that the supply of taxes for mass education has been a dominant reason for educational delay throughout most of history. As noted, successfully developed countries have all gravitated toward that same corner solution: providing free primary schooling for all, with most parents choosing it and only a minority paying for private schooling. No country has sustained an income per capita of, say, US$10,000 without providing free mass schooling. A key to backwardness must have been the refusal to supply the taxes to pay for mass schooling, in Latin America as in other regions. This simple fact, like the others just presented, buttresses the EMS political–economy interpretation of the differences in schooling and incomes across the Americas.