INTRODUCTION
The Volchia Griva (Wolf's Mound) site is well known among researchers of the Western Siberian Pleistocene. It is located in the southern part of the West Siberian Plain, in the Lake Chany closed basin. Currently, it is the largest mammoth “cemetery” (i.e., mass accumulation of remains) in Asia that was formed in situ. Geologists, paleontologists and archaeologists of the twentieth century studied the Volchia Griva (hereafter “VG”) in 1957, 1967, 1968, 1975 and 1991. These studies made it possible to obtain a large amount of factual material, but the results of these campaigns were published as very preliminary findings. The calculation of the exact number of remains recovered during fieldwork is not possible due to the fragmentary and inconsistent information about the research conducted in the 1950s through 1970s. Nevertheless, analysis of all available data (including archival sources) allowed us to ascertain that the VG excavations in the twentieth century were carried out on an area of ~490–500 m2. Within its limits, according to some sources, >5700 (or >7000, using other sources) fragments and whole bones and teeth from at least 70 woolly mammoths (Mammuthus primigenius Blum.), five horses, three bison, and one wolf were found, along with 37 lithic artifacts (Polunin, Reference Polunin1961; Zhylkibaev, Reference Zhylkibaev1963; Alexeeva and Vereshchagin, Reference Alexeeva and Vereshchagin1970; Okladnikov et al., Reference Okladnikov, Grigorenko, Alexeeva and Volkov1971; Mashchenko and Leshchinskiy, Reference Mashchenko, Leshchinskiy and Podobina2001; Zenin, Reference Zenin2002).
Unfortunately, most of this unique faunal material discovered during the excavations of the twentieth century was subsequently lost or re-buried on the VG site. No more than 25% of the initial faunal material is preserved in collections of several institutions in Russia and Kazakhstan, including the composite skeleton of a subadult woolly mammoth mounted in 1960 at the Museum of Nature of the Institute of Zoology, Academy of Sciences of Kazakhstan. Such an attitude towards paleontological materials can be explained by the fact that the main efforts at that time were focused on the search for archaeological evidence of game-drive hunting of mammoths and finding dwellings made of bones and tusks. At the same time, at the beginning of the twenty-first century a 14C age of ca. 18–11 14C ka BP was established using mammoth bones from the excavations of 1991 and test pits of 2000 and 2001 (Leshchinskiy et al., Reference Leshchinskiy, Kuzmin, Zenin and Jull2008).
In 2015, a new phase in the study of VG was launched, the trigger for which was the development of the geochemical hypothesis of the extinction of the woolly mammoth. It is based on the deep acidification of favorable Northern Eurasia geochemical landscapes at the end of the Pleistocene. Research shows that this led to chronic mineral starvation of animals and the formation of mammoth cemeteries around “beast solonetz” (salt or mineral licks), which served as mineral oases. In our opinion, the process of mammoth extinction in Northern Eurasia lasted for at least 20,000 years, and was largely caused by geochemical stress, clear manifestations of which were skeletal diseases (Leshchinskiy, Reference Leshchinskiy2009, Reference Leshchinskiy2012, Reference Leshchinskiy2015, Reference Leshchinskiy2017; Leshchinskiy et al., Reference Leshchinskiy, Kuzmin, Boudin and Amon2021a).
A large series of 14C dates, obtained on mammal remains from the 2015–2018 VG excavations, confirmed the presence of the most southern and one of the youngest refugia of the mammoth fauna in Eurasia, which is located in the southern part of Western Siberia. This refugium existed for almost 10,000 years (since the last glacial maximum and possibly up to the Holocene), which is a unique phenomenon. Therefore, paleontological, stratigraphic, and paleoecological studies on the VG today focus on the comprehensive analysis of past ecosystems in the context of radical environmental changes in the Late Pleistocene.
PALEOECOLOGICAL CONTEXT
The problem of the extinction of the mammoth fauna and some of its species has been very important for >200 years (Cooper, Reference Cooper1831). The widespread distribution of Quaternary sediments and the application of advanced methods in their study today allow us to adequately reconstruct the dynamics of the extinction of the woolly mammoth, a key species of the late Pleistocene ecosystems in Northern Eurasia. One hundred thousand years ago, the range of the woolly mammoth covered almost the entire north of Eurasia, including the modern shelf zone of the North Atlantic, the Arctic Ocean, and the North Pacific, which was an uninterrupted body of land during the glaciations (Kahlke, Reference Kahlke1999). However, at the end of the Pleistocene, the mammoth range shrunk rapidly. The main discussions are related to the time interval of ca. 24–9 14C ka BP, including the last glacial maximum and the late glacial period. A radiocarbon database for remains of mammoth and woolly rhinoceros recently became the basis for a model of megafaunal extinction, indicating a “retreat” to the north and northeast because dates younger than 12 14C ka BP are mainly known from the Siberian Arctic (Sulerzhitsky and Romanenko, Reference Sulerzhitsky and Romanenko1997; Stuart et al., Reference Stuart, Sulerzhitsky, Orlova, Kuzmin and Lister2002, Reference Stuart, Kosintsev, Higham and Lister2004).
According to recent data, the conclusion that the woolly mammoth became extinct before 12 14C ka BP in Western, Central, and Southern Europe is generally confirmed (Nadachowski et al., Reference Nadachowski, Lipecki, Wojtal and Miękina2011, Reference Nadachowski, Lipecki, Baca, Żmihorski and Wilczyński2018; Ukkonen et al., Reference Ukkonen, Aaris-Sørensen, Arppe, Clark, Daugnora, Lister and Lõugas2011; Braun and Palombo, Reference Braun and Palombo2012). Nevertheless, today the mosaic nature of the mammoth range during its final stage of extinction on the continent at ca. 12–9 14C ka BP is clear. Most likely, viable mammoth populations still existed at that time in Eastern Europe, Western Siberia, Taimyr, Yakutia, and possibly in some other regions (Kuzmin, Reference Kuzmin2010; Puzachenko et al., Reference Puzachenko, Markova, Kosintsev, van Kolfschoten, van der Plicht, Kuznetsova, Tikhonov, Ponomarev, Kuitems and Bachura2017; Dehasque et al., Reference Dehasque, Pečnerová, Muller, Tikhonov, Nikolskiy, Tsigankova and Danilov2021). Later on, mammoths continued to live on the islands of the Northern Pacific and Arctic oceans at ca. 5.7–3.7 14C ka BP (Vartanyan et al., Reference Vartanyan, Arslanov, Tertychnaya and Chernov1995; Guthrie, Reference Guthrie2004; El Adli et al., Reference El Adli, Fisher, Vartanyan and Tikhonov2017). In Western Siberia, at least two mammoth refugia are known during MIS 2: (1) in the Konda Lowland and the Tura Plain, and (2) in the Baraba Lowland. In these areas, large mammoth fauna sites formed at Lugovskoe, Gary, and VG (Leshchinskiy et al., Reference Leshchinskiy, Maschenko, Ponomareva, Orlova, Burkanova, Konovalova, Teterina and Gevlya2006, 2008; Chlachula and Serikov, Reference Chlachula and Serikov2010).
The Baraba Lowland is part of the West Siberian province of natron salt accumulation, where calcium, calcium-sodium, and sodium-hydroxyl geochemical landscapes are developed. Mineralization of natron water is maximal in the uppermost aquifers associated with Pleistocene deposits (Shvartsev, Reference Shvartsev1992, Reference Shvartsev1998). Salinization began in the Neogene, because at the beginning of the Pleistocene a large number of plant associations belong to species growing on alkali soils (Bukreyeva and Poleshchuk, Reference Bukreyeva, Poleshchuk and Saks1970). Development of the geochemical landscapes of this territory at the end of the Pleistocene was expressed in the multiple salinization and desalinization of soils. The former is directly related to the evaporative concentration of elements coming to the surface from groundwater and, possibly, the addition of salts by atmospheric precipitation and dust from Central Asia. The main role in desalination was played by neotectonic uplift of the southern West Siberian Plain and humidification of the climate (Perelman, Reference Perelman1975).
The latest desalinization of landscapes in the forest-steppe zone of Western Siberia correlates with the general acidification of soils of Northern Eurasia clearly present after ca. 24 14C ka BP. This process probably led to the geochemical stress for mammoths, which is reflected by skeletal diseases (Leshchinskiy, Reference Leshchinskiy2006, Reference Leshchinskiy2009, Reference Leshchinskiy2012, Reference Leshchinskiy2015, Reference Leshchinskiy2017). Nevertheless, despite the degradation of Ca-Na geochemical landscapes as a whole, relatively favorable conditions for large herbivorous mammals existed in some parts of the Baraba Lowland at the very end of the Pleistocene and in the Early Holocene (Leshchinskiy, Reference Leshchinskiy, Cavarretta, Gioia, Mussi and Palombo2001; van der Plicht et al., Reference van der Plicht, Molodin, Kuzmin, Vasiliev, Postnov and Slavinsky2015). The stability of ecological relationships and formation of the refugium in southern Western Siberia were due to the existence of mineral oases, and VG is a typical example of this. During mineral starvation, mammoths, horses, bison, and other megafaunal species were attracted to these areas. These foci of animal activity were certainly well known to ancient people who exploited the faunal remains (Leshchinskiy et al., Reference Leshchinskiy, Kuzmin, Zenin and Jull2008, Reference Leshchinskiy2015, Reference Leshchinskiy, Zenin and Bukharova2021b).
REGIONAL SETTING
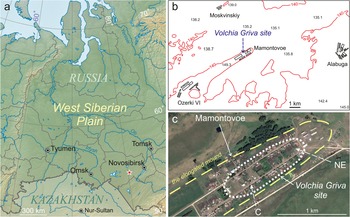
The VG site is situated in the eastern part of the Baraba Lowland (forest-steppe zone of Western Siberia). The generalized regional section shows sand and clay deposits with a total thickness of almost 3000 m (Babin et al., Reference Babin, Chernykh, Golovina, Zhigalov, Dolgushin, Vetrov and Korableva2015). The mammoth “cemetery” is confined to the northeastern part of the eponymous sloping mound, elongated along the azimuth of ~50–55°. This mound is ~11 km long and ~0.5–1 km wide, with a maximal altitude of ~149 m (above the Baltic datum) and a relative elevation up to 15 m. The burial place is positioned within the boundaries of Mamontovoe (from the word “mammoth”) Village, in Kargat County, Novosibirsk Province, Russia (Fig. 1). Manual exploratory drilling, digging of test pits, inspection of house cellars and water pipe trenches, and data from local residents allowed us to determine a total of at least several hectares where mammoth faunal remains were found.
Position of the Volchia Griva: (a) administrative map of the West Siberian Plain (* indicates the site); (b) county map with local altitudes in meters; (c) the Volchia Griva site within Mamontovoe Village (satellite image), areas: C = central, NE = northeastern.

MATERIALS AND METHODS
The data for this paper were collected from published and archival sources of the twentieth century, as well from the authors’ descriptions of nine geological sections, >150 sediment and ground surface samples, >8 m of cores, documentation of excavations, and faunal and cultural remains obtained in 2015–2018. Excavations of the four field seasons within an area of ~38 m2, with an almost complete collection of faunal materials (only very poorly preserved remains were not taken), yielded almost 2000 fragments and whole mammal bones and teeth. Altogether, 38 lithic artifacts also were recovered.
Descriptions of sections and taphonomic observations were accompanied by detailed photographing and sketching. The main emphasis was placed on the most accurate location of layers, proper sampling (especially with respect to the purity of samples), and careful positioning of sediment samples and paleontological and archaeological finds with respect to certain elements of geological strata. Excavations were carried out following common modern practices. When cleaning of the bone-bearing horizon was undertaken, either layer-by-layer or by arbitrary levels (e.g., 0.5–5 cm inside thick strata), spatulas, brushes, and other small tools were used. The preparation of excavation plans (scale 1:20) was carried out using units in the form of 1 × 1 m grid size. The depth and spatial position of the remains were recorded using a surveyor's level and a compass. The entire volume of bone-bearing sediments was washed (sieves with a mesh of 1 × 1 mm), in order to recover bones and teeth of small vertebrates and tiny artifacts. The limits of the bone-bearing lenses and the peculiarities of the VG geological structure were clarified during borehole drilling. This work was carried out with a manual rotary-percussion drill (Eijkelkamp Co., Netherlands).
Post-mortem changes of bone surfaces were evaluated according to weathering stages 0–5 proposed by Behrensmeyer (Reference Behrensmeyer1978). Individual ages and pathological skeletal changes were determined by comparison with materials on normal bone morphology and diseases of modern and Pleistocene large mammals, including humans (Logginov, Reference Logginov1890; Chepurov et al., Reference Chepurov, Cherkasova, Akulov, Ostrovskiy and Martynyuk1955; Laws, Reference Laws1966; Kovalskiy, Reference Kovalskiy1974; Baryshnikov et al., Reference Baryshnikov, Kuzmina, Hrabrii and Starobogatov1977; Lang, Reference Lang1980; Haynes, Reference Haynes1991; Rothschild et. al., Reference Rothschild, Wang and Shoshani1994; Kuzmina and Maschenko, Reference Kuzmina, Maschenko and Kuzmina1999; Lister, Reference Lister1999; Maschenko, Reference Maschenko2002; Rothschild and Martin, Reference Rothschild and Martin2003; Rothschild and Laub, Reference Rothschild and Laub2006, Reference Rothschild and Laub2008; Johnson et al., Reference Johnson, Bleich and Krausman2007; Flueck and Smith-Flueck, Reference Flueck and Smith-Flueck2008; Leshchinskiy, Reference Leshchinskiy2009, Reference Leshchinskiy2012, Reference Leshchinskiy2017; Clarke and Goodship, Reference Clarke and Goodship2010; Lee et al., Reference Lee, Sayialel, Lindsay and Moss2012; Krzemińska, Reference Krzemińska2014; Haynes and Klimowicz, Reference Haynes and Klimowicz2015; Krzemińska and Wędzicha, Reference Krzemińska and Wędzicha2015; Krzemińska et al., Reference Krzemińska, Wojtal and Oliva2015).
Palynological analysis was performed at the Laboratory of Mesozoic and Cenozoic Continental Ecosystems, Tomsk State University (LMCCE TSU). Chemical treatment of samples was conducted at the Laboratory of Micropaleontology (LMP), TSU, in two ways: (1) sequential treatment by NaOH (20%) and HCl (10%), according to the standard procedure (Zaklinskaya and Panova, Reference Zaklinskaya and Panova1986); and (2) included treatment of the samples with Na4P2O7, and then by HCl (10%). Demineralization in both cases was carried out by fractionation in a heavy liquid (density of 2.2 g/cm3) based on a K-Cd mixture.
After treatment, pollen and spores were viewed using a Leica DM 1000 microscope with magnifications of 400, 630, and 1000. Atlases, published articles, and comparative collections of LMCCE and LMP were used to determine the taxonomy of pollen and spores. For each sample, at least 250 pollen grains usually were counted. Pollen spectra (PS) document the composition and ratio of individual seed plant taxa. The main percentage sum of each PS includes pollen of terrestrial plants: trees and shrubs (arboreal pollen “AP”), and herbs and dwarf shrubs (non-arboreal pollen “NAP”). Wetland and aquatic plant pollen (WAP), spores of seedless vascular plants, and non-pollen palynomorphs (NPP) were not taken into account, therefore their share was calculated from the sum of pollen of terrestrial plants. PS of similar taxonomic composition and ratios were combined into pollen complexes (PC).
The results of palynological analysis are presented in the form of tables and the pollen diagram for the upper part of the VG section. A detailed environmental reconstruction at the time of site formation was carried out by taking into account geological and taphonomic data.
Radiocarbon dating and stable isotope ratio (δ13C and δ15N) analyses for the bone samples were conducted at the Center for Applied Isotope Studies, University of Georgia (Athens, GA, USA; lab code UGAMS). First, the bone was cleaned with a wire brush and washed in an ultrasonic bath. After physical cleaning, the dried bone was gently crushed into small fragments. The crushed bone was treated with 1N HCl at 4°C for 24 hours. The residue was filtered, treated with 0.1N NaOH in the filter to remove contamination caused by presence of humic acids, rinsed with deionized water, and under slightly acid condition (pH=3) heated at 80°C for six hours to dissolve collagen and leave humic substances in the precipitate. The collagen solution was then filtered to isolate the pure collagen and subsequently freeze-dried. The dried collagen was combusted at 575°C in an evacuated/sealed Pyrex ampoule in the presence of CuO. The resulting carbon dioxide was cryogenically purified from the other reaction products and catalytically converted to graphite using the method of Vogel et al. (Reference Vogel, Southon, Nelson and Brown1984). Graphite 14C/13C ratios were measured using the CAIS 0.5 MeV Accelerator Mass Spectrometer (AMS). The sample ratios were compared to the ratio measured from the Oxalic Acid I (NBS SRM 4990). The sample 13C/12C and 15N/14N ratios were measured separately using a stable isotope ratio mass spectrometer and expressed as δ13C and δ15N with respect to standards (PD belemnite and AIR, respectively), with an error of <0.1‰. The quoted uncalibrated 14C dates have been given in radiocarbon years before AD 1950 (years BP), using the 14C half-life of 5568 years. The error is quoted as one standard deviation and reflects both statistical and experimental errors. The 14C dates have been corrected for isotope fractionation.
LOCATION AND ACCESSION OF PALEONTOLOGICAL MATERIALS
Paleontological materials from the 2015–2018 excavations are stored at the Laboratory of Mesozoic and Cenozoic Continental Ecosystems (LMCCE). Fieldwork, including the collection of faunal remains, was carried out by TSU based on license NOV 02790 PD, issued by the Department for Subsurface Use of the Siberian Federal District, Russian Federation.
RESULTS
We present here a summary of the results of paleontological, stratigraphic, taphonomic, and palynological studies conducted in the field and laboratory. The study and interpretation of extensive materials made it possible to better understand ecological aspects of the mammoth fauna, and to reconstruct environmental conditions during formation of the site. The emphasis here is on the 2015–2018 field campaigns. The fragmentary and inconsistent information from research conducted in the twentieth century and the incompleteness of the faunal collections obtained in those years do not allow their full use.
The resumption of multidisciplinary studies at VG occurred after almost a quarter-century break. An analysis of the available data shows that the bone-bearing horizon is not uniform laterally. It consists of a series of lenses traced over a distance of >1 km. Therefore, fieldwork was carried out in particular locations where the largest assemblages of mammoth faunal remains were identified—in the extreme northeastern part of VG, and in the center of Mamontovoe Village (Fig. 1).
The northeastern assemblage of mammoth fauna remains
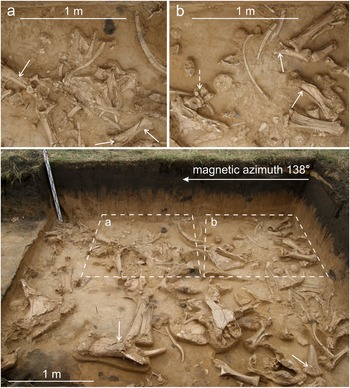
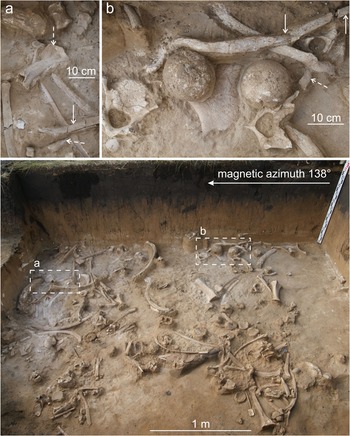
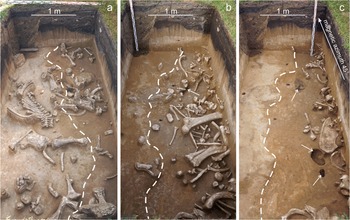
The area with mammoth remains in the northeastern part of VG has been known since the 1950s. In the twentieth century, it was considered as the most promising part of the site, and all work was carried out here (Polunin, Reference Polunin1961; Alexeeva and Vereshchagin, Reference Alexeeva and Vereshchagin1970; Okladnikov et al., Reference Okladnikov, Grigorenko, Alexeeva and Volkov1971; Mashchenko and Leshchinskiy, Reference Mashchenko, Leshchinskiy and Podobina2001). This information was decisive when research at VG was resumed in September 2015. The excavation pit, size of 4 × 3 m (WGS 84 coordinates: 54°40′01.9″N, 80°20′16.2″E; ground surface altitude ~147.3 m), oriented along magnetic azimuth of ~138°, is directly adjacent to the southwestern wall of the 1991 excavation pit No. 1. New excavations have shown that the remains of large mammals occur at a depth of 0.74–1.28 m below the ground surface (Figs. 2, 3). They are concentrated at the bottom of a loess-like loam with a compact (sometimes spotted) structure. The high content of carbonates is responsible for the very dense appearance of sediments at the bottom of the layer, and the loam ranges in color from gray-brown to white-gray (with greenish, dove-colored, or ashy shades). The bones at the bottom of this layer lie directly on thinly laminated, sandy clay sediments, which form the basis of the VG geological body. The bedding surface between the loess-like (bone-bearing) member and the underlying lacustrine-like (thinly laminated) member is clear—it is marked by cracks (mouths up to 5 cm wide) that penetrate as much as 0.6 m down the section.
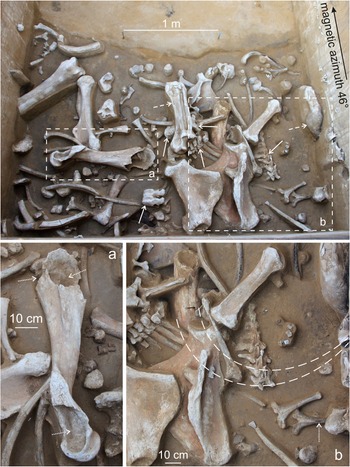
The arbitrary upper level of the VG bone-bearing horizon (2015 excavations). Weathering stages 4 and 5 of bone surfaces prevail. Solid arrows indicate long bones that were crushed during trampling; dashed arrow shows the mammoth pes portion.

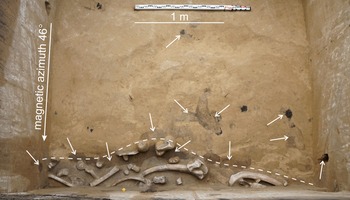
The arbitrary lower level of the VG bone-bearing horizon (2015 excavations). Weathering stages 2 and 3 of bone surfaces prevail. Broken ribs under pressure (solid arrows) and a steep dip of some bones (dashed arrows) indicate severe trampling.
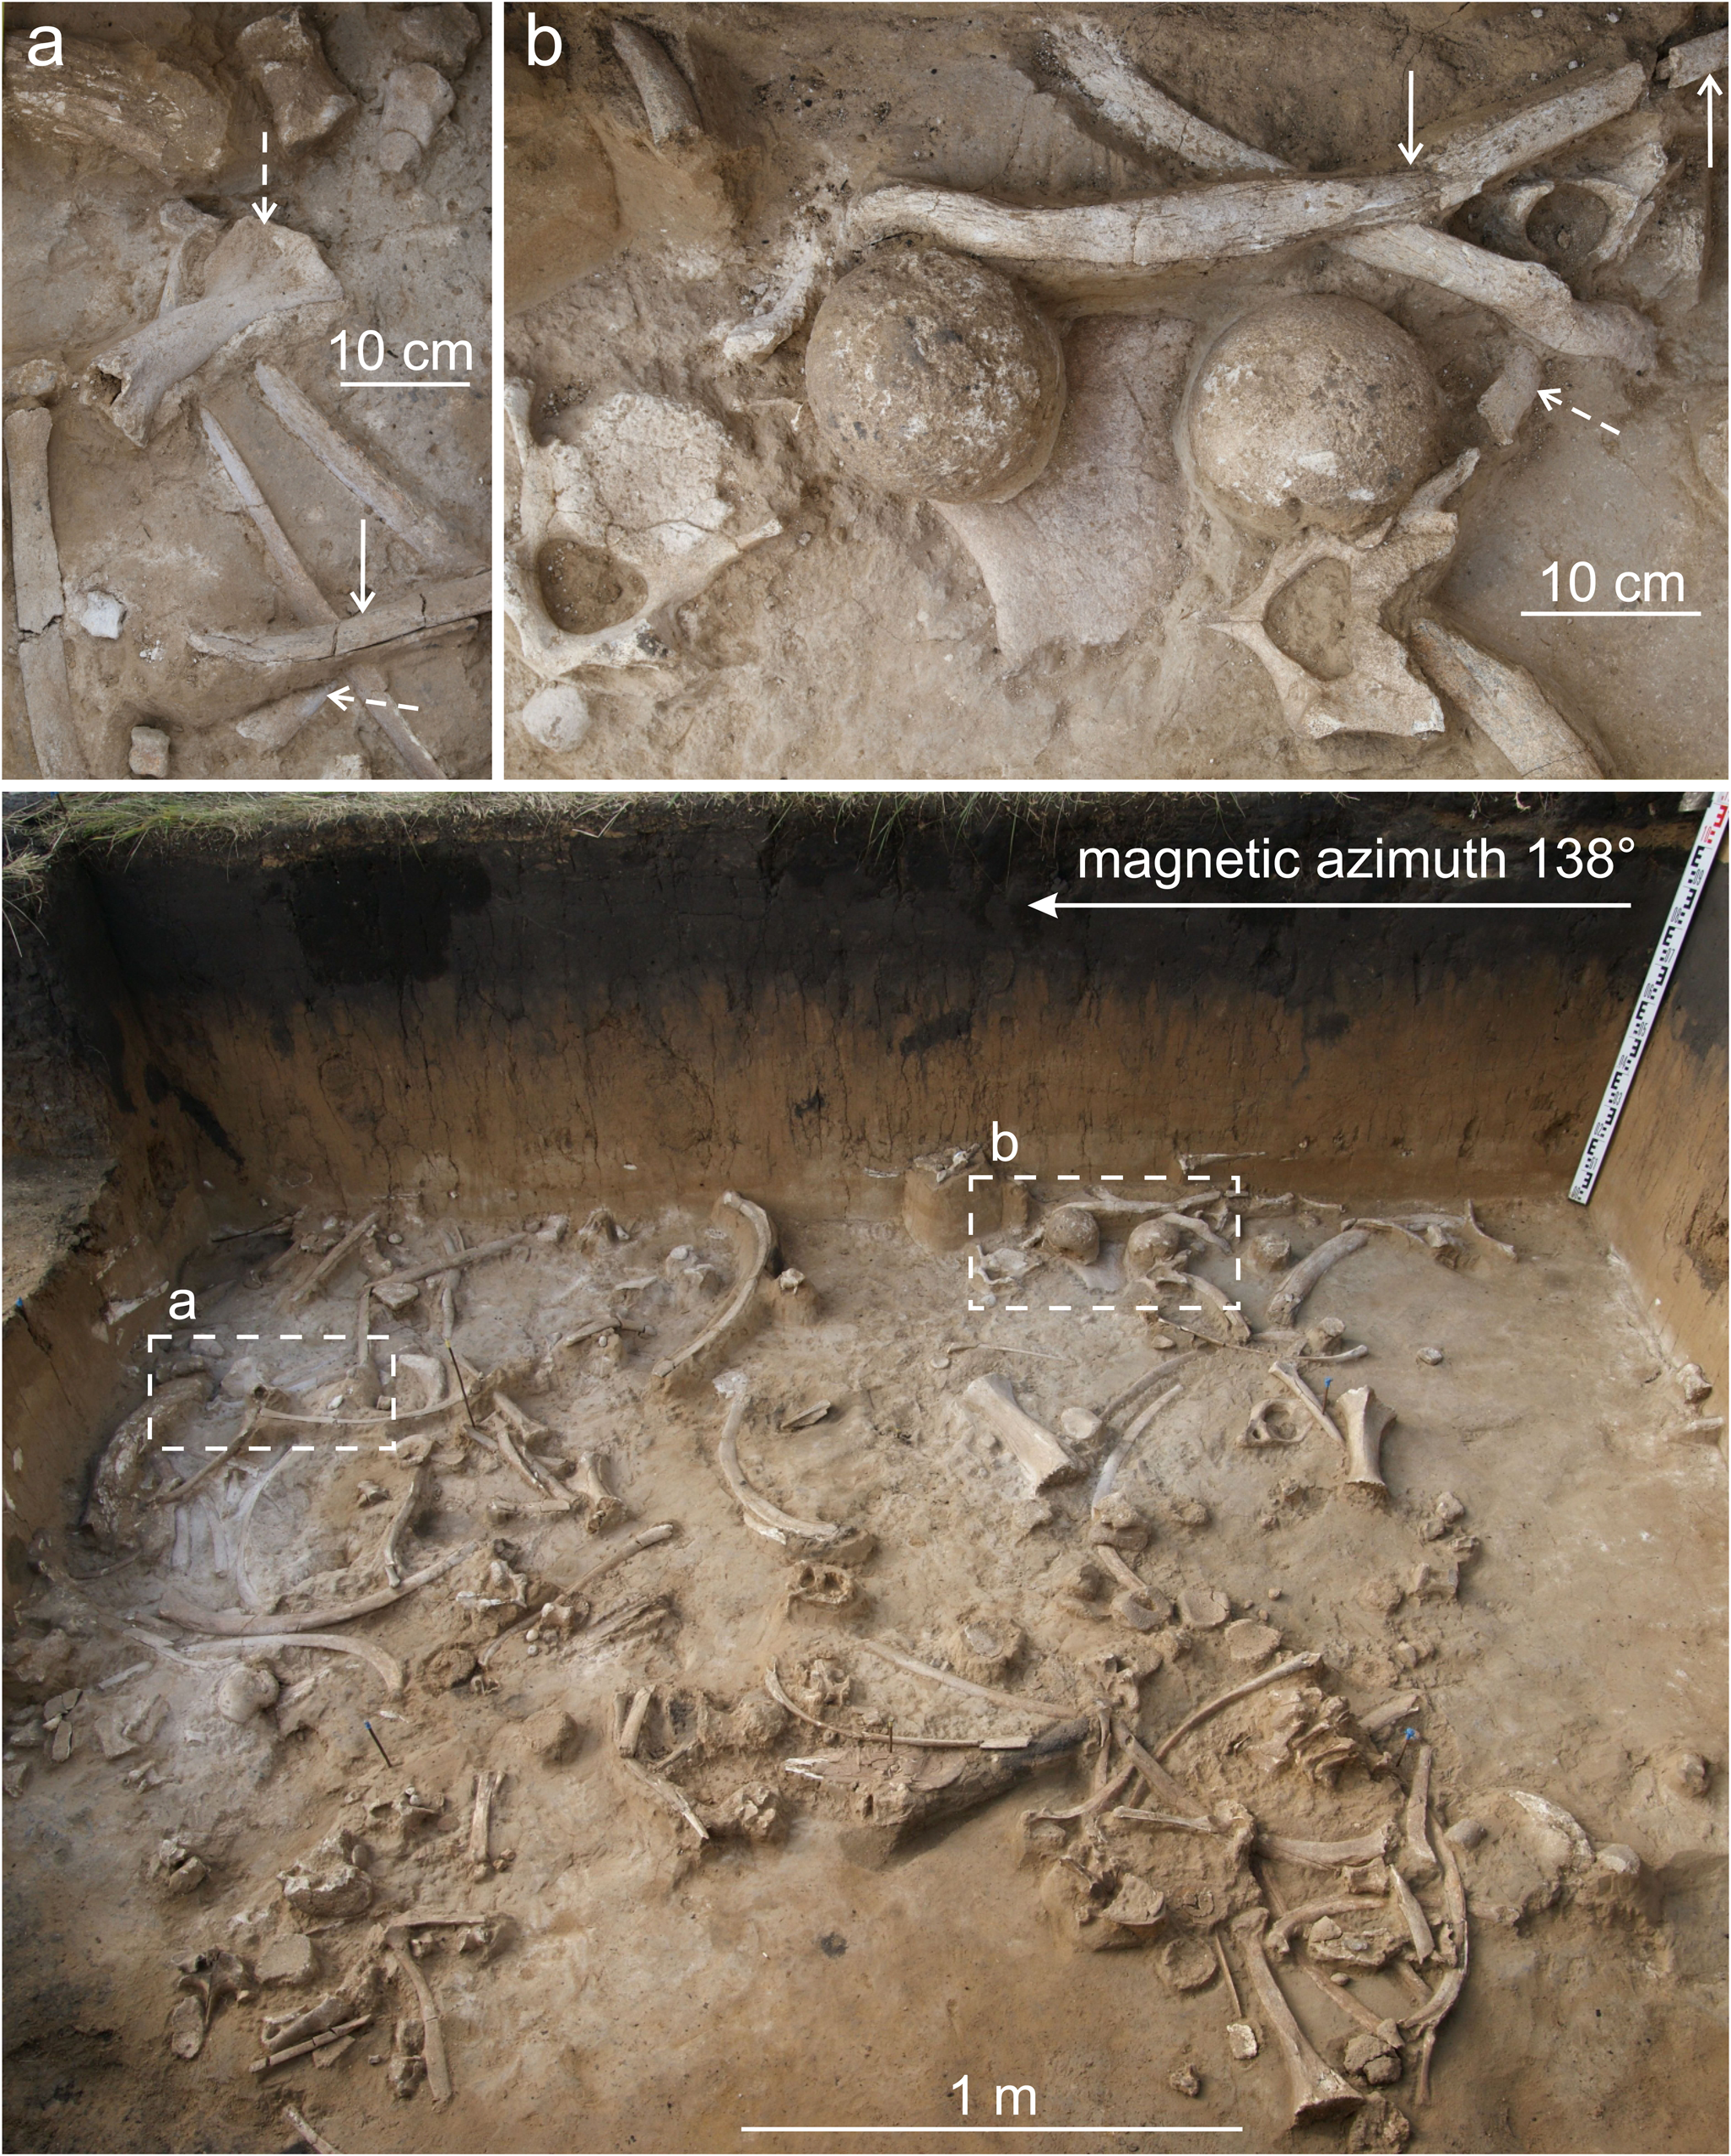
In general, in the studied area, the bone-bearing horizon was represented by a subhorizontal body ~0.15–0.45 m thick, and many bones lie directly on top of each other. During the 2015 excavations, 611 remains of woolly mammoth and 20 remains of horses (Equus sp.) were recovered. If one accepts the average thickness of the bone-bearing horizon as ~0.3–0.35 m, the concentration of finds was more than 50 items/m2. Taphonomic analysis indicates a high degree of bone weathering, which reaches a maximum in the arbitrary upper (Fig. 2) and middle levels of the bone-bearing horizon, where weathering stages 4 and 5 prevail. At the very bottom of the loess-like loam (arbitrary lower level), the bones have a less-weathered appearance (mainly stages 2 and 3) (Fig. 3). It is important to note that some more-weathered samples lie under less-weathered ones, which indicates possible post-depositional disturbance and interruptions in the formation of both the bone-bearing horizon and the matrix.
Minor subaerial sedimentation did not create conditions for the burial of whole carcasses. Therefore, animal remains could be completely destroyed in a few decades. This resulted in severe weathering and a high degree of bone fragmentation, their uneven distribution, and the rare occurrence of anatomical articulations (only four groups of vertebrae and a pes portion of mammoth, and a horse's metapodia were found). Better preservation at the bottom of the bone-bearing horizon can be explained by trampling of the mammoth bones and tusks into the moist clayey substrate by living mammoths and other large mammals. That is why the long bones are often crushed on their upper and lower sides. A steep dip (30° angle or more) of a part of the ribs and long bones at all levels indicates that they were trampled into the mud. Despite the fact that animal skeletons were exposed on the surface for a long time, gnawing marks by predators or scavengers are rare. Cut marks on bones that could have been left by ancient people were not recorded, although 48 lithic artifacts were found in the northeastern assemblage from all field seasons (Leshchinskiy et al., Reference Leshchinskiy, Zenin, Burkanova, Dudko, Gulina, Fedyaev, Semiryakov and Kanishcheva2015, Reference Leshchinskiy, Zenin and Bukharova2021b).
The very high degree of weathering and trampling, as well as the activity of animals, including humans, resulted in the preservation of only few whole vertebrae, ribs, and long bones (mainly tibiae and radii) and their epiphyses, but many bones of manus and pes, and sesamoid bones, including patellae are present. Almost all remains have root traces, but it is impossible to prove that they are contemporaneous with the time of burial. The roots of modern plants penetrate into the loess-like loam and often entangle the bones. Many bones of the lower level are covered with a calcareous crust due to the high content of carbonates in the sediments. In general, most of the remains are represented by small fragments unsuitable for morphological studies. However, well-diagnosed large fragments and whole bones made it possible to establish that at least six woolly mammoths were present within the area excavated in 2015. Based on data of the dental stages and epiphysis fusion for long bones (Laws, Reference Laws1966; Haynes, Reference Haynes1991; Lister, Reference Lister1999), it can be said that two of individuals were >25 years old when they died, one was 12–25 years old, and two were <12 years old. One individual was a calf up to one year old, possibly a newborn or fetus, as evinced by the atlas fragment with unfused left and right parts of the dorsal arch (Maschenko, Reference Maschenko2002). Horse remains are found only in the lower level, and consist of at least two individuals about two years old.
Paleontological materials obtained in 2015 were used to clarify the age of the VG northeastern assemblage. Previously, the period of its formation was estimated in the range of ca. 18–11 14C ka BP (Leshchinskiy et al., Reference Leshchinskiy, Kuzmin, Zenin and Jull2008). More recently, new AMS radiocarbon dates were produced, the oldest three values of which are from the base of the bone-bearing horizon. Two of them, obtained from the upper and lower jaws of horses from depths of 1.14–1.2 m and 1.07–1.1 m, respectively, gave ages of 19,130 ± 50 14C yr BP (UGAMS-26104) and 18,840 ± 50 14C yr BP (UGAMS-26107). The third value of 18,840 ± 50 14C yr BP (UGAMS-26110) was obtained from a tusk found at a depth of 1.1–1.16 m. The youngest date, 17,840 ± 60 14C yr BP (UGAMS-26111), belongs to a mammoth pelvis from a depth of 0.74–0.99 m (Table 1). It is impossible to determine the exact stratigraphic position of this find, because the boundary between the bone-bearing levels in this part of VG is unclear. Nevertheless, it is now clear that the burial process of the megafauna here began earlier than 19 14C ka BP.
The results of radiocarbon analysis for the samples from the northeastern assemblage of the Volchia Griva site (2015 excavation).

The central assemblage of mammoth fauna remains
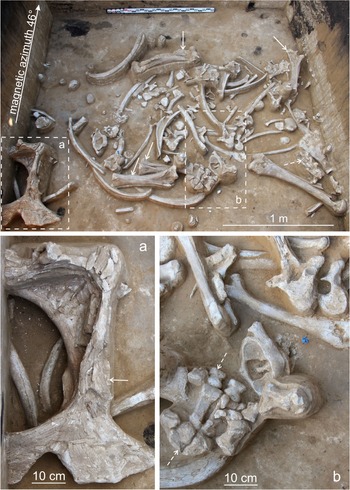
In 2016–2018, studies were carried out on a previously unexplored area in the center of Mamontovoe Village, ~700 m from the twentieth century and 2015 excavations. In 2016, an excavation pit of 3 × 3 m was set up on Molodezhnaya Street, between house no. 35 and the roadway (WGS 84 coordinates: 54°39′48.4″N, 80°19′47.6″E; ground surface altitude ~148 m). The walls of the pit are oriented along magnetic azimuths of ~46° and 136°. Fieldwork results show that the upper bone-bearing level here is practically absent, and only a single fragment of a bison's mandible, which was found at a depth of 0.86–0.9 m, can be preliminarily assigned to it. Farther below, at a depth of 1.04–1.47 m (an average interval of 1.2–1.4 m), a typical bone-bearing lens was excavated (Fig. 4), with 207 remains—almost all from mammoths, including the manus portion in anatomical position (Fig. 4b). The degree of bone weathering (stages 1–5) and surrounding subaerial sediments generally correspond to the information available from both taphonomy and geology of the northeastern part of VG.
The middle level of the VG bone-bearing horizon (2016 excavations). Weathering stages of bone surfaces present are from 1–5. Solid arrows indicate long bones and the pelvis (a) with the highest degree of weathering; dashed arrows show portions of the vertebral column and mammoth manus (b) in anatomical position.

However, below the interval of ~0.15–0.3 m thick, a bone-bearing level was also revealed, which was not previously noted. At a depth of ~1.55–2.15 m (average interval 1.65–2.1 m), fragments and whole vertebrae, scapulae, ribs, skull bones, and limbs of calves and adult mammoths with a concentration of ~100 items/m2 were found. These remains are very well preserved (weathering stages 0 and 1 prevail), because they were quickly sealed by sandy clay material in the upper part of a small gully ~1.6 m deep and >4 m wide. This also explains the relatively large number of anatomical articulations (Fig. 5). It is noteworthy that a large mandible, fused ulna, and radius were found higher in the section (the bone tops at a depth of ~1.45–1.47 m), which led to greater weathering of their surfaces. In the center of this assemblage, many bones lie on top of each other, which caused indentations. Some bones are positioned at steep angles, and a large tusk (alveolus diameter of ~15 cm) penetrated the lower level to its bottom.
The lower level (upper part) of the VG bone-bearing horizon (2016 excavations). Remains of at least three mammoths are visible. Weathering stages 0 and 1 of bone surfaces prevail. Solid arrows indicate anatomical articulations of the vertebrae; dashed arrows show the fused ulna and radius, the large mandible lying above the rest of bones; (a) humerus with strong gnawing marks (dotted arrows); (b) the tusk distal end penetrates down to the bottom of horizon (contoured by dashed lines); dotted arrow indicates mammoth spinous process with a hole (pathology).

The unique taphonomy of the central assemblage led to the highest degree of concentration of finds in the main part of the 2016 excavation pit, >130 items/m2 (~3 m2 of excavated space were without finds). In total, 792 mammal remains, including fragments, were found. Almost all of them belong to at least eight mammoths: from adults to 0–2 years old, and possibly fetuses. The small sizes of ribs and long bones, which demonstrate the early stages of ontogenesis, indicate the ages (Maschenko, Reference Maschenko2002; Fisher et al., Reference Fisher, Shirley, Whalen, Calamari, Rountrey, Tikhonov, Buigues, Lacombat, Grigoriev and Lazarev2014). It is important to note that mammoth bones represent all divisions of the skeleton, and the bones in the lower level are significantly larger than analogous bones in the middle level that belong to individuals of similar age. This conclusion was made on the basis of the described process of epiphyseal fusion in the mammoth's long bones (Lister, Reference Lister1999). Noteworthy among the large bones of the lower level is a femur with fused epiphyses ~1.15 m long that most likely belongs to a male older than 45 years. This individual could have weighed 5–6 tons, with a calculated height of >3 m (Christiansen, Reference Christiansen2004; Larramendi, Reference Larramendi2016). Only 38 remains, or a few more (some fragments cannot be identified up to species), belong to other taxa. Among large mammals, there are bones and teeth of bison (Bison sp.); horse (Equus sp.; anatomical articulation of the three phalanges and sesamoid bone of an individual <1.5 years old); bear (Ursus sp.; one tooth), and apparently wolf (Canis sp.; scapula and pelvis fragments of two individuals). For the first time, rodents and medium-sized carnivores (foxes) were found in the bone-bearing horizon of the VG. Similar morphology and disunity of the remains (fragments of mandible and skull, and teeth) do not allow us to confidently identify them to the species level: it is either polar fox (Vulpes lagopus L.) or red fox (V. vulpes L.).
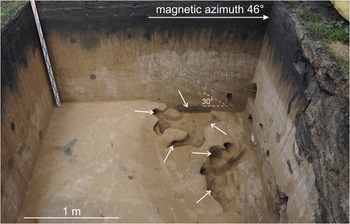
In 2017, excavations were carried out in an area of 3 × 3 m, directly adjacent to the 2016 pit, between house no. 35 on Molodezhnaya Street and the roadway. As a result, the remaining transverse part of the aforementioned gully was excavated. Six poorly preserved bone fragments were assigned to the upper and middle levels in the interval of 0.96–1.26 m. The lower bone-bearing level was determined in a narrow strip of ~2 m2, at a maximum depth of 2.04 m (Fig. 6). One hundred mammal remains were recovered, 95 of which belong to mammoth (apparently, to those individuals found in 2016). Other remains belong to horse; probably, polar fox; and rodents. The weathering of bone surfaces is identical to that found during the 2016 excavations.
The bottom of the VG bone-bearing horizon (2017 excavations). The gully limit is clearly visible (contoured by dashed line). Solid arrows indicate numerous holes of burrowing animals.

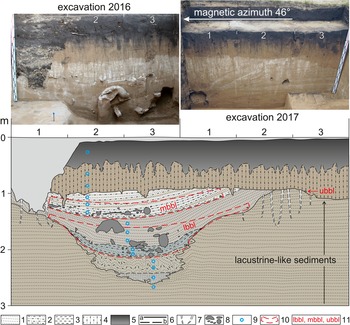
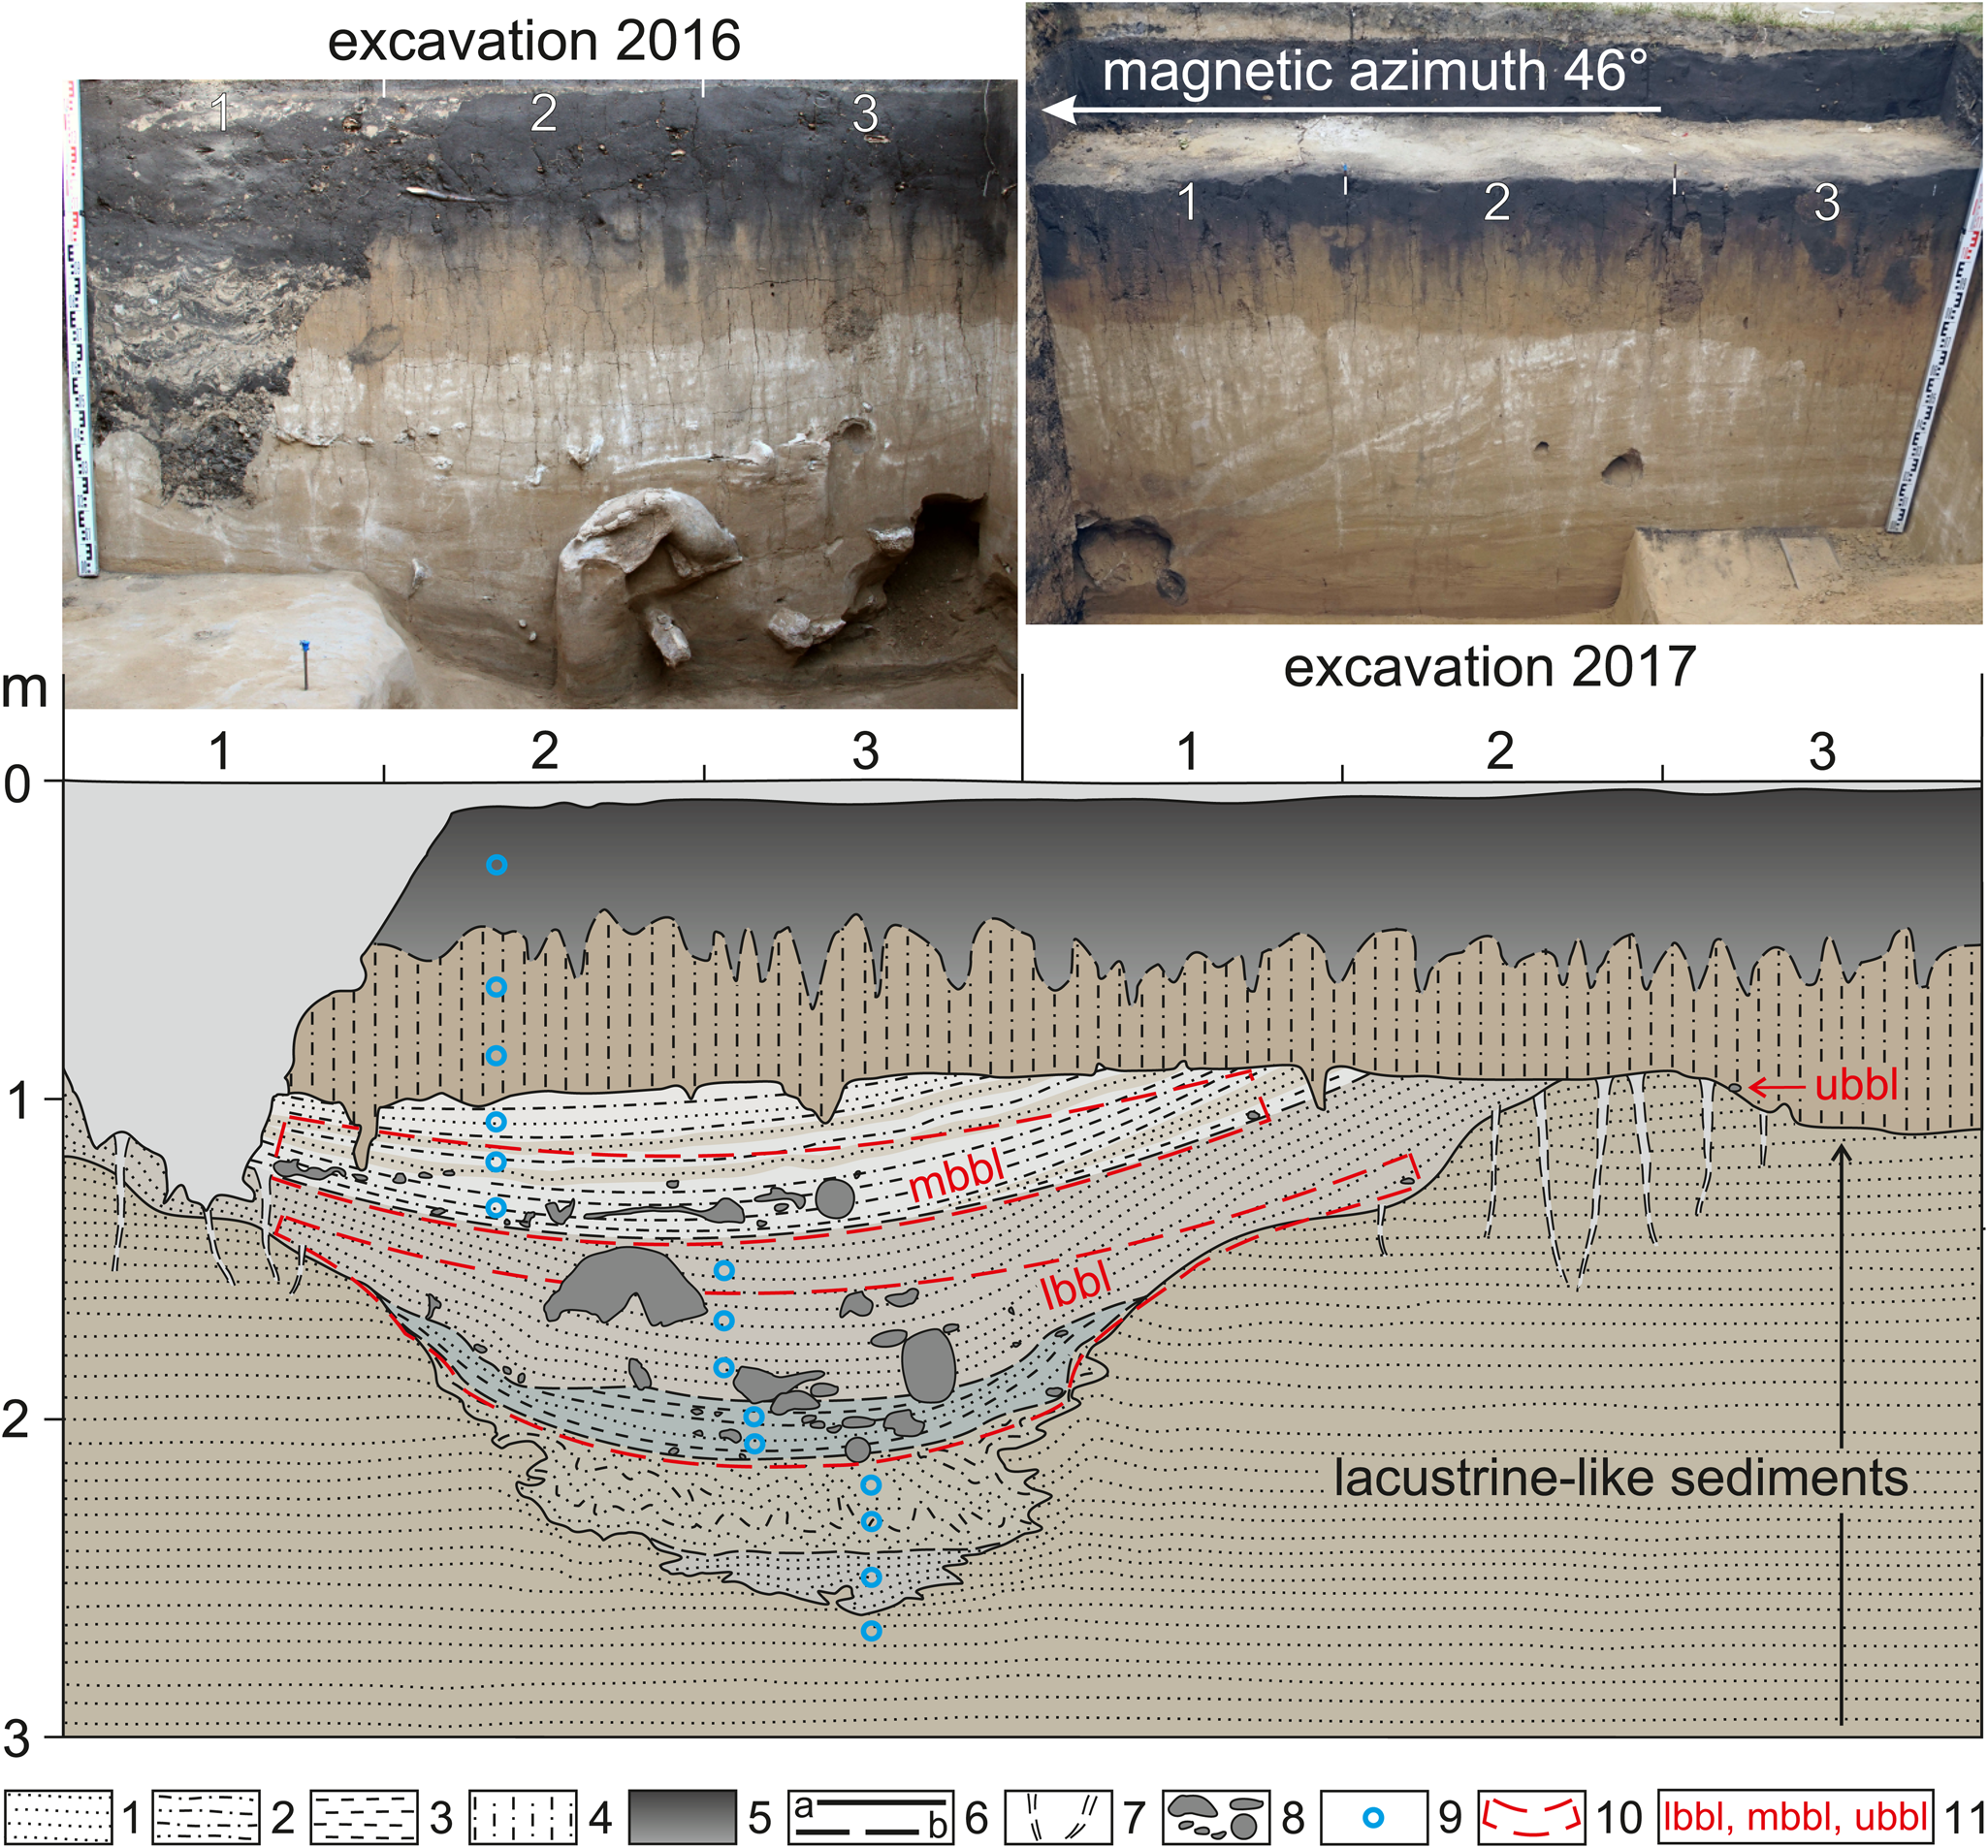
Well-chosen excavation areas in 2016–2017 allowed us to re-open the part of the ancient small gully with the bone-bearing horizon of the central faunal assemblage. Description of stratigraphy with sampling for laboratory studies formed the basis for a summary cross-section of this erosional form, which clearly was expressed on the southeastern walls of 2016–2017 pits (Fig. 7).
Cross-section of the ancient small gully with bone-bearing horizon of the VG central faunal assemblage. 1 = sand; 2 = silt; 3 = clay; 4 = loess-like loam; 5 = soil; 6 = boundaries: a, certain; b, assumed; 7 = desiccation cracks; 8 = faunal remains; 9 = sampling points; 10 = boundaries of bone-bearing levels; 11 = bone-bearing levels: lbbl, lower bone-bearing level; mbbl, middle bone-bearing level; ubbl, upper bone-bearing level.
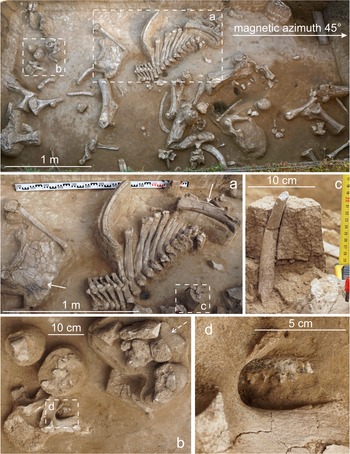
In 2018, a 4 × 2 m excavation pit was laid 11 m from the 2016–2017 excavations (in the magnetic azimuth of 315°) on the other side of the roadway, in front of house no. 18 on Molodezhnaya Street. The long wall of the pit is oriented along the magnetic azimuth of 45° (along the street). The upper level of the bone-bearing horizon was absent. In the middle level, 160 remains were found, almost all of them belonging to mammoths (Fig. 8, 9a). Weathering of bone surfaces in most cases reaches stages 3–5. Bone sizes indicate a minimum of two mammoths (immature and young adult). Extraordinary finds include the manus portion and 20 vertebrae in anatomical position (Fig. 8a, b). Only one fragment of the mandible belongs probably to the polar fox (Fig. 8d), and the species for several fragments were not identified due to poor preservation. The depth of occurrence for remains in the middle level was in the range 0.52–1.06 m. A rather large interval is associated with a significant drop in sediment depth towards the ancient gully. In addition, trampling of bones played a significant role in their vertical distribution. This is clearly demonstrated by the mammoth rib from a depth of 0.68–1.12 m, the distal end of which stood vertically in the middle level, and the proximal end was immersed into the lower level (Fig. 8c).
The middle level of the VG bone-bearing horizon (2018 excavations). Remains of at least two mammoths are visible. Weathering stages 3–5 of bone surfaces prevail. (a) Large portion of vertebral column in anatomical position, solid arrows indicate the pelvis fragment and the humerus with highest weathering; (b) manus portion in anatomical position (dashed arrow); (c) vertical rib position indicating severe trampling; (d) fox mandible fragment under mammoth lumbar vertebra.

Structure of the VG bone-bearing horizon at the central faunal assemblage (2018 excavations). (a) middle level, (b) upper part of the lower level, (c) bottom of the lower level. Dashed lines show change of the ancient gully/mud pit limits. Solid arrows indicate holes of burrowing animals.

The lower bone-bearing level lies almost immediately below the middle one at a depth of 0.91–1.37 m. The finds are a continuation of the assemblage in the ancient gully that was excavated in 2016–2017. Its boundary is clearly seen by a sharp decrease in the paleo-microrelief (Fig. 9). Quick burial of bones in sandy clay, likely of colluvial and coastal-lacustrine genesis, determined the predominance of weathering stages 0–1. Nevertheless, remains of stage 5 are also found here, which indicates re-deposition or trampling. Almost all of the total 280 mammal remains found in the lower level of 2018 belong to mammoths. An important find is portions of a maxilla with dP2 and dP3. The absence of occlusal wear on the teeth, their small sizes, and other signs (Roth and Shoshani, Reference Roth and Shoshani1988; Rountrey et al., Reference Rountrey, Fisher, Tikhonov, Kosintsev, Lazarev, Boeskorov and Buigues2012) indicate that these remains belong to a fetus. Other taxa are represented by horse (hoof phalanx and sesamoideum), and probably polar fox (portions of the skull and a mandible).
The bone-bearing horizon in all the excavations was disturbed by the holes of burrowing animals. In the lower level, the holes sometimes remained hollow when they are located under large bones (Figs. 6, 9). These biogenic disturbances appear to be of Holocene age. Given the frequent death of rodents in these holes, and perhaps sometimes of small carnivores, there is a possibility of mixture of remains of different ages. To minimize this negative factor, the fillings of holes were excavated and washed separately (Fig. 10). As a result, numerous bones and teeth of several rodent species with excellent preservation were found, which were taken into account separately.
Holes of burrowing animals (solid arrows) that were excavated and washed separately (2017 excavations). Note the steep dip (angle up to 30° or more) of sediments in the cross-section of the ancient gully.

Along with the mammoth fauna remains in the central assemblage, lithic artifacts were also found (eight items in 2016; four in 2017; 15 in 2018). Artifacts are associated mainly with the lower bone-bearing level (Leshchinskiy et al., Reference Leshchinskiy, Zenin and Bukharova2021b), which indicates that Paleolithic humans were present at VG already at the early stage of the site's formation.
The age of remains from the VG central assemblage before the 2015–2018 campaigns was unknown. A series of AMS 14C dates showed that a bone-bearing horizon here began to form almost immediately after 20 14C ka BP, and this process continued practically until the end of the Pleistocene. Thus, burial of remains occurred synchronously throughout the whole explored VG area. The distribution of dates by bone-bearing levels is shown in Table 2.
The results of radiocarbon and isotopic analyses for the samples from the central assemblage of the Volchia Griva site (2016–2018 excavations).

Based on the 2016 data, the seven oldest dates for the lower level are in the range of ca. 19.6–19.1 14C ka BP. Four of these values were run on horse (first phalanx; depth of 1.91–1.95 m), wolves (pelvis and scapula fragments; depths of 1.62–1.65 m and 1.87–1.88 m, respectively), and the polar/red fox (skull fragments; depth of 1.90–1.91 m). The rest of the dates come from mammoths: a fragment of a tusk alveolus from a depth of 1.97–2.05 m; and the spinous processes of the vertebrae with holes (pathology) from depths of 1.69–1.76 m and 1.77–1.83 m. The youngest date for the lower level is 18,420 ± 45 14C yr BP (UGAMS-32278), obtained on a mammoth scapula from a depth of 1.58–1.79 m. The middle bone-bearing level in the 2016 excavation pit was clearly separated from the lower one, but its oldest date is 18,460 ± 45 14C yr BP (UGAMS-32277) (on a mammoth femur from a depth of 1.24–1.42 m), which overlaps with the age of the lower level. The youngest date of the middle level is 13,700 ± 35 14C yr BP (UGAMS-32275) on the mammoth pelvis from a depth of 1.04–1.38 m. The date of the bison bone from the arbitrary upper level is 16,750 ± 45 14C yr BP (UGAMS-32286).
Dates obtained from the 2017–2018 excavations clarify the age of the middle bone-bearing level. The spinous process of the vertebra and a fragment of the mammoth bone, found in 2017 at depths of 1.11–1.15 and 0.97–1.03 m, are dated to 16,550 ± 40 14C yr BP (UGAMS-32282) and 15,870 ± 40 14C yr BP (UGAMS-32281), respectively. The mammoth ulna and humerus, found in 2018 at depths of 0.74–0.94 and 0.73–0.93 m, are dated to 18,640 ± 40 14C yr BP (UGAMS-40949) and 10,620 ± 30 14C yr BP (UGAMS-40948), respectively (Table 2).
The boundaries of the central faunal assemblage were determined by drilling 60 boreholes (without sampling). As a result, it was found that the bone-bearing lens covers an area of >350 m2, with a maximum depth of remains at >3.5 m. In addition, two boreholes (with sampling of 95% of the core's length) were drilled at the foot of VG to clarify the summary geological section.
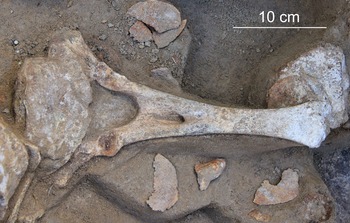
When we characterize the results of the fieldwork, it is important to note pathological changes on the mammoth bones found in 2015–2018. Moreover, they are recorded at all levels of the bone-bearing horizon in both assemblages. It should be recalled that a correct paleopathological analysis of the faunal materials collected at the VG site during the twentieth century excavations is impossible because of fragmentation and separation. However, in these collections, skeletal and dental abnormalities are also noted (Maschenko and Leshchinskiy, Reference Mashchenko, Leshchinskiy and Podobina2001; Shpansky, Reference Shpansky2014). A high degree of weathering and fragmentation of the remains makes the diagnosis of the skeletal diseases more complicated. However, exostoses, osteolysis, and peripheral erosion of the articular surfaces are clearly identified. Controversial destructions in the form of holes in the spinous processes of the vertebrae were also found (Figs. 5, 11). In general, this is usually a sign of osteodystrophy, which often develops due to a deficiency of vital macro- and microelements in the environment and, concomitantly, in forage and drinking water (Chepurov et al., Reference Chepurov, Cherkasova, Akulov, Ostrovskiy and Martynyuk1955; Kovalskiy, Reference Kovalskiy1974; Leshchinskiy, Reference Leshchinskiy2015; Leshchinskiy et al., Reference Leshchinskiy, Kuzmin, Boudin and Amon2021a).
Mammoth vertebra with a hole in the spinous process (2016 excavations).

Data on stable isotopes for bone collagen samples obtained from the central faunal assemblage (Table 2) indicate biogeochemical characteristics of the VG mammal diet. The atomic C/N ratios of the collagen for all samples (except one) are within the range of 2.9–3.6, which is recommended for reliable data (Ambrose, Reference Ambrose1990; Guiry and Szpak, Reference Guiry and Szpak2021). The δ13C and δ15N values of mammal bone samples are plotted relative to time (Figs. 12 and 13, respectively). The δ13C value range for mammoths is from −21.40‰ to −20.01‰, with an average of −20.56‰; for carnivores from −18.82‰ to −16.89‰, with an average of −18.00‰; the value for horse is −19.16‰, and for bison −19.23‰. The δ15N values for mammoths are from 7.90‰ to 14.67‰, with an average of 12.90‰; for carnivores from 16.20‰ to 17.10‰, with an average of 16.60‰; and values for horse and bison are 12.32‰ and 4.76‰, respectively.
δ13C values of VG mammal bone collagen through time.

δ15N values of VG mammal bone collagen through time.

Palynological research
Subaerial deposits are often characterized by a low concentration of plant remains, particularly pollen and spores. Basically, this is due to the slow rate of aeolian and colluvial sedimentation, which leads to long exposure of microfossils on the ground surface. Weathering and other geological processes contribute to the rapid destruction of pollen and spores, as well as to their transport and re-deposition. Loess-like deposits prevail in the upper part of the VG profile; therefore, samples for palynological analysis were collected from the cross-section of the ancient small gully along the southeastern wall of the 2016 excavation pit (Fig. 7). In this local erosional site, the bone-bearing lens of the central faunal assemblage was relatively quickly buried, probably by colluvial and coastal-lacustrine material.
Comparison with recent pollen spectra (PSs) was carried out on four samples (A, B, C, D) collected from the ground surface to a depth of as much as 1 cm. Different areas and plant associations were chosen for this: A and B—at the top of the VG mound, near the 2015 excavation pit and the birch forest outlier; C and D—at the foot of the VG mound, on the dry and boggy areas, respectively.
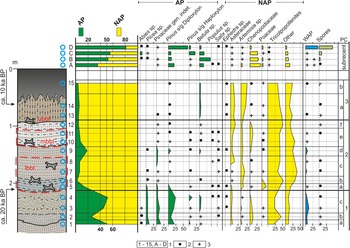
Laboratory preparation of the samples allowed retrieval of pollen and spores in sufficient quantities for statistical processing. Fragments of plant tissues, charcoal, and mineral particles were also found in all samples. Statistics on the results of palynological analysis are presented in Tables 3–5, and a pollen diagram in Figure 14.


Number and share of pollen grains and spores in samples 7–12 (AP and NAP as % of the main percentage sum, WAP and spores as % of AP+NAP).

Number and share of pollen grains and spores in samples 13–15, A–D (AP and NAP as % of the main percentage sum, WAP and spores as % of AP+NAP).

In the upper part of the VG section, including the bone-bearing horizon and underlying and overlapping sediments, three PCs are distinguished from bottom to top. In the first PC, tree pollen represents a significant part; in the second and third PCs, herb pollen prevails; their detailed descriptions are presented below.
PC1 characterizes the top of lacustrine-like sediments of the main body of VG and probably two subaerial layers underlying the bone-bearing horizon. Changes in the percentage of taxa made it possible to divide PC1 into three sub-complexes: PC1a, PC1b, and PC1c (Table 3; Fig. 14).
PC1a (PS of sample 1) and PC1c (PSs of samples 3, 4) are very similar to each other. The AP is 44.9–52.1% of the main percentage sum, dominated by Pinus spp. and Picea sp. Betula sp. also is constantly present, and more rarely, Abies sp. and Salix sp. About 25% of the main percentage sum in the NAP group belongs to Tricolpopollenites (three-furrow pollen with an unclear morphosculpture). In addition, pollen of Asteraceae, Chenopodiaceae, Poaceae, and other forbs (Rosaceae, Caryophillaceae, Cichoriaceae, Brassicaceae, Lamiaceae, Ranunculaceae, Valerianaceae) are present. The WAP (Cyperaceae, Potamogeton sp., Typha sp.) is constantly present, with its content of 4.7–11.4% of AP + NAP. Rare spores belong to Equisetum sp., Sphagnum sp., and ferns with Monoletes-type spores. The NPPs are represented by large numbers of Pediastrum sp. algae, and by rare fruit bodies of Glomus sp. fungi.
PC1b (PS sample 2) lies between the PC1a and the PC1c. It is characterized by an identical taxonomic composition of trees and herbs. The difference lies in the AP content, which drops to 25.1% of the main percentage sum, mainly due to an increase in the amount of Tricolpopollenites (46.4%). The WAP (Cyperaceae, Potamogeton sp.) accounts for 4.3% of AP + NAP. Rare spores belong to Sphagnum sp. and ferns with Monoletes-type spores. The NPPs are also represented by a large amount of Pediastrum sp. algae, and by rare fruit bodies of Glomus sp. fungi.
PC2 characterizes the lower and middle bone-bearing levels (sediments in the ancient gully) and the overlying subaerial sediments. In all PSs, the NAP is clearly dominant (80.6–98.1% of the main percentage sum). Changes in the percentage of individual taxa made it possible to divide PC2 into six sub-complexes: PC2a, PC2b, PC2c, PC2d, PC2e, and PC2f (Tables 3, 4; Fig. 14).
PC2a (PS of sample 5) reflects the very bottom of the bone-bearing horizon. The AP constitutes 14% of the main percentage sum, and this group is represented mainly by Pinus spp. The content of Picea sp. pollen is 3.9%. Therefore, the amount of NAP is 86%, dominated by Tricolpopollenites (40.1%), and sharply increased Poaceae (15.1%) and Artemisia sp. (7.9%). Ephedra sp. is also present. Other NAP includes forbs: Rosaceae, Brassicaceae, Scrophulariaceae, Cichoriaceae, Caryophillaceae, and Ranunculaceae. The WAP (Cyperaceae gen. indet. and Potamogeton sp.) constitutes 1.8% of AP + NAP. Very rare spores belong to Equisetum sp. and Sphagnum sp. NPPs are represented by rare remains of Pediastrum sp. algae, a large number of fruit bodies of Glomus sp. fungi, and hyphae and spores of unidentified fungal taxa.
PC2b (PS of sample 6) belongs to the lower bone-bearing level. The AP content is minimal for PC2 and amounts to 1.9% of the main percentage sum. This group is represented mainly by deformed and fragmented pollen of Pinaceae gen. indet., while pollen of Picea spp. and Betula sp. occur in very small quantities. The amount of NAP is 98.1%, and >58% belong to Tricolpopollenites and Artemisia sp. The content of Poaceae does not exceed 3.9%. Other NAPs include Rosaceae, Brassicaceae, Cichoriaceae, Caryophillaceae, and Ranunculaceae. Pollen of Chenopodiaceae, Ephedra sp., and WAP, and spores are absent. The NPPs consist of a large number of fruit bodies of Glomus sp. fungi, and hyphae and spores of unidentified fungal taxa.
PC2c (PSs of samples 7, 8) characterizes sediments of the main part of the lower bone-bearing level. The AP content is 6.5–6.7% of the main percentage sum. Pinus spp. predominates, including deformed and fragmented pollen of Pinaceae gen. indet. The NAP (93.3–93.5%) contains mainly Tricolpopollenites and Asteraceae, including Artemisia sp., with Ephedra sp. also present. Other NAP taxa are Caryophillaceae, Cichoriaceae, Fabaceae, Scrophulariaceae, Rosaceae, Brassicaceae, Ranunculaceae, Polygonaceae, Valerianaceae, and Primulaceae, including Plumbaginaceae with Limonium-type pollen. The PSs of this interval contain WAP (Cyperaceae, Potamogeton sp.), up to 3.9% of AP + NAP. The NPPs have large numbers of fruit bodies of Glomus sp. fungi, and hyphae and spores of unidentified fungal taxa, and phytoliths.
PС2d (PS of sample 9) is associated with sediments between the lower and middle bone-bearing levels. The AP content increases to 19.4% of the main percentage sum. Pollen of Pinus s/g Diploxylon predominates. Pollen of Betula sp. and Pinaceae gen. indet. is present in approximately equal amounts. The NAP (80.6%) is mainly represented by Tricolpopollenites, Chenopodiaceae, and Asteraceae including Artemisia sp. Pollen of Ephedra sp. is also present. Other NAP taxa are Caryophillaceae, Scrophulariaceae, Lamiaceae, Rosaceae, Brassicaceae, Ranunculaceae, and Polygonaceae. The content of WAP (Cyperaceae and Potamogeton sp.) increases to 7% of AP + NAP. The NPPs include a large number of fruit bodies of Glomus sp. fungi, and hyphae and spores of unidentified fungal taxa, and phytoliths.
PС2e (PSs of samples 10, 11) characterizes sediments of the middle bone-bearing level. The AP content is 6.3–7.5% of the main percentage sum. Deformed and fragmented pollen of Pinaceae gen. indet. predominates. Pinus s/g Diploxylon, Betula sp., Populus sp., and Salix sp. are constantly present. The NAP (92.5–93.7%) is characterized mainly by Tricolpopollenites (up to 40.1%). Increased content of Chenopodiaceae (up to 11.9%) is typical for this interval. Pollen of Ephedra sp. is absent. Other NAP taxa are Caryophillaceae, Cichoriaceae, Lamiaceae, Scrophulariaceae, Rosaceae, Brassicaceae, Ranunculaceae, Polygonaceae, and Silenaceae. The content of WAP is 1.6–2.2% of AP + NAP. NPPs are presented by a large quantity of fruit bodies of Glomus sp. fungi, and hyphae and spores of unidentified fungal taxa.
PC2f (PS of sample 12) likely characterizes the aeolian-colluvial sediments that overlap the middle bone-bearing level. The AP content (Pinaceae gen. indet., Betula sp.) is 4,7% of the main percentage sum. The NAP (95.3%) is represented mainly by Tricolpopollenites (50.8%) and Asteraceae (16.9%). Pollen of Ephedra sp., Poaceae, and WAP are absent. Other NAP taxa are Cichoriaceae, Lamiaceae, Rosaceae, Brassicaceae, Ranunculaceae, and Polygonaceae. NPPs are represented by many fruit bodies of Glomus sp. fungi, and hyphae and spores of unidentified fungal taxa.
PC3 is associated with the loess-like loam, with rare mammal remains of the upper bone-bearing level, and the middle part of the Holocene soil horizon. Pollen of Betula sp. dominates in the AP group of all samples. However, changes in the percentages of other taxa made it possible to divide PC3 into two sub-complexes: PC3a and PC3b (Table 5; Fig. 14). Also in all samples, NPPs contain fruit bodies of Glomus sp. fungi, and hyphae and spores of unidentified fungal taxa, and phytoliths of unidentified dicotyledons and Poaceae, and chitinous remains of invertebrates.
PC3a (PSs of samples 13, 14) contains an AP 4.8–5.9% of the main percentage sum. In addition to Betula sp., pollen of Pinus spp. is present sporadically. The NAP (94.1–95.2%) mainly consists of Tricolpopollenites and Asteraceae. Pollen of Ephedra sp. and Poaceae are constantly present. The content of Artemisia sp. increases from 9.6 to 21.1%, and decreases from 2.9% to a single grain of Chenopodiaceae. WAP is represented by single grain of Cyperaceae gen. indet. Rare spores belong to Lycopodium sp. and ferns with Monoletes-type spores.
PC3b (PS of sample 15) shows the amounts of AP and NAP as 3.7% and 96.3%, respectively. The taxonomic composition of pollen did not change compared to PC3a, but Betula sp. decreased, and the amount of Artemisia sp. increased. The WAP is represented by a single grain of Cyperaceae gen. indet. For the first time, a significant number of spores (5.4% of AP + NAP), mainly of Sphagnum sp., is detected.
The recent PC, although heterogeneous in the content of taxa, is generally of a harmonious type (Table 5, Fig. 14). In PSs of samples A, B and C, the AP content is in the range of 35.8–55.1% of the main percentage sum. In samples A and C, pollen of Pinus spp. predominates; and in sample B, Betula sp. is the main taxon. Besides, pollen of Picea sp. and Abies sp. is identified. The amount of NAP is 44.9–64.2% of the main percentage sum. Chenopodiaceae dominates in this group; Poaceae (including cultivated cereals), Tricolpopollenites, Asteraceae, and Artemisia sp. are constantly present. Ephedra sp. is found in the PS of sample C. Other NAP includes Caryophillaceae, Scrophulariaceae, Rosaceae, Brassicaceae, Ranunculaceae, Rubiaceae, Polygonaceae, and cultivated plants (Boraginaceae, Malvaceae, and Liliaceae). The WAP is represented by Cyperaceae gen. indet., Potamogeton sp., Sparganium sp., and Numphaeaceae. Spores belong to Sphagnum sp., Equisetum sp., and ferns with Monoletes-type spores.
AP content in the PS of sample D is 81.9% of the main percentage sum. The dominant taxa are Pinus spp. and Salix sp. The NAP is represented by Ephedra sp., Tricolpopollenites, Asteraceae, and Artemisia sp.; other NAP includes Brassicaceae, Lamiaceae, Malvaceae, Onagraceae, Ranunculaceae, Rosaceae, Silenaceae, and Rubiaceae. The WAP (dominated by Cyperaceae) accounts for 40.7% of AP + NAP. The amount of spores, mainly Equisetum sp., is 46.7% of AP + NAP.
NPPs in all recent samples are very diverse and present in large numbers. The fruit bodies of Glomus sp. fungi, hyphae and various spores of fungal taxa, and phytoliths were noted. In addition, the remains of amoeba and algae, including Pediastrum sp., were identified.
Paleoenvironmental stages
After summarizing the results of the geological and palynological data, the following interpretation can be proposed. Four stages of environmental development are revealed for the eastern part of the Baraba Lowland from ca. 20 14C ka BP to the present.
The first stage (PC1) probably lasted over one thousand years (the lower limit has not yet been determined) and ended ca. 20 14C ka BP. It reflects a sharp decrease in the level of a large lake-like water body, and the beginning of active erosion of drained coastal areas. Newly formed open spaces were occupied by forb-mesophytic meadows. This caused a sharp increase of the herb pollen content in PC1b against a background of unchanged taxonomic composition of trees. Taiga-type forests occupied the rest of the territory. Among the trees, pines dominated, but birch, spruce, and fir were also present. Despite shallowing, the water reservoir surrounding VG played a significant role. Willows and sedges grew in its coastal part, and cattail and pondweed grew in shallow waters.
The second stage (PC2) began ca. 20 14C ka BP and lasted no less than 6000–8000 years. This is the main formation period of the bone-bearing horizon. At that time, the climate became arid and led to a sharp degradation of forests. Forb-grass steppe became widespread. Saline lands and alkali meadows developed within the region, as indicated by the pollen of Plumbaginaceae (Limonium-type). Nevertheless, the lake continued to exist in the immediate vicinity of VG, although its level was not stable. During the period of accumulation of sediments separating the lower and middle bone-bearing levels, there was an increase in the proportion of trees with a dominance of pines (PC2d). At the same time, lake level increased, which led to the flooding of coastal areas and expansion of coastal and aquatic vegetation. There was a significant degradation of the lake in the final phase of this stage (PC2f).
The third stage (PC3) began at the end of the late glacial period, and ceased probably in the second half of the Holocene. Aridity of the climate increased. Loess-like loam containing rare mammal remains of the upper bone-bearing level was formed under conditions similar to those of the modern southern steppes of the West Siberian Plain, as indicated by the composition of rare tree pollen with a complete dominance of birch (PC3а). There were probably no lakes in the surrounding area. Formation of the Holocene soil horizon began after a hiatus. However low area bogs are recorded for its middle part (PC3b), although the steppes continued to dominate.
The latest stage (PSs A–D) is characterized by the prevalence of forest-steppe. The recent PC adequately reflects the modern regional and local vegetation. The APs of samples A, B, and C do not exceed 55.1% of the main percentage sum, and NAP is presented by a large number of taxa. Such PSs correspond to the forest-steppe zone. The PS of sample D shows an increased amount of AP due to local wetland conditions and excluding WAP from the main percentage sum. In the nearest forest belts, many pines (Pinus sylvestris L.) were planted in the twentieth century, and in Mamontovoe Village, spruce (Picea obovata Ledeb.) and fir (Abies sibirica Ledeb.) were also planted. These trees today are already mature and produce large amounts of pollen. Thus, a significant amount of AP belonging to Pinaceae can be seen in all recent PSs; only in the PS of sample B, which was taken near the birch forest outlier, was pollen of Betula sp. a dominant taxon.
DISCUSSION
Analysis of the VG sections and the site's taphonomy indicates that thousands of animal remains were buried here, mainly in mud pits and linear erosion forms. The structure of layers, the crushed bones and their steep-angled position indicate mixture of the sediments and trampling of subfossil skeletons by living mammoths and other large mammals. We interpret the presence of lithic artifacts as an indication that Paleolithic humans also participated in this process. It is important to note that the conclusion about the burial of mammoth remains in a gully already was made based on results of the initial fieldwork at VG (Polunin, Reference Polunin1961). The first large-scale excavations found evidence of inclined and vertical positions of some bones, and this clearly suggested the existence of mud pits and the presence of trampling. However, these were interpreted by archaeologists as the activity of ancient humans (Okladnikov et al., Reference Okladnikov, Grigorenko, Alexeeva and Volkov1971).
Despite the moistening (likely by sporadic flooding) of local areas within VG, dry environmental conditions prevailed during the formation of this site. Evidence of this is not only the result of palynological analysis, but also irregular open cracks inside the bone-bearing horizon and at the border with the underlying lacustrine-like sediments (Fig. 7). They are diagnosed as desiccation cracks, usually with a width up to several centimeters, although cracks up to 10 cm wide and 0.8 m long were recorded in the 1991 excavation pit (Maschenko and Leshchinskiy, Reference Mashchenko, Leshchinskiy and Podobina2001). These dimensions are not the largest ones—similar cracks up to 12.5 cm wide are described in contemporary silty sediments and giant desiccation cracks >3 m long in Mesozoic clay shale (Shrock, Reference Shrock1948; Reineck and Singh, Reference Reineck and Singh1975).
Therefore, the upper part of the VG section demonstrates a sharp change from subaqueous to subaerial sedimentation conditions, which is emphasized by the strong carbonatization of sediments at the contact of layers of different genesis, including desiccation cracks (Fig. 7). This points to a high concentration of alkaline earth and alkali elements in the ground and pore waters of sediments that form the geochemical landscape of VG. These elements—primarily Ca, Mg, and Na—and some trace elements create the basis for favorable geochemical landscapes, which are very attractive to large herbivores of past and present times, in particular, representatives of the Proboscidea (Cooper, Reference Cooper1831; Leshchinskiy, Reference Leshchinskiy, Cavarretta, Gioia, Mussi and Palombo2001, Reference Leshchinskiy2012, Reference Leshchinskiy2015; Walker et al., Reference Walker, Bockheim, Chapin, Eugster, Nelson and Ping2001; Holdø et al., Reference Holdø, Dudley and McDowell2002; Mwangi et al., Reference Mwangi, Milewski and Wahungu2004; Haynes, Reference Haynes2012). At the end of the Pleistocene, mineral starvation caused by chronic geochemical stress led to the concentration of large mammals around the beast solonetz. Here, in addition to vegetation, animals could consume sediments, along with surface and/or groundwater, rich in vital macro- and microelements (Leshchinskiy, Reference Leshchinskiy2006, Reference Leshchinskiy2009, Reference Leshchinskiy2015). Thus, lithophagy was probably the main reason for the visits of megafauna to the VG.
The abnormal diet of VG mammals is confirmed by the isotopic composition of bone collagen (Table 2; Figs. 12, 13). The available nutritional data on the late Pleistocene populations of Europe, Siberia, and Eastern Beringia indicate their sharp difference from those at the VG site (Figs. 15, 16). This is clear from the δ15N value, which for most VG mammoths is between 13.00‰ and 15.00‰, with only one individual having a significantly lower δ15N value (7.90‰). For comparison, these ratios in late Pleistocene mammoths are not greater than 12.60‰, and their average values for the interval 20–10 14C ka BP are <10‰. The δ15N ratios of the VG fox and wolves varied from 16.20–17.10‰, which significantly exceeds values for these carnivores during the late Pleistocene and Holocene (3.90–14.20‰). The δ13C values of the VG mammoths are in the middle of the range for this species, and the VG fox and wolf δ13C values are from −18.82‰ to −16.89‰, which are possibly the maximum for canids of Europe, Siberia, and Eastern Beringia (Bocherens et al., Reference Bocherens, Pacaud, Lazarev and Mariotti1996; Bocherens and Drucker, Reference Bocherens and Drucker2003; Szpak et al., Reference Szpak, Gröcke, Debruyne, MacPhee, Guthrie, Froese, Zazula, Patterson and Poinar2010; Drucker et al., Reference Drucker, Vercoutère, Chiotti, Nespoulet, Crépin, Conard and Münzel2015, 2017, 2018; Jürgensen et al., Reference Jürgensen, Drucker, Stuart, Schneider, Buuveibaatar and Bocherens2017; Rabanus-Wallace et al., Reference Rabanus-Wallace, Wooller, Zazula, Shute, Jahren, Kosintsev, Burns, Breen, Llamas and Cooper2017; Seuru et al., Reference Seuru, Leshchinskiy, Auguste and Fedyaev2017; Kuitems et al., Reference Kuitems, van Kolfschoten, Tikhonov and van der Plicht2019; Wißing et al., Reference Wißing, Rougier, Baumann, Comeyne, Crevecoeur, Drucker and Gaudzinski-Windheuser2019; Kuzmin et al., Reference Kuzmin, Bondarev, Kosintsev and Zazovskaya2021). The single isotopic values of the VG horse and bison bones can be considered as preliminary.
The δ13C and δ15N values of woolly mammoth bone collagen from VG (circles), compared to ranges from Europe (red box), Siberia (blue box), and Eastern Beringia (green box) (Bocherens et al., Reference Bocherens, Pacaud, Lazarev and Mariotti1996; Szpak et al., Reference Szpak, Gröcke, Debruyne, MacPhee, Guthrie, Froese, Zazula, Patterson and Poinar2010; Drucker et al., Reference Drucker, Vercoutère, Chiotti, Nespoulet, Crépin, Conard and Münzel2015, 2018; Seuru et al., Reference Seuru, Leshchinskiy, Auguste and Fedyaev2017; Kuitems et al., Reference Kuitems, van Kolfschoten, Tikhonov and van der Plicht2019; Kuzmin et al., Reference Kuzmin, Bondarev, Kosintsev and Zazovskaya2021).

The δ13C and δ15N values of canine bone collagen from VG (squares), compared to ranges from Europe (red box), Siberia (blue box), and Eastern Beringia (green box) (Bocherens et al., Reference Bocherens, Pacaud, Lazarev and Mariotti1996; Bocherens and Drucker, Reference Bocherens and Drucker2003; Bocherens, Reference Bocherens2015; Drucker et al., Reference Drucker, Naito, Péan, Prat, Crépin, Chikaraishi and Ohkouchi2017, 2018; Kuzmin et al., Reference Kuzmin, Bondarev, Kosintsev and Zazovskaya2021).

The results of isotopic studies demonstrate the special nutritional characteristics of the VG mammoth fauna. The very high mammoth δ15N values are noteworthy, and are expected for the ecosystem of the fertile forb-grass mammoth steppe under conditions of favorable geochemical landscapes. Moreover, VG mammoths showed higher δ15N values than both horse and bison, and these are consistent with the canine δ15N values, which were observed previously in studies of the late Pleistocene mammoth steppe and suggested by the classic isotopic model (Bocherens et al., Reference Bocherens, Pacaud, Lazarev and Mariotti1996; Fox-Dobbs et al., Reference Fox-Dobbs, Leonard and Koch2008; Bocherens, Reference Bocherens2015; Drucker et al., Reference Drucker, Stevens, Germonpré, Sablin, Péan and Bocherens2018). At VG, the canine δ13C and δ15N values are higher than those of mammoth, horse, and bison, which are consistent with trophic enrichment of the carnivores. The fox and wolves analyzed at VG showed similarly high δ13C and δ15N values, which could indicate that large herbivores were the basis of their diet (in which case, the foxes were scavengers). The differences between the δ13C and δ15N values in the bone collagen of VG canids, on the one hand, and the coeval mammoth and horse from VG, on the other hand, are ~2.1 ± 1.8‰ and ~3.2 ± 1.6‰. This is similar to the estimates for δ13C and the δ15N differences between the collagen of predators and their average prey, obtained from modern and archaeological data: 1.1 ± 0.2‰ and 3.8 ± 1.1‰, respectively (Bocherens, Reference Bocherens2015). At the same time, the relatively low δ15N values of a bison and one mammoth most likely indicate long-term migrations of several large mammal populations from remote areas where environmental conditions were worse than at VG.
In any case, at the peak of mineral deficiency, dozens (possibly hundreds, especially during migrations, rutting, lactation, etc.) of large mammals were concentrated at VG. Their relatively high mortality and favorable conditions for burial of their remains contributed to the formation of the discontinuous, but still very rich, bone-bearing horizon. The taphonomic differences and changes in the geological structure of the VG site along its expanse are important. As noted above, the bone-bearing horizon in the northeastern assemblage is a single body (Figs. 2, 3). Slow subaerial sedimentation was the reason for the superimposition of faunal remains of different ages. Therefore, the allocation of three levels in the northeastern part of VG is arbitrary, and is associated with the excavation technique used (Maschenko and Leshchinskiy, Reference Mashchenko, Leshchinskiy and Podobina2001; Leshchinskiy et al., Reference Leshchinskiy, Kuzmin, Zenin and Jull2008, Reference Leshchinskiy2015). The faunal remains were buried in a semi-flat, low depression, which turned into a mud pit when conditions became wet. However, despite the obvious trampling of individual bones, the zero stage of bone weathering here is absent or very rare. This indicates a long exposure of animal carcasses on the ground surface: for the upper and middle parts of the bone-bearing horizon, where stages 4 and 5 prevail, it can be estimated as >10–25 years, and for the bottom of the bone-bearing stratum, where weathering is mainly of stages 2 and 3, at least five years after the death of animals (Behrensmeyer, Reference Behrensmeyer1978; Haynes, Reference Haynes1999).
The bone-bearing horizon of the central assemblage sometimes can be divided into three levels (Figs. 4–9). In the lower level, the remains are perfectly preserved. They have mainly weathering stages 0 and 1, which is associated with rapid burial in a local erosional form (small gully), probably up to three years after the death of animals. The overlying remains from the middle level were confined to those already present in the lower level, which from time to time turned into a typical mud pit. Therefore, the taphonomic characteristics of the middle and upper levels, where animal remains are very rare (possibly, re-deposited), are almost the same here as in the northeastern assemblage.
Modern elephants often move the bones and tusks of deceased relatives, especially in places of their concentration (e.g., near watering sites and on mineral licks). They also transform the microrelief by digging large pits and even caves using tusks and limbs during their search for mineral-containing sediments (Haynes, Reference Haynes2012). This behavior probably also was typical for mammoths, which could greatly alter the primary structure of thanatocoenosis and stratigraphy at faunal localities. Therefore, inversions of 14C dates recorded at VG and other large megafaunal sites (Table 2; Derevianko et al., Reference Derevianko, Zenin, Leshchinskiy and Mashchenko2000; Leshchinskiy et al., Reference Leshchinskiy, Kuzmin, Zenin and Jull2008) are not always the result of errors associated with poor sampling, contamination, or other flaws of either researchers or the 14C dating method. Such inversions can be explained by the re-deposition of bones, trampling, digging, and other taphonomic phenomena, including human activity.
Nevertheless, the new results of radiocarbon dating show a sharp peak of mammoth mortality at the VG during the period of ca. 20–18 14C ka BP, and a smoothed peak at ca. 17–11 14C ka BP (Tables 1, 2). This largely corresponds to the lower and middle bone-bearing levels, the formation of which indicates high levels of animal activity on the beast solonetz. If lithophagy was the main reason for animals to visit VG, it reflects two waves of geochemical stress of the mammoth fauna. At the same time, the oldest 14C dates were obtained on horse bones, although they did not occupy the lowest position in the sections. Perhaps, this is a case related to an insufficient degree of sampling. Another explanation may be that the horses were more mobile than mammoths, which allowed them to be the first to occupy drained spaces with favorable geochemical landscapes.
The 2015–2018 research showed that the mammoths of the Baraba refugium at the LGM were significantly larger compared to mammoths of the late glacial period. The presence of very large and small adult individuals and two morphological types of teeth in the bone-bearing horizon of VG was already noted when material from the northeastern assemblage of 1991 was examined (Maschenko and Leshchinskiy, Reference Mashchenko, Leshchinskiy and Podobina2001). Today this fact can be explained by the superimposition of faunal remains of different ages that belong to two different mammoth populations, separated in time by at least 1000 years. This is not an anomaly, but reflects the general trend of adaptive size reduction when mammoth mortality at the end of the Pleistocene was high (Leshchinskiy, Reference Leshchinskiy2006, Reference Leshchinskiy2015).
The large local concentration of mammoth remains at VG (50 to >130/m2 in the 2015–2018 excavations area) can be compared with the alluvial site of Berelyokh (Northern Yakutia), where in some sectors specimens numbering up to 50/m3 were recorded (Vereshchagin, Reference Vereshchagin and Starobogatov1977). Thus, today the VG mammoth concentration is the highest in Asia with in situ burial conditions. Obviously, the initial concentration of remains at the VG subaerial thanatocoenosis was even higher, since significant weathering and carnivores completely destroyed a certain number of bones, especially of calves. Despite this, preliminary results of new investigations confirm the conclusion of a high proportion of immature mammoths in the age profiles of MIS 2 (Sartanian according to the Western Siberia stratigraphic scale) sites in Siberia (Leshchinskiy, Reference Leshchinskiy2015, Reference Leshchinskiy2017). It should be noted that the identified minor role of predators and scavengers in the formation of the VG site may be an underestimate, since the outer lamellar compact bone, on which small traces of tooth marks can be observed, is usually absent at weathering stages 3–5. This is also true for the thin cut marks on bones made by ancient humans.
Humans actively hunted large mammals, and they most probably also killed mammoths, but relatively rarely—for example, when mammoths fell into natural traps or were weak (pregnant females, or injured, sick, exhausted, and old individuals, or young animals) (Zenin et al., Reference Zenin, Leshchinskiy, Zolotarev, Grootes and Nadeau2006). At VG, people also could have used the remains of mammoths that died because of predators, diseases, injuries, and other causes. Moreover, human visits to VG were purposeful and systematic in nature because most of the artifacts found here are ‘exotic’—made of rock crystal and smoky quartz, the sources of which are located several hundred kilometers from VG (Leshchinskiy et al., Reference Leshchinskiy, Zenin and Bukharova2021b). Similar conclusions were made after studying other large subaerial and lacustrine-alluvial mammoth sites of the late Pleistocene in Siberia (Vereshchagin, Reference Vereshchagin and Starobogatov1977; Derevianko et al., Reference Derevianko, Zenin, Leshchinskiy and Mashchenko2000; Zenin et al., Reference Zenin, Leshchinskiy, Zolotarev, Grootes and Nadeau2006; Seuru et al., Reference Seuru, Leshchinskiy, Auguste and Fedyaev2017).
The taxonomic composition of mammals and the results of analysis of geological sections and taphonomy at VG are fully consistent with the data provided by palynological studies. Representative materials of pollen, spores, and other microfossils, together with the data presented above, for the first time made it possible to reconstruct in detail the history of landscape changes in the Baraba Lowland during the Sartanian in Siberia.
The natural environment before accumulation of the bone-bearing horizon was quite different from the contemporary one (e.g., conditions were wetter than today). This was determined by palynological data, using the presence of forest areas of the taiga-type, with a significant role of spruce. However, since the beginning of the formation of the megafaunal site, a pronounced aridization of the climate occurred. The open spaces of the mammoth steppe were widespread, where forb-grass associations with areas of alkaline meadows and alkali soils dominated.
Thus, at ca. 20 14C ka BP, the forests in the Baraba Lowland disappeared. Since this time, steppes dominated at least until the mid-Holocene. It is important to note that in the middle part of the Holocene soil horizon, for the first time a relatively large amount of Sphagnum sp. spores are recorded, and this indicates the development of swamps. This is consistent with data on the beginning of paludification of the lakes in the south of the West Siberian Plain since ca. 6–5.5 14C ka BP (Orlova, Reference Orlova1990; Levina and Orlova, Reference Levina and Orlova1993; Liss et al., Reference Liss, Abramova, Avetov, Berezina, Inisheva, Kurnushkova, Sluka, Tolpysheva and Shvedchikova2001; Krivonogov et al., Reference Krivonogov, Gusev, Parkhomchuk and Zhilich2018). The domination of open landscapes with rich herb cover from the last glacial maximum to the mid-Holocene is confirmed by the remains of woolly mammoth, horse, bison, and other representatives of the megafauna found in the Baraba Lowland where, in addition to VG, such finds were made at other sites (van der Plicht et al., Reference van der Plicht, Molodin, Kuzmin, Vasiliev, Postnov and Slavinsky2015; Puzachenko et al., Reference Puzachenko, Markova, Kosintsev, van Kolfschoten, van der Plicht, Kuznetsova, Tikhonov, Ponomarev, Kuitems and Bachura2017).
Currently, the Baraba Lowland is located in the forest-steppe zone of the Ob-Irtysh interfluve. Open landscapes, unchanged by human activities, are covered with steppe halophytic-grass meadows. In forest outliers, birch dominates; willow and aspen are also found. The modern climate is markedly continental. According to observations from the middle of the twentieth century, the average air temperatures are (at the nearest meteorological stations in Kamen-on-Ob and Barabinsk): for July 18.3–19.7°С, and for January −19.1–18.2°С. The average annual temperature is 0.5–1.2°С, with a range of 85– 95°С. The annual precipitation is 315–450 mm (Arhiv klimaticheskih dannyh, 2012; Pogoda i klimat, 2020).
Several scenarios for development of the natural environment during the Sartanian were previously proposed for the Baraba Lowland. They were mainly based on geological and geomorphological data, and the studies of paleosols and mammoth fauna. The lack of associated palynological data was a serious obstacle to the in-depth analysis of past natural conditions. The nearest sections, in which pollen and spore complexes of the MIS 2 period were identified, are located in the steppe and taiga zones, 250–440 km south and north of VG. Therefore, reconstructions obtained by extrapolating the results of palynological and biome analyses from neighboring territories are basically hypothetical (Arkhipov and Volkova, Reference Arkhipov and Volkova1994; Tarasov, Reference Tarasov, Kaplin and Sudakova2000; Binney et al., Reference Binney, Edwards, Macias-Fauria, Lozhkin, Anderson, Kaplan and Andreev2017). However, some of them also suggested the prevalence of cold forb-grass and wormwood-forb steppes in this region (Grichuk, Reference Grichuk and Velichko2002).
In general, the terminal Pleistocene in the south of the West Siberian Plain was characterized by extreme environmental conditions. Some authors attributed this to the existence of the giant ice-dammed Lake Mansi, whose bays penetrated far into the Baraba Lowland (Arkhipov and Volkova, Reference Arkhipov and Volkova1994; Volkova and Mikhailova, Reference Volkova and Mikhailova2001). Therefore, this area on the paleogeographic maps for the last glacial maximum is often represented by forest-tundra and green-moss bogs. According to the same data for the late glacial period, a transformation into dry tundra probably occurred, in which xerophyte-Chenopodiaceae associations dominated. It was assumed that the average annual air temperature at that time dropped to −11°С. Other authors suggested that the entire West Siberian Plain during ca. 20–11 14C ka BP was a region of maximum aridization (i.e., a cold desert); in the south, loess accumulation predominated (Velichko et al., Reference Velichko, Timireva, Kremenetski, MacDonald and Smith2011). This concept is shared by researchers working in the Lake Aksor depression (51°27′N, 77°47′E) in the extreme south of the West Siberian Plain. For the first half of the Sartanian, a desert regime with wind erosion was prevalent here; during periodic wettings, a lake was formed and drained eight times, and afterwards it drained. Moreover, the authors note an extreme range of average annual temperatures between −3°C and −20°C (Zykin et al., Reference Zykin, Zykina, Orlova, Vaganov, Derevianko, Grachev, Zykin and Markin2002; Zykin and Zykina, Reference Zykin and Zykina2009). Notably, supporters of both concepts mentioned above consider aeolian activity as the main agent for the formation of elongated mounds in the Baraba Lowland. Altogether, this implies very severe environmental conditions, which supposedly made vast territories poorly suitable for existence of large mammals.
The traditional environmental reconstructions presented above are not confirmed by the latest studies of VG, which indicate widespread occurrence of forb steppe landscapes from ca. 20 14C ka BP to the mid-Holocene. The concepts of Lake Mansi and the cold desert come into apparent conflict with the geological structure of the Baraba Lowland. Our research indicates water erosion origins of elongated mounds, which are only covered with thin subaerial sediments that rarely exceed a thickness of 1.5 m. A similar conclusion was put forward at the beginning of the twentieth century, and the hypothesis of Eurasian hydrosphere catastrophes was formed, explaining the mechanism of formation of the elongated mound relief (Petrov, Reference Petrov1948; Grosswald, Reference Grosswald1999). Despite a number of problematic issues, this hypothesis has been actively put forward in recent years (e.g., Komatsu et al., Reference Komatsu, Baker, Arzhannikov, Gallagher, Arzhannikova, Murana and Oguchi2016). Modern data indicate the absence of continental glaciation in Western Siberia and the presence of free north-flowing rivers in MIS 2 (Mangerud et al., Reference Mangerud, Jakobsson, Alexanderson, Astakhov, Clarke, Henriksen and Hjort2004). Therefore, a new discussion arose about a large lake-like water body in the Baraba Lowland at the beginning of MIS 2 and its sharp reduction with non-cyclic fluctuations in water level after ca. 20 14C ka BP. Our geological and palynological data (Fig. 14) clearly favor this scenario. Perhaps this reservoir was associated with surface water flows, which, according to some authors, could have arisen during catastrophic flood events caused by outbursts of the glacier-dammed lakes in the Altai Mountains (Agatova et al., Reference Agatova, Nepop, Carling, Bohorquez, Khazin, Zhdanova and Moska2020; Herget et al., Reference Herget, Agatova, Carling and Nepop2020). However, more research is needed to confirm or refute this hypothesis.
CONCLUSIONS
The unique combination of depressions of the VG microrelief with the periodic death of animals within it explains the formation of a mammoth fauna site at this locus. The favorable geochemical landscape of the beast solonetz for a long period (ca. 20–10 14C ka BP) attracted large Pleistocene animals, the remains of which formed an extensive and thick bone-bearing horizon. Within the last glacial maximum and late glacial, two peaks of high mortality for large mammals were established, and they generally may reflect waves of geochemical stress on animal populations. Humans were both witnesses to and participants in this process. However, the rarity of lithic artifacts and the absence of direct evidence of mammoth hunting and butchering of their carcasses confirm that the VG site was primarily a place of natural death for the megafauna.
The high mortality of large herbivores in a limited area is explained by periodic visits of animals to the mineral oasis for millennia. In certain seasons, the concentration of animals could have reached several hundred, and some weak individuals would have been easy prey for carnivores, died from exhaustion, diseases, or a combination of different factors. Bones with various signs of osteodystrophy convincingly indicate that this is a likely scenario. Thus, the presence of thousands of mammoth remains at VG probably shows chronic mineral starvation during the last mass extinction.
The large area and a record concentration of faunal remains put the VG site into the category of the largest in situ mammoth fauna locality in Asia. At present, no more than 5% of the site's total area, which may amount to several hectares, has been excavated. Most likely, in the well known central assemblage alone, >10,000 bones and teeth of mammoths, as well as other late Pleistocene mammals, were buried. The long formation period, unique taphonomic conditions, relatively high concentration of pollen and spores in sediments, and the availability of human-related materials (artifacts) testify in favor of the highest prospects for interdisciplinary research in the coming decades.
It should be emphasized that the presented environmental reconstruction is currently the most complete for the Baraba Lowland at ca. 20–10 14C ka BP (PC1–PC3a). For the first time, it reliably shows the wide distribution of steppes in the south of the West Siberian Plain in that period. Thus, the VG site as a whole is now one of the main objects to investigate the late Pleistocene ecosystems of Northern Eurasia.
Acknowledgments
We are deeply indebted to A.V. Gulina, N.Ya. Fedyaev, A.T. Dzhumanov, A.S. Samandrosova, A.S. Semiryakov, E.V. Kanishcheva, S.S. Perfilev, N.A. Shilovskiy, E.Yu. Samoylova, D.V. Tumantseva, A.Yu. Kolesova, and A.A. Zolotarev (TSU); V.N. Zenin and A.A. Dudko (Institute of Archaeology and Ethnography, Siberian Branch of the Russian Academy of Sciences, Novosibirsk, Russia); S.A. Kravchuk and N.S. Kravchuk (Berdsk Town, Russia); D.Y. Kadochnikov (Mamontovoe Village, Russia); U. Ratajczak and A. Kotowski (University of Wrocław, Poland); and Ya.S. Trubin and N.V. Utkin (Industrial University of Tyumen, Russia) for the comprehensive assistance in conducting field and laboratory studies. Many thanks to B.N. Ermakov and S.V. Gayduk, heads of the local administration in 2015–2016 and 2017–2018, for support and the opportunity to conduct excavations within Mamontovoe Village. We also are grateful to S.G. Keates and Y.V. Kuzmin for polishing the English.
Expeditions were conducted within the TSU Competitiveness Improvement Program, and the State Task of the Ministry of Education and Science of the Russian Federation, Project No. 5.4217.2017/4.6. The main laboratory research, final processing of the paleontological materials, and comparative analysis were funded by the Russian Science Foundation, Grant No. 20-17-00033.