


The importance of the use of reliable and valid instruments in research cannot be sufficiently emphasised, especially when evaluating knowledge(Reference Murray1–Reference Charlton3). In South Africa, a sixty-item test questionnaire was developed in 2004 to measure the nutrition knowledge of 13–14-year-old adolescents taking part in a longitudinal study known as the Birth to Twenty study (BTT)(Reference Whati, Senekal, Steyn, Nel, Lombard and Norris4). The BTT study, initiated in 1990, follows a cohort of African urban children in Soweto–Johannesburg from birth to 20 years of age and investigates the biological, environmental, economic and psychosocial factors that are associated with the health of children born and living in urban areas in South Africa. The nutrition knowledge questionnaire was developed because no reliable and valid questionnaire was available to assess the nutrition knowledge of South African adolescents living in urban areas. The developed instrument ensured face, content and construct validity and it had an internal consistency (Cronbach’s alpha) of 0·77. The final sixty-item questionnaire includes true/false and multiple-choice question options that are largely based on the South African food-based dietary guidelines(Reference Whati, Senekal, Steyn, Nel, Lombard and Norris4).
Following on from the development of the questionnaire it was realised that, in order to facilitate effective and accurate interpretation of the scores obtained by testees, the development of a performance-rating scale was necessary.
Performance-rating scales are developed by transforming the actual scores of a large representative population into a standard scale to which the performance of a similar group or an individual can be compared(Reference Schagen5). Performance-rating scales can be criterion-referenced, content-referenced or norm-referenced(Reference Mackloskey6). A criterion-referenced performance-rating scale rates a person’s performance in relation to mastery levels(Reference Mackloskey6), which is the testee’s ability to perform a given set of competencies independently of other test-takers(Reference Shrock and Coscarelli7). Content-referenced performance-rating scales are based on a range of objectives for developmental skills and therefore rate the number of objectives that have been accomplished by a person(Reference Mackloskey6). A norm-referenced performance-rating scale rates a person’s performance in relation to that of others(Reference Shrock and Coscarelli7, Reference Thomas-Tate, Washington and Edwards8). The scale is therefore based on a set of scores that were derived from a large group of individuals (norm group) that is representative of a given population(Reference Morganthau9). To develop this type of scale, the norm group is tested and the actual scores obtained on the questionnaire manipulated to produce reference scores such as stanines, percentiles, T-scores, grade equivalents, age equivalents or age-standardised scales(Reference Schagen5, Reference Mackloskey6, Reference Taylor and Walton10). These reference scores can then be used to rate the performance of other groups or individuals after the same test has been administered to them.
Since the aim of the BTT cohort study was to compare and monitor nutrition knowledge levels over a period of time (year 13 to 20 of the study), the questionnaire developers decided that a norm-referenced performance-rating scale would be the most appropriate rating scale to use for interpreting and monitoring the test scores of participants.
The first step in the development of a norm-referenced performance-rating scale (from hereon referred to as a ‘norms’) involves administering the questionnaire to a large representative group referred to as the ‘norm group’. The norm group’s scores are then ranked from the lowest to the highest performance. To be acceptable as norms, these scores should graphically form a normal distribution (bell-shaped) curve, according to which 50 % of the norm group should score below the average and 50 % above the average(Reference Taylor and Walton10). The resulting norms can then be used to determine whether a group or an individual performed below or above the average for their country, age or gender(Reference Hopman, Towheed and Anastassiades11).
Finally, the question of validity of the norms arises. Most published articles on the development of norms do not refer to this issue. However, to ensure a high standard of research, we decided that assessment of the validity of the developed norms should also be undertaken. Validity in this context can be described as the ability of the norms to accurately reflect the performance of the testees.
The aim of the current paper is to describe the development (stage 1) and validation (stage 2) of norms for the nutrition knowledge questionnaire developed by Whati et al.(Reference Whati, Senekal, Steyn, Nel, Lombard and Norris4) for the purpose of comparing and monitoring nutrition knowledge levels in the BTT study.
Stage 1: development of norms
Methods
Study design and study population
For the purpose of developing norms, the nutrition knowledge questionnaire had to be administered to a study population representative of the proposed target group(Reference Hopman, Towheed and Anastassiades11). In the present study the target group included urban adolescents participating in the BTT study. The questionnaire was to be administered to the BTT cohort group for the first time at age 13–14 years, and then every second year thereafter until the group reached age 20 years, to track changes in nutrition knowledge over the 6-year period. Scholars in grades 8, 10 and 12 in urban schools in the Soweto–Johannesburg area were seen as most representative of the mentioned age groups and thus an appropriate study population to use for the formulation of norms.
Four high schools in Johannesburg and Soweto were randomly selected from the Department of Education’s list of public schools in the area. Three schools (75 % response rate) gave consent for their scholars to participate in the study. Two of the schools (A, B) are in Soweto and are attended by black scholars only. One of the schools (C) is multiracial and situated in Johannesburg. All learners in the designated grades who were present on the test day completed the questionnaire. The final study population comprised 512 scholars in grades 8 (n 158), 10 (n 149) and 12 (n 205). The norm group was highly representative of the BTT cohort since children were from the same geographical area of Soweto–Johannesburg, with the result that they attended similar schools in terms of location and available educational facilities. Consequently the composition of the norm group was similar to that of the BTT group in terms of race, gender and socio-economic background(Reference Richter, Norris and De Wet12).
Ethical approval
The study was approved by the Ethics Committee of the University of The Witwatersrand as part of the BTT protocol. Oral consent was obtained from principals of the schools included in the sample and written informed consent was obtained from each learner.
Data collection and analyses
All of the scholars (n 512) completed the questionnaire under supervised test conditions. For all items in the nutrition knowledge questionnaire, whether true/false or multiple choice, there was only one correct answer. Each correct response was allocated one point and an incorrect or no response was allocated zero points. Items to which a participant failed to respond (blank values) were also regarded as incorrect responses. The resulting scores were used for data analysis using the SAS System for Windows statistical software package version 8·2 (SAS Institute, Cary, NC, USA). The first step in data analysis involved testing the normal distribution of the scores (from hereon referred to as ‘performance scores’) obtained by the norm group, using the Shapiro–Wilk test. The performance scores represent the score (in percentage) for each individual obtained after completing the nutrition knowledge test.
The second step involved converting the performance scores (percentages) for the total study population to Z-scores by transforming the scores into variables that have a mean of ‘0’ and a standard deviation of ‘1’ so that scores are expressed in standard deviation units. The following equation was used for this purpose(Reference Miller13, Reference Streiner and Norman14):

However, Z-scores are generally not easy to use in interpreting scores. Therefore, the resulting Z-scores were divided into nine numerical categories of equal length referred to as stanines (Table 1). These categories represent a range of performance ratings starting from the lowest (stanine 1) to the highest (stanine 9). A representative norm sample should provide a performance-rating distribution curve similar to that shown in Fig. 1. This figure indicates that 4 % of the norm group should achieve Z-scores that will place them under stanine 1 and another 4 % under stanine 9, 7 % of Z-scores should be under stanines 2 and 8, 12 % under stanines 3 and 7, 17 % under stanines 4 and 8, and 20 % under stanine 5. The interpretation of each stanine, based on the five categories suggested by Miller(Reference Miller13), is also illustrated in Fig. 1. For example, if a subject’s Z-score places him/her under stanine 5, his/her performance is rated as average. The performance is rated as above average if under stanines 6, 7 or 8, and as outstanding if under stanine 9. A Z-score that places a subject under stanine 2, 3 or 4 indicates below average performance and under stanine 1 as very poor performance. To ensure easy and effective interpretation of each testee’s performance, the stanine cut-off points were transformed from Z-scores back to percentage scores using the equation:
Z-score cut-off points for stanines (adapted from Miller(Reference Miller13))

Application of stanines in performance rating (adapted from Miller(Reference Miller13))


Results and discussion of Stage 1
The Shapiro–Wilk test for normality resulted in a P value of 0·03, which could be interpreted as an indication that the distribution of the sample was normal (plus a normally distributed plot) using a reference probability of 0·01 (90 % CI). The stanine distribution of the Z-scores for the total norm group is presented in Fig. 2. The stanine distribution for the norm group is very close to the bell-shaped curve illustrated in Fig. 1, which is indicative of a normal distribution. This indicates that the population selected for the purpose of developing norms for the nutrition knowledge questionnaire developed for the BTT cohort was suitable, as an acceptable range of scores ranging from poor to outstanding was evident.
Stanine distribution based on the Z-scores of the norm group (n 512)

Figure 3(a) to 3(d) represents the stanine distributions of grade 12 children at the different schools. The same pattern was followed for all the grades; hence only grade 12 is shown. It is evident that the distributions were different from the normal curve obtained for the total norm group (Fig. 2) and displayed a shift to the left or right depending on the school attended. For grade 8–12 scholars from school C, the curve was shifted towards the right with more scholars falling under stanines 5, 6 and 7 than under the lower stanines, indicating that adolescents attending this particular school performed at or above average on the nutrition knowledge questionnaire. However, the opposite applied in the case of grade 8–12 scholars from schools A and B: more of these adolescents fell under stanines 3, 4 and 5 and few under stanines 8 and 9, indicating that most of the adolescents performed at or below average.
Stanine distribution of the Z-scores of grade 12 children: (a) at school A (n 41); (b) at school B (n 110); (c) at school C (n 54); and (d) all grade 12 black adolescents (n 205)

To understand these trends it is important to consider the backgrounds of the different schools. School C is a historically and economically advantaged white school, while in contrast schools A and B are historically and economically disadvantaged schools where the injustices of South Africa’s apartheid policy government are still in the process of being corrected. From the results it is clear that those attending the more affluent school performed a lot better than those attending the poorer/less affluent schools, indicating that socio-economic status could have played a role in the differences in performance by scholars from the two sets of schools.
This trend is supported by the findings of other researchers. Thomas-Tate et al.(Reference Thomas-Tate, Washington and Edwards8) highlighted the negative effect poverty has on the amount of home training first graders from a low-income families receive. This was seen to contribute to such children’s poorer language development, resulting in a poorer vocabulary and poorer reading skills in later grades. Willie(Reference Willie15) also referred to social scientists’ belief that differences in achievement between minority and white groups are due to the higher incidence of poverty in families of minority groups in urban areas of the USA. In that study, black and white students in poverty-concentrated, socio-economically mixed and affluent-concentrated school contexts were evaluated. The research showed that a higher proportion of students who scored below the national norm were from poverty-concentrated schools, irrespective of racial group. Low-income black Americans were also found to exhibit delayed language skills and use of few conceptual categories and abstractions(Reference Castenell and Castenell16). This phenomenon was found to be linked to their cultural heritage, political background of slavery, discrimination and socialisation that resulted in their preference to intuitive rather than deductive reasoning; approximation of concepts such as space, number and time rather than striving for exactness; and dependence on non-verbal rather than verbal skills and being object-orientated.
All of these studies implicate socio-economic status as one of the main cause of disparities in academic performance found between black and white students. Within the framework of the findings by the above-mentioned researchers, it can be speculated that the inequalities associated with past and current socio-economic backgrounds of scholars attending school C on the one hand and schools A and B on the other hand could explain the differences in performance displayed by the scholars.
When the performance of scholars attending the schools was compared based on grade levels (not shown), both similarities and differences were found. Overall, the performance of the grade 8 scholars from schools A and B was mostly below or at average levels, with a large percentage of the scholars falling under stanines 1 to 5. The performance of grade 10 scholars was better than that of the grade 8 scholars, with most scholars falling under stanine 5 and above. The latter trends remained similar for the grade 12 scholars. This pattern was expected since grade 8 scholars can be expected to perform poorer than their older counterparts who have more life experience (among other factors) and have gone though more years of school education, which includes the Life Orientation subject that covers a wide range of nutrition topics from primary school level up to grade 9(17).
To determine whether the difference in performance of scholars attending school C compared with schools A and B could be linked to race, black scholars from all three schools were grouped together and their performance assessed. The results depicted in Fig. 3(d) show that combining black scholars from the three grade levels and three schools resulted in a more ‘normal’ stanine distribution when compared with Fig. 1. A possible explanation for this finding could be that, like the white scholars in school C, the black scholars at school C have better knowledge than those attending the other two schools. This then moved the total curve to the right, resulting in a more normal distribution. This finding also supports the possibility that the scholars’ performance was influenced more by their socio-economic background than by race.
The fact that the results of the total norm group reflect a normal curve very similar to the ‘prototype’ depicted in Fig. 1, despite the apparent difference in socio-economic backgrounds and educational levels of the scholars, indicates that the norms are relevant for use among all urban South African adolescents.
Finally, to ensure optimal application of the norms in the assessment of the nutrition knowledge of urban adolescents using the questionnaire by Whati et al.(Reference Whati, Senekal, Steyn, Nel, Lombard and Norris4), cut-off points for levels of knowledge in percentage scores were identified and the nine stanine categories were reduced to five categories as suggested by Miller(Reference Miller13): very poor, fair/below average, good/average, very good/above average and excellent. These scores reflect the final norm-referenced performance-rating scale and are depicted in Table 2.
Norm-referenced performance-rating scale for the nutrition knowledge questionnaire developed by Whati et al.(Reference Whati, Senekal, Steyn, Nel, Lombard and Norris4)
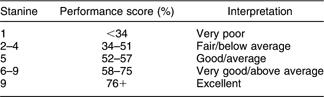
When using this scale it should be remembered that the scale compares the performance of an individual or group with that of urban South African adolescents in the Soweto–Johannesburg area. When using the questionnaire and norms among other adolescent groups, the applicability of the norm group used for the development of the norms should be considered.
Stage 2: assessing the validity of the norms
Methods
Study design and study population
As a measure of validity it was decided to administer the nutrition knowledge questionnaire to groups with known nutrition knowledge levels ranging from excellent to average and to determine the following: (i) whether rating of the nutrition knowledge of each group using the norms was in line with performance expectations based on their known knowledge levels; and (ii) whether the performance rating of the different knowledge groups differed significantly. If the groups performed according to expectations and the ratings differed significantly from each other, it would be a strong indication that the norms have discriminatory validity(Reference Sapp and Jensen18).
For the purpose of the validity assessment of these norms, the questionnaire was administered to fourth year university dietetics students, non-dietetics university students and primary-school teachers. The dietetic students were completing their final year of tertiary education with nutrition as a major subject and therefore they were expected to have excellent nutrition knowledge. They were regarded as the ‘expert nutrition group’. The non-dietetic male university students were expected to perform above average compared with their younger adolescent counterparts based on the assumption that these students were 3–8 years older than the adolescents and thus had more life experience. Primary-school teachers were also expected to have more nutrition knowledge than the adolescents because, like the non-dietetic students, they were older and may have been exposed to nutrition information during their life experience as well as in their capacity as educators.
Four universities offering dietetics training in South Africa were approached to participate in the study. The dietetics departments of the University of Stellenbosch (US), University of Natal (UN), University of Cape Town (UCT) and University of the Western Cape (UWC) gave consent for their students (n 60) to complete the questionnaire. Non-dietetics male students (n 19) residing in a university residence agreed to participate and completed the knowledge test. The males came from a variety of faculties and were enlisted if they were not in health and nutrition sciences. The primary-school teachers came from three randomly selected schools in the Cape Town metropolis. Their permission was requested and sixty-nine agreed to participate. Primary-school teachers require a teaching diploma to teach and few have university degrees. Informed written consent was obtained from all participants and the final study population included 148 subjects.
Ethical approval
This part of the study was also approved by the Ethics Committee of the University of The Witwatersrand. Volunteers were informed about the study and completion of the nutrition knowledge questionnaire denoted consent.
Data collection, processing and analyses
All participants completed the questionnaire under supervision and the data were processed as was described for the norm group using the SAS System for Windows version 8·2. The performance scores (in percentages) for each group were rated using the newly developed performance-rating scale (Table 2). The χ 2 test was used to test for significant differences between groups (P < 0·05).
Results and discussion of Stage 2
The stanine distributions of the Z-scores of the validation groups are presented in Fig. 4(a) to 4(d), with the norm group curve included for comparison purposes. All three validation groups performed as expected. The university dietetics students’ performance was ‘excellent’, with most students falling under stanine 9 and a few under stanine 8. The male university students performed from levels ‘at and above average’ up to ‘excellent’, thus definitely better than the adolescents but not as well as the dietetics students. Primary-school teachers achieved performances that ranged from a small percentage with ‘poor and below average performance’ but with most of them performing ‘at and above average’ up to ‘excellent’. The performance rating of the three validation groups also differed significantly, as shown in Table 3. These results clearly indicate that the norms have discriminatory validity because the validation groups performed as indicated when the norms were applied and the performance ratings of the three groups differed significantly.
Stanine distribution of the Z-scores of the validation groups: (a) norm group (n 512); (b) final-year university dietetics students (n 60); (c) university non-dietetics students (n 19); and (d) primary-school teachers (n 69)

Column percentages for performance ratings in stanines by validation groupFootnote *
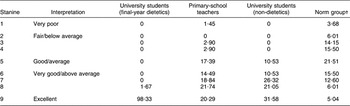
* χ 2 = 85·55, df = 8, P < 0·0001.
† Not included in the χ 2 analysis, presented for comparative purposes only.
Conclusion
The present article provides a simple and clear method for developing norms for knowledge tests. This methodology serves as a prototype for other researchers who are developing nutrition knowledge tests.
The nutrition knowledge test is available from the main author.
Acknowledgements
The study was undertaken with funding from the South African Medical Research Council and logistical support from the Birth to Twenty Study. There are no conflicts of interest. L.W. conducted the research for a Masters degree and wrote the manuscript. M.S. was her main supervisor and assisted with writing and data entry. N.P.S. was her co-supervisor and assisted with writing and data analysis. C.L. and J.N. were involved in data analysis and provided statistical advice. All authors read and approved the final version of the manuscript.



