


We would like to thank the editors of The American Political Science Review for inviting us to participate in this Forum by writing a response (or “rejoinder”) to the articles of Fowler and Dawes and of Deppe, Stoltenberg, Smith, and Hibbing. We view this as a welcome and important opportunity. Although we address both articles, our emphasis throughout is on the contribution of Fowler and Dawes, which itself is intended, in part, as a rejoinder to our earlier article in this journal, “Candidate Genes and Political Behavior” (Charney and English Reference Charney and English2012).
Our response is divided into two parts. Part I, “Statistics,” is an empirical critique of the specific gene-behavior association claimed by Fowler and Dawes and, in a much weaker version, by Deepe et al. Although our statistical critique addresses specific claims, as did our previous article, it also points to broader problems that likely affect all gene association studies in behavior genetics. Part II, “Genetics,” is a response to specific charges leveled by Fowler and Dawes against several of our assertions regarding genetics and the nature of the genotype-phenotype relation in regard to complex behavioral traits. It is also an extended explanation as to why the search for genes that can predict complex human behaviors (such as all political behavior) is a fundamentally misguided undertaking. To the reader accustomed to a cursory explanation of genetics in an initial paragraph followed by extended statistical analysis, Part II will doubtless seem unfamiliar and perhaps unwelcome. What is so much genetics doing in a political science journal? The answer is that genetics is not a subdiscipline of statistics, and to the extent that practitioners of “genopolitics” claim to advance the science of genetics, they must be held accountable to that very science.
STATISTICS
Population Stratification
Fowler and Dawes (FD) acknowledge that their previous, highly publicized finding that a polymorphism of the MAOA gene showed a “significant” direct association with (self-reported) voter turnout was incorrect, inasmuch as they failed to replicate it using new data from Wave IV of the National Longitudinal Study of Adolescent Health (Add Health) dataset. They give little consideration as to why their finding that “individuals with a polymorphism of the MAOA gene are significantly more likely to have voted in the 2004 presidential election” (Fowler and Dawes Reference Fowler and Dawes2008, 579) did not replicate, viewing it simply as a rare false positive.Footnote 1 Instead, they focus attention on the “second gene” from their initial assertion that “two genes predict voter turnout;” namely, that a polymorphism of the 5HTT gene, when interacted with (self-reported) frequency of church attendance,Footnote 2 predicts (self-reported) voter turnout. FD report that they confirmed this initial finding with Wave IV data and take this result as providing strong support for the larger project of genopolitics. However, on investigation, this result is likely false as well, driven by population stratification and omitted variable bias.
There are strong empirical and theoretical reasons to conclude that the association between voting and the interaction of “long” (L) 5HTTFootnote 3 with Church AttendanceFootnote 4 is a spurious correlation caused by population stratification. Population stratification (PS) occurs when there are systematic differences in allele frequencies in subpopulations due to genetic ancestry (Bouaziz, Ambrose, and Guedj, Reference Bouaziz, Ambroise and Guedj2011). In case control studies, PS can lead to spurious associations if differences in allele frequency between cases and controls are due to systematic differences in genetic ancestry rather than a causal genotype-phenotype relationship. Controlling for race/ethnicity or analyzing results by ethnic group is one small step researchers can take to try to mitigate the confounding effects of PS. However, as FD are aware, simply examining race is inadequate because it does not address intra-ethnic PS, something that has been shown to occur even in populations thought to be highly homogeneous, such as Icelanders (Helgason et al. Reference Helgason, Yngvadottir, Hrafnkelsson, Gulcher and Stefansson2005; Price et al. Reference Price, Helgason, Palsson and Stefansson2009).
One of the most commonly cited examples of a false association produced by PS is the link between the dopamine receptor gene DRD2 and alcoholism. Initial case control studies suggested a strong association, but subsequent investigations found none when more effective controls for PS were imposed (Gelernter, Goldman, and Risch Reference Gelernter, Goldman and Risch1993). In retrospect, it is clear why this initial result was vulnerable to confounding due to PS: DRD2 alleles vary widely by ethnic ancestry, and ethnic differences in alcoholism rates are pronounced (Thomas and Witte Reference Thomas and Witte2002). Early follow-up studies of DRD2 and alcoholism used two strategies to mitigate the confounding effects of PS: family-based designs and investigations restricted to ethnically homogeneous subpopulations. As FD note, family-based designs are expensive, and it is often difficult to gather sufficient data for them to be well powered (Add Health does not contain such data). Sampling ethnically homogeneous populations can be more feasible, but they are hard to isolate, particularly in a country such as the United States, and, as noted, PS can still occur within populations that appear racially homogeneous.
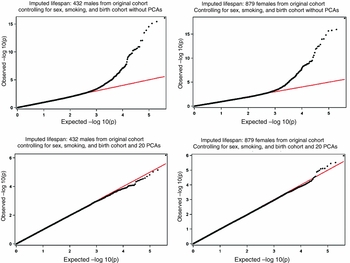
Genetic epidemiologists have long noted that “even small stratification can have considerable consequences for large samples” (Devlin, Bacanu, and Roeder Reference Devlin, Bacanu and Roeder2004, 1129). One of the benefits of genome-wide association studies (as contrasted to candidate gene studies) is that genome-wide data can be leveraged to help control for PS directly (Bouaziz, Ambrose, and Guedj Reference Bouaziz, Ambroise and Guedj2011). Currently, the most effective strategy for dealing with PS involves using a large range of single nucleotide polymorphisms (SNPs) contained in genome-wide data and employing techniques such as genomic control, structured association, and principal component analysis to correct for genetic “clusters” that are unevenly distributed across subjects (Price et al. Reference Price, Zaitlen, Reich and Patterson2010). In the absence of such analysis, the possibility that seemingly strong associations are in fact driven by PS can go undetected (Hao et al. Reference Hao, Chudin, Greenawalt and Schadt2010). For example, Figure 1, taken from a recent study of the genetics of aging, shows how SNPs that initially appeared highly correlated with longevity display no association once PS is controlled for using the first 20 principal components (Yashin Reference Yashin2011).
SNP's that initially appear highly correlated with longevity display no association once population stratification is controlled for
Reprinted with permission from Anatoliy Yashin, “Accumulation from Genetics of Exceptional Lifespan: Testing Mutation Hypothesis of Aging Using GWAS,” 2011.

That FD pay little attention to PS is puzzling given that (1) the behaviors they investigate—church attendance and voting—are known to vary widely by ethnic ancestry (Chatters et al. Reference Chatters, Taylor, Jackson and Lincoln2008; U.S. Census Bureau 2012) and (2) 5HTT allele frequencies, both “long” and “short,” exhibit significant inter-ethnic variation (Lotrich, Pollock, and Ferrell Reference Lotrich, Pollock and Ferrell2003; Noskova et al. Reference Noskova, Pivac, Nedic, Kazantseva and Seler2008). When we observe different levels of 5HTT alleles among self-reported voters and nonvoters who differ in their self-reports of church attendance, the presence of PS is the first explanatory hypothesis that should come to mind. Add Health contains data that can be leveraged to investigate the likely prevalence and effects of PS. Thus we first examined whether the (L)5HTT*Church Attendance association replicates in more ethnically homogeneous subpopulations and then tested for improbable associations in the Add Health data, associations that should exist only in the presence of PS.
The Add Health questionnaire asks respondents to identify their “family origins”/“family ancestries” from a list of countries, groups, and geographic areas. Respondents are allowed to identify up to four choices, but if more than one is chosen they are asked to indicate which best describes their family origins. There are significant limitations to this data: One-third of respondents (33.3%) indicate “America” as the country that best describes their family origins, and approximately 7% indicate “Africa.” Thus, more than 40% of respondents indicate ancestral origins that from the perspective of population genetics are particularly uninformative. However, we were able to examine the (L)5HTT*Church Attendance association within ethnically distinct groups among the remaining 60%.
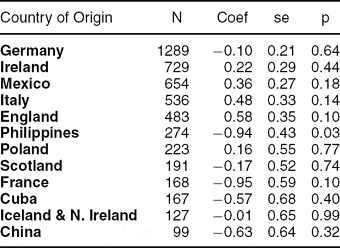
Table 1 shows the logit coefficients for (L)5HTT*Church Attendance associations within each of the 10 largest self-identified ethnic groups, using FD's mixed-effects model with standard controls for age, sex, and race. Although these samples are small and thus underpowered, the extraordinarily heterogeneous effects across ethnic groups suggest the likelihood of PS. More than half of the results show an association that trends in the opposite direction from FD's finding, including the largest ancestry group (Germany, N = 1,289). Moreover, the only result that is significant is negative (Philippines: −.94, p = .03). Although the self-identified primary country of family origin is a crude measure to use to control for PS, even with this crude approximation we found effects that vary widely across ethnic groups, providing initial evidence of PS.
(L)5HTT x Attend Association with Voter Turnout in 10 Largest Ancestry Groups

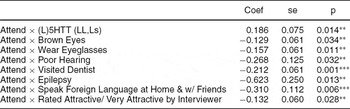
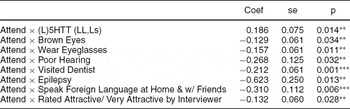
A second statistical strategy for investigating the likely influence of PS is to examine the effect of traits on voting that are likely stratified by ethnic ancestry but should have no relation to voting. If, when interacted with church attendance, these traits also predict voting in the same manner as (L)5HTT, this would provide strong additional evidence that the (L)5HTT*Church Attendance-voting association is an artifact of PS. In Table 2, we show that these associations are indeed widespread. In addition to (L)5HTT, the following traits each predicted voting when interacted with church attendance: having brown eyes, wearing glasses,Footnote 5 poor hearing,Footnote 6 having visited a dentist in the past year,Footnote 7 being diagnosed with epilepsy,Footnote 8 speaking a language other than English at home and with close friends, and being judged “attractive” or “very attractive” by the survey administrator.Footnote 9 We of course do not take this as a reason to advocate for new fields of “opto-politics,” “audio-politics,” “dental-politics,” “lingua-politics,” and “attractiveness-politics.” Nor do we think these associations represent progress in our understanding of voting. Rather, they are precisely the kinds of spurious associations one would expect in the presence of PS.
Traits that predict voting when interacted with religious attendance
We also investigated a converse phenomenon: whether (L)5HTT predicts voting when interacted with other social practices that are consistent with FD's theory, but are unlikely to be ethnically stratified in the same manner as church attendance. Recall that FD's underlying hypothesis is that (L)5HTT exercises an influence on voting, conditional on church attendance. FD (2008, 583) begin with the uncontroversial assumption that “religious groups build a sense of belonging to a larger community,” which explains why religiosity reliably predicts voter turnout. They then hypothesize that long alleles of 5HTT enhance (or short alleles suppress) the “pro-social” effect of religious practice, even though these alleles apparently exercise no direct effect on voting within the population at large.
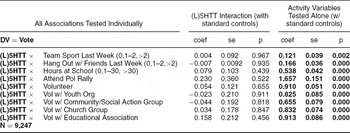
In addition to religion, this (L)5HTT “enhancing” effect should apply to other pro-social, community-building practices that are known to be associated with increased voter turnout. Add Health contains data on the following activities, which could each plausibly be construed as activities that foster community building and pro-social behavior: how often one played a team sport in the last week, how often one “hung out” with friends in the last week, how many hours a week were spent at school (which would encompass involvement in afterschool activities such as school clubs), whether one attended a political rally or march in the last year, and whether one volunteered or did community service in the last year and with which groups (we examined the four most frequently indicated groups: youth organizations such as the scouts, community centers/social action groups, church-related groups, and educational associations).
It is important to note what studies have already shown concerning the relationship between participation in such activities during high school and voting behavior. In describing the relationship between high school community service and voting, Hart et. al. (Reference Hart, Donnelly, Youniss and Atkins2007, 213) comment, “The most striking finding to emerge from our study is that high school community service predicted adult voting and volunteering, after controlling for other relevant predictors and demographic variables.” Lopez and Moore (Reference Lopez and Moore2006), using data from the National Youth Survey of Civic Engagement, report that high school students who engaged in extramural sports were 15% more likely to be registered to vote and 9.4% more likely to have voted in the presidential election in 2000. According to Frisco, Muller, and Dodson (Reference Frisco, Muller and Dodson2004, 673), “Participation in scouts, religious youth groups, non-school team sports, and 4-H positively predicts young adults’ voter-registration status, and scouting, religious youth group membership, and leadership positions in voluntary organizations are positively related to voting in a presidential election.”
As the columns of Table 3 under the heading “Activity Variables Tested Alone” show, each of these variables by itself is indeed associated with higher voter turnout. However, as the columns under the heading “(L)5HTT Interactions” show, none of these same variables predict voter turnout when interacted with (L)5HTT. This finding constitutes direct evidence against FD's larger theory. It also supports our larger claim concerning population stratification to the extent that these activities are unlikely to be stratified in the same way or to the same degree as religious attendance (which could mean either more or less stratified). This would explain why they exhibit no interactive effect with (L)5HTT, contrary to the empirical implications of FD's theory.
“Pro-social” behaviors that show a direct association with voting show no association when interacted with (L)5HTT.

Omitted Variable Bias
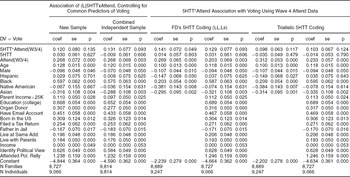
Although population stratification is likely the primary cause of the correlation between voting and the interaction of (L)5HTT with church attendance, FD's results also suffer from omitted variable bias. Political scientists have studied voting behavior for a long time and identified a host of factors that influence turnout. Chief among these are three factors that Deppe et al. include as controls in their experimental analysis: education (Nie, Junn, and Barry Reference Nie, Junn and Stehlik Barry1996), income (Brooks and Brady Reference Brooks and Brady1999), and partisanship (Bartels Reference Bartels2000). In addition, family background (de Vries, de Graf, and Eisinga Reference de Vries, de Graaf and Eisinga2009), residence history (McNulty, Dowling, and Ariotti Reference McNulty, Dowling and Ariotti2009), and altruism (Julio Reference Julio2009) have all been shown to influence voter turnout. Table 4, column 1, shows that when we include these additional factors as controls, using a number of variables available in the Add Health data, FD's result is no longer significant (coef = .12, p = .14; variable definitions are contained in the supplemental Online Appendix). The online appendix can be found at http://www.journals.cambridge.org/psr2013011.
5HTTxAttend Association with Voting Using Controls, Full Sample, Wave 4 Attend Data, and Alternate 5HTT Coding.

Note that the conditional effects of these control variables are all significant. As these controls are taken into account they displace the effects of (L)5HTT*Church Attendance. This finding holds when we expand the analysis to include the Wave I of Add Health data as well (coef = .13, p = .09), as shown in column 2 of Table 4. In examining this combined dataset, it is important to control for the high degree of family relatedness exhibited in the first sample. We followed the procedure we advocated in our original article: repeatedly sampling one individual from each family ID and averaging the distribution of effects over 500 samples. Incidentally, FD mischaracterize our approach and conduct only a single, random draw in their analysis, but this approach is indefensible given the large variance of effects revealed by repeated draws.
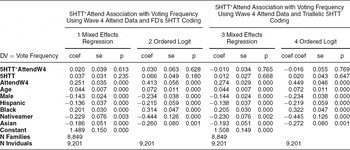
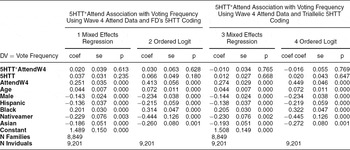
Finally, we wish to draw attention to a revealing fragility in the (L)5HTT*Church Attendance result that FD do not note. In response to concerns we raised about the definition of “voter turnout” (i.e., whether voting for the first time between ages 18–22 in the 2000 presidential election is a good indicator of whether one remains a “voter”), FD examine a variable from Wave IV of Add Health that asks respondents to indicate how often they usually vote in local or statewide elections. They show that this measure of voter turnout continues to be (weakly) associated with (L)5HTT*Church Attendance. However, they neglect to mention that Wave IV of Add Health also (again) asks participants how often they attend church services. Using this second measure of church attendance, we found that FD's results are tenuous, to say the least. Table 5 shows that when (L)5HTT is interacted with this new measure of church attendance it is not remotely correlated with voting frequency, regardless of whether one uses FD's coding or the more biologically realistic triallelic coding (coef = ~.02, p = ~.61 in the former case, and coef = ~.01, p = ~.77 in the latter; ordered logit models yield the same substantial results). Finally, columns 3–6 of Table 4 show that when we interact (L)5HTT with Wave IV church attendance data to examine the association with voting, the results are not particularly impressive (coef = .13, p = .09 with FD's coding and controls, and coef = .1, p = .12 with triallelic coding and controls).
5HTTxAttend Association with Vote Frequency Using Wave 4 Attend Data and Alternate 5HTT Coding.
Deppe, Stoltenberg, Smith, and Hibbing's Findings
As Deppe et al. note, they are unable to replicate FD's finding of an effect of 5HTT* Church Attendance on voting behavior. The only effect Deppe et al. do find comes from using FD's original 5HTT coding and a general measure of political participation that they have constructed based on subject responses to six questions concerning political participation. As they note, the association they find is tenuous and decreases in significance when they discard the small number of nonwhite study participants. Nor are they able to discern an effect on either voting behavior (using measures of validated voting) or political participation when using what is believed to be the most biologically sound categorization of long 5HTT (triallelic coding):
With this triallelic genotype classification, the most accurate according to the latest research, 5-HTT genotype continues to exhibit no statistically significant relationship with self-reported political participation. When we ran this same model with voting frequency as the dependent variable the relationship even gave some indication of going in the opposite direction from that hypothesized by Fowler and Dawes though the coefficient was not significant (13). (emphasis added)
Thus Deppe et al.'s experimental evidence does not confirm FD's voter turnout thesis, and one wonders how many specifications of “political participation” were explored before arriving at the one that shows a weak association with FD's original coding (presumably, if any of the six components used to construct the participation measure showed an individual association with (L)5HTT*Church Attendance, that would have been reported as well). Given that genetic stratification can still be a significant problem within racially homogeneous groups (particularly “Caucasians” at large), it is reasonable to think that population stratification is driving the weak association they do find (Price et al. Reference Price, Helgason, Palsson and Stefansson2009). Overall, we view Deppe et al.'s results as constituting more of a challenge to than a confirmation of FD's thesis.
GENETICS
Responses to a Few Objections
FD note that 40 polymorphisms have been reliably associated with type 1 diabetes (T1D) and 50 with type 2 (T2D). This is true. However, in the case of T2D, for example, it is estimated that the existing 50 genetic markers only explain 15% of the heritability of the disease, and in neither T1D nor T2D do the associated markers have any predictive (i.e., diagnostic) value: Only a small proportion of those who are considered genetically susceptible ever develop the disease, indicating the critical importance of environmental factors (Knip et al. Reference Knip, Veijola, Virtanen, Hyoty, Vaarala and Akerblom2012). This example supports rather than challenges our point. If such is the level of complexity for a well-defined disease such as diabetes, are we to believe that a single polymorphism predicts voting, a process that involves all of the faculties of the human brain (consciousness, thinking, reasoning, memory, planning, emotion, etc.) interacting with a particular environment? Moreover, whether polymorphisms will ever be discovered that can predict the onset of T1D or T2D has little to do with the question whether a single polymorphism can predict a complex behavior such as voting. We invoked the example of diseases such as T1D simply to illustrate how hard it is to identify risk-factor polymorphisms in cases where the existence of such genes makes genetic and biological sense in the first place (for more on this point, see the later discussion).
In defending the possibility that the same polymorphisms of the same four genes could predict hundreds of widely divergent behavioral and nonbehavioral phenotypes, FD invoke pleiotropy, the phenomenon in which the same proteins transcribed from the same genes are involved in many different physiological processes. There is abundant evidence for the existence of widespread pleiotropy. FD, however, conflate the notion of pleiotropy with that of an endophenotype. Unlike pleiotropy, there is no scientific evidence for the existence of something called an “endophenotype.” We strongly encourage readers to look at an expanded table of claimed associations for the same polymorphic regions of the same four genes (MAOA, 5HTT, DRD2, DRD4)Footnote 10 and consider whether proposing “several endophenotypes” is a convincing explanation.
Concerning the hundreds of associations reported between the same polymorphic regions of the same four genes and every imaginable behavior (as well as nonbehavioral phenotypes), FD comment that “many of the phenotypes listed by CE have not been replicated, so it may be premature to ask what such different phenotypes have in common with one another.” In fact, as we noted (Charney and English Reference Charney and English2012, 11), the most well-known associations on this list—that between MAOA and “antisocial” personality and between 5HTT and depression—which are typically referenced as scientific facts, have failed to be replicated as many times as they have been replicated. One wonders then, if such associations can ever be proven wrong; that is, are they falsifiable and hence, truly scientific claims? (Popper Reference Popper2002). And why has the canonical test of scientific validity—consistent replication—been suspended in these cases?
FD insist that they “clearly acknowledge that there are multiple genetic and environmental causal factors that underlie turnout” by quoting their 2008 article (Fowler and Dawes Reference Fowler and Dawes2008, 590): “[T]here is some (likely large) set of genes whose expression, in combination with environmental factors, influences political participation.” Indeed, a recent study identified up- and downregulation of more than 4,038 genes in differences in aggression in fruit flies (Zwarts et al. Reference Zwarts, Magwire, Carbone, Versteven, Herteleer, Anholt, Callaerts and Mackay2011). It is not sufficient, however, to pay lip service to the existence of such extreme polygenicity and environmental interaction and then defend the plausibility of results—that a single polymorphism can predict a behavior such as voter turnout—that directly contradict those same principles.
Transcribability, Transcription, and Translation
FD assume that, on the basis of our claim that the presence of a particular polymorphism alone cannot tell us its epigenetic state, we infer that “the gene plays no role in influencing behavior,” which “demonstrates a profound misunderstanding of scientific inference.” We nowhere make any such inference: Mutations on, for example, the NOTCH3 gene result in cognitive defects and dementia. Hence, a gene can play a role in influencing a particular behavior.
FD exhibit a lack of awareness of the differences between (1) the extent to which a gene can be transcribed (its accessibility to transcription factors), (2) gene transcription, and (3) gene translation. This is apparent throughout their comments and is made explicit in their assertion that our claim that genes do not regulate the extent to which they can be transcribed is “directly contradicted by evidence from more than 5,000 genes that shows transcription explains nearly 40% of the variation in levels of expression in mammals.” In the supporting study that FD cite (Schwanhäusser et al. Reference Schwanhäusser, Busse, Li, Dittmar, Schuchhardt, Wolf, Chen and Selbach2011), the authors report their findings on the relation between gene transcription, gene translation, and the levels of protein synthesized in a cell.
Transcription is a process in which a segment of DNA is copied (by the cellular machinery) to produce messenger RNA (mRNA), which is then used to construct a particular protein in a process known as translation. Before transcription can occur, however, the segment of DNA to be transcribed must be accessible to special proteins called transcription factors. This accessibility is regulated not by the gene itself but by the epigenome, the name given to a variety of complex biochemical processes that can block or facilitate the access of a segment of DNA to transcription factors (Allis, Jenuwein, and Reinberg Reference Allis, Jenuwein and Reinberg2007).
The measure used by Schwanhäusser et al. (Reference Schwanhäusser, Busse, Li, Dittmar, Schuchhardt, Wolf, Chen and Selbach2011) of the relationship between the efficiency of transcription (as measured by levels of mRNA) and intracellular protein levels applies when transcription is actually occurring. If a gene is inaccessible to transcription factors, then transcription cannot occur, no matter what the relationship between transcriptional efficiency and cellular protein levels is when the gene is being transcribed. Transcriptional efficiency has no bearing on epigenetic regulation of whether or not a gene can be transcribed in the first place. Let us make this perfectly clear: The same 5HTT gene that produces serotonin transporter in neurons is also present in eye and heart and hair cells. We cannot predict the levels of serotonin transporter in hair cells on the basis of a person's 5HTT genotype because, in hair cells, the 5HTT gene is not transcribed at all. It is permanently epigenetically silenced, something that the presence of the 5HTT gene alone cannot tell us (Bird Reference Bird2007; Khavari, Sen, and Rinn Reference Khavari, Sen and Rinn2010). Thus, to repeat what we said previously, genes do not regulate the extent to which they are capable of being transcribed in any obvious, unidirectional manner.
Significantly, the takeaway conclusion of the study of Schwanhäusser et al. (Reference Schwanhäusser, Busse, Li, Dittmar, Schuchhardt, Wolf, Chen and Selbach2011) that FD cite concerns not transcription but translation, and the authors’ conclusion challenges the very claim that FD invoke this study to defend. What Schwanhäusser et al. (Reference Schwanhäusser, Busse, Li, Dittmar, Schuchhardt, Wolf, Chen and Selbach2011, 337, 341) highlight as the central finding of their study is that translational efficiency is a far better indicator of protein synthesis than transcriptional efficiency and is the key determinant of intracellular protein levels:
We find that cellular abundance of proteins is primarily at the level of translation. . . . Hence, protein abundance seems to be predominantly regulated at the ribosome [structures in a cell where messenger RNAs are translated to construct proteins], highlighting the importance of translational control. . . . We found that in mouse fibroblasts, translation efficiency is the single best predictor of protein levels. (emphasis added)
As one of the authors notes in another article, “The ribosomes [ = translation] ultimately determine protein abundance. Some mRNAs are translated into only one protein per hour, others are translated 200 times” (emphasis in original; “From Gene to Protein” 2011).
It is thus critical to be aware of the following basic principle of genetics: Gene accessibility to transcription factors, gene transcription, and gene translation are three distinct processes in the pathway leading to the synthesis of a protein, each subject to its own complex regulatory system.
Shifting Paradigms and Overturned Dogmas
FD respond to our reference to retrotransposons (“jumping genes”) that alter both DNA sequence and quantity by stating that our description is “highly misleading” and “extremely disingenuous” because “all but a few dozen of the 3 billion base pairs in an individual's DNA will be exactly the same throughout their reproductive lifetimes. Thus, by and large the genes you are born with are the genes you will die with” (reference omitted).
Retrotransposons are part of what we, following a number of prominent geneticists and neuroscientists, referred to as a “paradigm shift” in genetics:
Today, 50 years after these events took place [after the discovery of transposable elements], nobody would deny that genomes contain a wealth of DNA sequences able to move, usually referred to as transposition, from one genome site to another, using different mechanisms. But this consensus was difficult to reach because it represented a paradigm shift in theories of genome stability and control. Transposable elements are now incorporated into the contemporary concept of the genome as an entity with unsuspected dynamism and fluidity of far reaching evolutionary consequences (Fontdevila Reference Fontdevila2011, p. 81).
Novel classes of small and long noncoding RNAs (ncRNAs) are being characterized at a rapid pace, driven by recent paradigm shifts in our understanding of genomic architecture, regulation, and transcriptional output, as well as by innovations in sequencing technologies and computational and systems biology. These ncRNAs can interact with DNA, RNA, and protein molecules; engage in diverse structural, functional, and regulatory activities; and play roles in nuclear organization and transcriptional, post-transcriptional, and epigenetic processes. This expanding inventory of ncRNAs is implicated in mediating a broad spectrum of processes including brain evolution, development, synaptic plasticity, and disease pathogenesis (Qureshi and Mehler Reference Qureshi and Mehler2012, 528).
Epigenetics provides an additional molecular mechanism to complement genetics in the regulation of development. Therefore, the paradigm shift is that layers of molecular control and cascades of both epigenetic and genetic factors or processes are involved in regulating developmental biology (Skinner Reference Skinner2011, 52)
However, FD dismiss the idea of a paradigm shift: “Thus the “paradigm” is not at issue – it is the methodology that proves challenging.” Apparently, the paradigm does not change (hence, discoveries in molecular genetics over the past 50 years can be ignored), and the real challenge lies in the methodology (i.e., statistical analysis). Because of the significance of retrotransposons in this paradigm shift, we consider them here at length, together with another source of DNA variability. We also explain the basic difference between somatic and germline DNA mutability, a distinction FD are apparently unaware of, and its relevance in this context.
Active (or “transpositionally competent”) retrotransposons are segments of DNA that move about the genome by a “copy and paste” mechanism. They first copy themselves to RNA, and the original DNA copy is maintained at the same location. The RNA copy is then “reverse-transcribed” into DNA, and the DNA is inserted into the genome at a new location (Sciamanna et al. Reference Sciamanna, Vitullo, Curatolo and Spadafora2009). Hence, these elements expand in number as they retrotranspose, leading to an increase in genomic DNA content and a change in DNA sequence and structure at the region of insertion (Faulkner Reference Faulkner2011). For the most part, the activity of retrotransposons is epigenetically silenced due to potentially deleterious effects, but there are two critical exceptions: First, for a period during early embryogenesis, retrotransposons are released from epigenetic suppression and become active (Coufal et al. Reference Coufal, Gage, Garcia-Perez, Lovci, Moran, Morell, Mu, Shea, Peng and Yeo2009) and may influence the manner in which neural precursor cells differentiate to form distinct types of neurons in the embryo (Vitullo et al. Reference Vitullo, Sciamanna, Baiocchi, Sinibaldi-Vallebona and Spadafora2012); second, retrotransposition is ongoing in those parts of the brain (the hippocampus and the subventricular zone) that produce new neurons throughout life (Muotri et al. Reference Muotri, Marchetto, Coufal, Oefner, Yeo, Nakashima and Gage2010).
Applying high-throughput sequencing techniques to study retrotransposition in human brain tissue, Baillie et al. (Reference Baillie, Barnett, Upton, Gerhardt, Richmond, De Sapio and Brennan2011) identified ~25,000 retrotransposon insertions in the hippocampus and caudate nucleus of healthy individuals. A number of key genomic loci were found to contain these insertions, including dopamine receptors and serotonin neurotransmitter transporters. They also identified a disproportionate number of intronic retrotransposon insertions, which is noteworthy because introns are the protein-coding loci of DNA; they also determined that genes containing intronic insertions were twice as likely to be differentially overexpressed (i.e., overtranscribed) in the brain. What is entailed by ongoing retrotransposition in the brain is summed up by the title of the study of Baillie et al. (Reference Baillie, Barnett, Upton, Gerhardt, Richmond, De Sapio and Brennan2011): “Somatic retrotransposition alters the genetic landscape of the human brain” (for more on retrotransposons and alteration to neuronal DNA, see, e.g., Coufal et al. Reference Coufal, Gage, Garcia-Perez, Lovci, Moran, Morell, Mu, Shea, Peng and Yeo2009; Faulkner Reference Faulkner2011; Fontdevila Reference Fontdevila2011; Muotri et al. Reference Muotri, Marchetto, Coufal, Oefner, Yeo, Nakashima and Gage2010; Sciammana et al. Reference Sciamanna, Vitullo, Curatolo and Spadafora2009; Singer et al. Reference Singer, McConnell, Marchetto, Coufal and Gage2010; Vitullo et al. Reference Vitullo, Sciamanna, Baiocchi, Sinibaldi-Vallebona and Spadafora2012). Given that each retrotransposition event that occurs in a cell results both in an increase in DNA and a change in the DNA sequence, the discovery of different numbers of retrotransposition insertions in different neurons indicates neuronal somatic mosaicism, the existence in the same individual of two or more distinct genomes: “[G]enome mosaicism driven by retrotransposition may reshape the genetic circuitry that underpins normal and abnormal neurobiological processes” (Baillie et al. Reference Baillie, Barnett, Upton, Gerhardt, Richmond, De Sapio and Brennan2011, 534).
These changes to DNA are somatic; that is, they are changes to DNA that occur postconception in the embryo and can affect all the cells of the body except germ cells (i.e., egg and sperm—the “germline”). As such, these changes are not transmitted to offspring, in contrast to changes in germline DNA (Notini, Craig, and White Reference Notini, Craig and White2008). Over the past 20 years, researchers have come to appreciate both the extent and the importance of somatic DNA mutability for human phenotypes (De Reference De2011).
Retrotransposition is only one source of postconception DNA variability. Another source is aneuploidy, the presence of greater or fewer than two chromosomes—and hence two alleles of each gene—per cell. Recent conservative estimates place the overall percentage of aneuploid neural cells—cells that vary from the usual two chromosomes per cell—in the normal human brain at an astonishing 10%, involving monosomy (one chromosome), trisomy (three chromosomes), tetrasomy (four chromosomes), polyploidy (>four chromosomes), and uniparental disomy (two copies of a chromosome from one parent; Rehen Reference Rehen2005). Given ~100 billion neurons in the adult brain, this yields a rough conservative estimate of 10 billion aneuploid neurons. This chromosomal diversity appears to result from a high frequency of stochastic errors in cellular division during embryogenesis, and various lines of evidence indicate that brain tissues may be more prone to aneuploidy than other tissues (Iourov, Vorsanova, and Yurov Reference Iourov, Vorsanova and Yurov2006). Mature aneuploid neurons are functionally active and integrated into brain circuitry, showing distant axonal connections (Kingsbury Reference Kingsbury2005). One likely result of this integration is neuronal signaling differences caused by altered gene expression, as documented in mammalian neural cells (Kaushal et al. Reference Kaushal, Contos, Treuner, Yang, Kingsbury, Rehen and McConnell2003). Thus, a network composed of intermixed diploid and aneuploid neurons might produce unique signaling properties distinct from a network composed purely of diploid cells (Westra et al. Reference Westra, Rivera, Bushman, Yung, Peterson, Barral and Chun2010).
Therefore, the assertion that “all but a few dozen of the 3 billion base pairs in an individual's DNA will be exactly the same throughout their reproductive lifetimes” is simply wrong. Pervasive changes to a person's genome beginning with conception and continuing throughout life pose a significant challenge to any methodology that rests on the assumption that the genome is the unchanging, static template of heredity, identical in all the cells and tissues of the body. We cannot assume that any two individuals have two copies of, say, 5HTT alleles in all their neurons or that these copies do not exhibit transcriptional differences due to the activity of retrotransposons or to environmental reprogramming of the epigenome (see the later discussion). Moreover, although we characterized both retrotransposition and aneuploidy as postconception somatic occurrences, both retrotransposons (Sciamanna et al. Reference Sciamanna, Vitullo, Curatolo and Spadafora2009) and aneuploidy (Delhanty Reference Delhanty2011) can be inherited via the germline as well. Ongoing germline retrotransposition is now believed to have played a key role in human evolution (Iskow et al. Reference Iskow, McCabe, Mills, Torene, Pittard, Neuwald, Van Meir, Vertino and Devine2010).
Another reason we cannot assume that there are only two copies of an allele per cell in any given individual (and any given cell) is the ubiquitousness of copy number variations (CNVs)— stretches of DNA at least 1,000 base pairs (1 kilobase) long and extending up to several million base pairs—that are either deleted or are present in multiple copies relative to a model normal genome (Dear Reference Dear2009). A first-generation CNV map of the human genome showed that at least 2,900 genes, or 10% of the total number of genes in the human genome, contain or are encompassed by CNVs (Redon et al. Reference Redon, Ishikawa, Fitch, Feuk, Perry and Andrews2006). The average size of the CNVs was 250,000 base pairs. Since the average gene is 27,000–60,000 base pairs long, many of the CNVs were composed of multiple copies (or deletions) of entire genes, in some cases exceeding 12 copies of a single gene. Furthermore, as do retrotransposons and aneuploidy, CNVs contribute to somatic mosaicism (i.e., different CNVs have been found in different cells and tissues of the same individual). As Singer et al. (Reference Singer, McConnell, Marchetto, Coufal and Gage2010, 345) note, “Neuronal genetic diversity results from aneuploidy (whole chromosome gains and losses) genomic copy number variations (CNVs) and actively ‘jumping’ transposable elements” (references omitted).
Neuroscience: Plasticity, Criticality, and Adaptation
Whole-genome expression profiling has identified differences in the transcription levels of more than 4,038 genes in hyperaggressive fruit flies (Drosophila melanogaster) versus controls (Zwarts et al. Reference Zwarts, Magwire, Carbone, Versteven, Herteleer, Anholt, Callaerts and Mackay2011). For all of the up and down transcription levels in thousands of genes, the heritability of Drosophila aggression is estimated to be only 10%, even though the researchers thought they had raised all the flies in identical laboratory conditions (Edwards et al. Reference Edwards, Rollmann, Morgan and Mackay2006). Why were the heritability estimates so low compared to estimates of 69% for the heritability of aggression in humans (van den Oord et al. Reference van den Oord, Verhulst and Boomsma1996), 50% for the heritability of political ideology (Alford, Funk, and Hibbing Reference Alford, Funk and Hibbing2005), and 65% for the heritability of being a born-again Christian (Bradshaw and Ellison Reference Bradshaw and Ellison2008)? First, because they were accurate, involving genetic and environmental manipulation, continual monitoring, and whole-brain analysis of healthy samples—conditions obviously impossible in any human study. Second, aggression is a highly adaptive behavior.
Phenotypic plasticity is the ability of an organism to change phenotype in response to its environment (Pigliucci, Murren, and Schlichting Reference Pigliucci, Murren and Schlichting2006). It includes the possibility of modifying developmental trajectories in response to specific environmental cues and the ability to change phenotypic state or activity in response to variations in environmental conditions (both pre- and postnatal). Modern evolutionary biology reflects the idea that adaptation is not limited to the process of natural selection (i.e., adaptation at the level of the species), but also includes adaptation of the individual organism to its ecological niche (West-Eberhard Reference West-Eberhard2003). Offspring do not inherit simply genes (and messenger RNA, noncoding RNA, epigenomes, mitochondria, mitochondrial DNA, and nucleoli) from their parents but an environment as well. Behavioral developmental plasticity evolved because it is adaptive, promoting Darwinian fitness by enhancing survival and reproductive success through the use of environmental cues to optimize the life-course (Garland and Kelly Reference Garland, Jr and Kelly2006). Numerous animal studies have shown that one of the ways in which the perinatal environment can shape behavioral phenotypic outcomes (e.g., stress responses, aggression, mating behavior) to meet the demands of the postnatal environment is via environmental reprogramming of the epigenome, resulting in long-term changes in gene transcribability (Champagne Reference Champagne2010; Fagiolini, Jensen, and Champagne Reference Fagiolini, Jensen and Champagne2009; Mychasiuk et al. Reference Mychasiuk, Zahir, Schmold, Ilnytskyy, Kovalchuk and Gibb2012; Zhang and Meaney Reference Zhang and Meaney2010).
Absurdly high estimates of heritability of behavior (of the kind typically obtained by classical twin studies) are incompatible with phenotypic plasticity. Were we to take an estimate of, say, 69% heritability of aggression in humans seriously (versus 10% in Drosophila), then we would have to conclude that, even though humans possess the most plastic, responsive, adaptive organ we know of in the natural world (the human brain), they are less developmentally influenced by and responsive to their environment than flies. Lacking the ability to adapt to their environments to such an extent, homo sapiens would long ago have become extinct.Footnote 11
Plasticity is built into the neurodynamics of the human brain. There is a good deal of hard scientific evidence from cutting-edge research in neurobiology that macroscopic behaviors (cognitive, emotional, motor, etc.) are emergent phenomena of an underlying neuronal collective characterized by self-organized criticality (Chialvo Reference Chialvo2010; Droste, Do, and Gross Reference Droste, Do and Gross2013; Proekt et al. Reference Proekt, Banavar, Maritan and Pfaff2012). Emergence refers to the unexpected collective spatiotemporal patterns exhibited by large, complex systems, where “unexpected” indicates our inability (mathematical and otherwise) to derive such emergent patterns from the equations describing the dynamics of the individual parts of the system. Complex systems (such as the brain) are usually large conglomerates of interacting elements, each one exhibiting some sort of nonlinear dynamics (Chialvo Reference Chialvo2010). The essence of self-organization is that a system structure (at least in part) appears without explicit pressure or constraints from outside the system. Criticality is a mathematically defined complex state at the border between predictable period behavior and unpredictable chaos. In fMRI experiments, it has been demonstrated that functional neuronal networks exhibit scale invariance,Footnote 12 a feature of criticality (Eguíluz et al. Reference Eguíluz, Chialvo, Cecchi, Baliki and Apkarian2005; He et al. Reference He, Zempel, Snyder and Raichle2010; Plenz Reference Plenz2012). In the context of the dynamics of the brain, the implication of self-organized criticality is that the cerebral cortex displays perpetual state transitions, dynamics that favor reacting to inputs quickly and flexibly (Shew and Plenz Reference Shew and Plenz2012). Why should our brains evolve to be near a critical point? “The answer, in short, is that brains should be critical because the world in which they must survive is to some degree critical as well” (Chialvo Reference Chialvo2010, 747).
If complex behaviors associated with the healthy brain are emergent phenomena of an underlying neuronal collective, then they are not the sort of thing that can be predicted by 1 gene or 10,000 genes. When it comes to such behaviors, genes are the wrong level of analysis. Assuming that we can predict complex behaviors from genes alone (and skip everything between the gene and the appearance of the behavior) is akin to assuming that we can predict the tides solely by studying the molecular structure of water molecules. Note that the claim here is not that “genes do not affect behavior” any more than the claim that we cannot predict the tides by the structure of water molecules is a claim that the atomic structure of water is irrelevant for the behavior of the tides.
To all of this it might be objected that “gene knock-out” studies—studies in which animals are engineered to lack a particular gene—prove us wrong, inasmuch as they tie particular genes to particular (complex) behaviors. MAOA knock-out mice exhibit heightened aggression (as well as a host of other abnormal behaviors). Does this not prove that MAOA is the “warrior gene” (McDermott et al. Reference McDermott, Tingley, Cowden, Frazzetto and Johnson2009)? It proves no such thing. Angelman syndrome is a neurological disorder caused by the lack of a functioning UBEA3 gene that codes for an enzyme involved in the intracellular degradation of proteins (Clayton-Smith and Laan Reference Clayton-Smith and Laan2003). Hence, those who have the disorder are UBEA3 “knock-outs.” Angelman syndrome is characterized by intellectual disability, severe speech impairment, and a generally happy demeanor with frequent outbursts of laughter, but no one has concluded on this basis that UBEA3 is the “happiness” or “laughter” gene. Although gene knock-out studies are a valuable research tool, they are apt to deceive because they in effect result in an artificial monogenic (i.e.,“single gene”) disorder. Voting—and all other complex human behavior—is not a monogenic disorder, or an oligogenic disorder, or a complex polygenic disorder. Normal human behavior is not a cluster of disorders, nor is it a cluster of distinct “behaviors,” each behavior predicted by a gene or set of genes. Rather, behavior is the integrated output of an integrated biological system interacting with a particular environment.
CONCLUSION
Genopolitics is an exercise in naïve statistics. Genetics, however, is not a subfield of statistics. Genopolitics relies on a naïve conception of the genome uninformed by some basic principles of genetics and by discoveries in molecular genetics over the past 50 years. Although such a genome may be ideally suited for discovery via simple regression analysis, it does not exist. The spectacular advances in our understanding of the genome over the last several decades pose a direct challenge to the simplistic model of the genome and the genotype-phenotype relationship on which genopolitics relies: The genome is not the unchanging template of heredity, fixed for life at the moment that the maternal and paternal chromosomes fuse in the fertilized egg cell and identical in all the cells and tissues of the body; it is not the sole biological component of inheritance; and it is not a “self-activating,” “self-determining” “agent” of either protein production or phenotype creation.
Genopolitics relies on a conception of the human brain that complements its conception of the genome. For all the lip service paid to complexity, the “genopolitical brain” more resembles a mechanical toy whose behavior is determined by the 25,000 little wind-up toys (i.e., genes) of which it is composed than a neuronal collective whose behavior is characterized by emergent self-organized criticality to enable rapid and flexible responses to the demands of a variable environment. Given that such a mechanical brain would have broken down long ago in evolutionary history, we can be thankful that it has no more reality than its mechanical genome.




Comments
No Comments have been published for this article.