1 Introduction
All porous media, whether random or ordered, granular or networked, heterogeneous or homogeneous, are typified by the geometric and topological complexity of the pore space (Vogel Reference Vogel, Mecke and Stoyan2002; Scholz et al.
Reference Scholz, Wirner, Götz, Rüde, Schröder-Turk, Mecke and Bechinger2012). This pore space plays host to a wide range of fluid-borne processes including transport, mixing and dispersion, chemical reaction and microbiological activity, all of which are influenced by the flow structure and transport properties (Dentz et al.
Reference Dentz, Leborgne, Englert and Bijeljic2011; de Barros et al.
Reference de Barros, Dentz, Koch and Nowak2012; Chiogna et al.
Reference Chiogna, Hochstetler, Bellin, Kitanidis and Rolle2012; Metcalfe et al.
Reference Metcalfe, Speetjens, Lester, Clercx, van der Giessen and Aref2012). While the global distribution of a concentration plume over the porous network is important, local fluid mixing at the pore scale also plays a key role in the control of both fluid–fluid reactions (e.g. redox processes) and fluid–solid reactions (e.g. precipitation–dissolution processes), which are of importance for a range of subsurface operations, including CO
 $_{2}$
sequestration, contaminant remediation and geothermal dipole management. Although pore-scale flows are often smooth and steady (typically Stokesian or laminar), the complexity of the pore space renders upscaling of transport and mixing processes a challenging task.
Because of their fundamental role in driving chemical reactions, mixing processes have received increasing attention in recent years in the context of porous media flows (Dentz et al. Reference Dentz, Leborgne, Englert and Bijeljic2011). Two-dimensional (2D) laboratory experiments (Gramling, Harvey & Meigs Reference Gramling, Harvey and Meigs2002; Tartakovsky et al. Reference Tartakovsky, Redden, Lichtner, Scheibe and Meakin2008a ; de Anna et al. Reference de Anna, Jimenez-Martinez, Tabuteau, Turuban, Le Borgne, Derrien and Méheust2014) and theoretical and modelling studies (Battiato et al. Reference Battiato, Tartakovsky, Tartakovsky and Scheibe2009) have shown that the upscaled chemical kinetics are not captured by classical macrodispersion theories due to incomplete mixing at the pore scale. The works by Tartakovsky, Tartakovsky & Meakin (Reference Tartakovsky, Tartakovsky and Meakin2008b ), Tartakovsky et al. (Reference Tartakovsky, Tartakovsky, Scheibe and Meakin2008c ), Battiato et al. (Reference Battiato, Tartakovsky, Tartakovsky and Scheibe2009) and Tartakovsky, Tartakovsky & Scheibe (Reference Tartakovsky, Tartakovsky and Scheibe2009) discuss the relevance of local pore-scale transport and mixing processes for global Darcy scale representations of reactive transport, and advocate the use of hybrid models that facilitate the communication between pore and Darcy scale. This points to a need for predictive theories for pore-scale concentration statistics which are couched in terms of the underlying medium properties. Lamellar mixing theories, developed in the context of turbulent flows (Villermaux & Duplat Reference Villermaux and Duplat2003; Duplat & Villermaux Reference Duplat and Villermaux2008; Duplat, Innocenti & Villermaux Reference Duplat, Innocenti and Villermaux2010), have been applied and extended for the prediction of concentration statistics in 2D Darcy-scale heterogeneous porous media (Le Borgne, Dentz & Villermaux Reference Le Borgne, Dentz and Villermaux2013, Reference Le Borgne, Dentz and Villermaux2015). A central element of this theory is to quantify the link between fluid stretching and mixing. In this context, linking the pore network topological properties to the local pore-scale mixing dynamics is an essential step, which we explore in this study.
One implication of the Poincaré–Bendixson theorem is that chaotic dynamics are not permitted in systems with fewer than three degrees of freedom (i.e. 2D unsteady or three-dimensional (3D) steady flow), and so fluid trajectories on a 2D bounded plane must be non-chaotic. An important consequence of this constraint is that exponential fluid stretching cannot persist in bounded planar steady 2D flows and the only persistent fluid deformation is via shear. This constraint is clearly uncovered by transforming the velocity gradient in such flows into streamline coordinates (Dentz et al. Reference Dentz, Le Borgne, Lester and de Barros2015). Hence, fluid stretching in steady 2D flows can only scale algebraically in time, whereas in 3D steady flows much richer behaviour is possible.
Indeed, the topological complexity inherent to all 3D porous media has been shown to induce chaotic advection under steady flow conditions via a 3D fluid mechanical analogue of the baker’s map (Lester, Metcalfe & Trefry Reference Lester, Metcalfe and Trefry2013). Such chaotic Lagrangian dynamics are well known to rapidly accelerate diffusive mixing and scalar dissipation (Ottino Reference Ottino1989), yet have received little attention in the context of pore-scale flow. From the perspective of advective transport, the distributions of pore sizes and shapes, together with no-slip boundary conditions at the pore walls, are known to impart non-Gaussian pore velocity distributions (Moroni & Cushman Reference Moroni and Cushman2001; Bijeljic, Mostaghimi & Blunt Reference Bijeljic, Mostaghimi and Blunt2011; Kang et al. Reference Kang, de Anna, Nunes, Bijeljic, Blunt and Juanes2014; Holzner et al. Reference Holzner, Morales, Willmann and Dentz2015), which lead to a rich array of dispersion phenomena ranging from normal to super-diffusive. The continuous time random walk (CTRW) approach (Berkowitz et al. Reference Berkowitz, Cortis, Dentz and Scher2006) has been used to model this behaviour (Bijeljic, Muggeridge & Blunt Reference Bijeljic, Muggeridge and Blunt2003; Le Borgne et al. Reference Le Borgne, Bolster, Dentz, de Anna and Tartakovsky2011; de Anna et al. Reference de Anna, Le Borgne, Dentz, Tartakovsky, Bolster and Davy2013; Kang et al. Reference Kang, de Anna, Nunes, Bijeljic, Blunt and Juanes2014; Holzner et al. Reference Holzner, Morales, Willmann and Dentz2015) based on the transit time distributions over characteristic pore lengths, which reflect the distribution of pore velocities. The interplay of wide transit time distributions and chaotic advection at the pore scale impacts both macroscopic transport and dispersion as well as pore-scale dilution.
Pore-scale chaotic advection has also been shown (Lester, Metcalfe & Trefry Reference Lester, Metcalfe and Trefry2014) to significantly suppress longitudinal dispersion arising from the no-slip wall condition due to transverse mixing generating an analogue of the Taylor–Aris mechanism. Conversely, the wide transit time distributions are expected to have a drastic impact on the dynamics of transverse mixing in conjunction with chaotic advection, as the transit times set the time scales over which significant stretching of a material fluid element occurs. While the impact of broad transit time distributions on the spatial spreading of transported elements is well understood, their impact upon mixing is an open question. As shown in Lester et al. (Reference Lester, Metcalfe and Trefry2014), Lagrangian chaos generates ergodic particle trajectories at the pore scale, and the associated decaying correlations allow the advection process to be modelled as a stochastic process. During advection through the pore space, fluid elements undergo punctuated stretching and folding (transverse to the mean flow direction) events at pore junctions, leading to persistent chaotic advection in random porous media. Such dynamics have been captured in an idealized 3D pore network model which contains the basic features common to all porous media, namely chaotic advection and no-slip boundary conditions, and so represents the minimum complexity inherent to all porous media.
In this paper we develop a novel stretching CTRW which captures the advection and deformation of material elements through this porous network model. This CTRW model is solved analytically in conjunction with an advection–diffusion equation (ADE) for the solute concentration, and thus describes mixing under the combined action of chaotic advection, molecular diffusion and wide transit time distributions within the pore space. Analytic model predictions are verified against numerical calculations and governing parameters are identified. This formalism allows the prediction of concentration probability distribution function (PDF) evolution within the pore space and quantification of the impact of chaotic advection upon mixing directly in terms of the relevant network properties.
To simplify the exposition we consider the steady-state pore-scale mixing of a concentration field that is heterogeneous at the pore scale but homogeneous at the macroscale, and these results are then extended to describe pore-scale mixing for an arbitrary macroscopic concentration distribution. We compare predictions of pore-scale mixing between random 3D porous networks that admit Lagrangian chaos and 2D networks that only permit non-chaotic dynamics. Hence, we quantify the impact of both network topology and structure upon pore-scale mixing and dispersion. These results form a quantitative basis for upscaling of pore-scale dynamics to macroscopic mixing and transport models, and establish the impact of ubiquitous chaotic mixing in 3D random porous media.
This paper is organized as follows. The mechanics of chaotic mixing in 3D porous media are briefly reviewed in § 2, followed by a description of the 3D open porous network model in § 3. Fluid stretching in this model network is discussed in § 4, from which a stretching CTRW model is derived in § 5. This model is then used to quantify the mixing in § 6, the evolution of the concentration PDF, mixing scale and dispersion are considered in § 7 and conclusions are made in § 8.
2 Pore-scale chaotic advection in 3D porous media
In this section we summarize the mechanisms that generate pore-scale chaotic advection as described in Lester et al. (Reference Lester, Metcalfe and Trefry2013), and further explain the role of critical points of the skin friction field. Topological complexity is a defining feature of all porous media, from granular and packed media to fractured and open networks; these materials are all typified by a highly connected pore space. Such topological complexity is characterized by the Euler characteristic
 $\unicode[STIX]{x1D712}$
(related to the topological genus
 $g$
as
 $\unicode[STIX]{x1D712}=2(1-g)$
) which measures the connectivity of the pore space (Vogel Reference Vogel, Mecke and Stoyan2002) as
 $$\begin{eqnarray}\displaystyle \unicode[STIX]{x1D712}=N-C+H, & & \displaystyle\end{eqnarray}$$
where
 $N$
is the number of pores,
 $C$
is the number of redundant connections and
 $H$
is the number of completely enclosed cavities. For porous media it is more meaningful to consider the average number density of these quantities, where from computer tomography studies (Vogel Reference Vogel, Mecke and Stoyan2002) it is found that typically
 $N$
is large while
 $C$
and
 $H$
are small. Hence, the number density of the Euler characteristic
 $\unicode[STIX]{x1D712}$
is typically large and negative (Vogel Reference Vogel, Mecke and Stoyan2002; Scholz et al.
Reference Scholz, Wirner, Götz, Rüde, Schröder-Turk, Mecke and Bechinger2012), reflecting topologically complex media.
When a continuous fluid is advected through such media, a large number of critical points (zeros)
 $\boldsymbol{x}_{p}$
arise in the skin friction field
 $\boldsymbol{u}(\boldsymbol{x})$
at the boundary
 $\unicode[STIX]{x2202}\mathscr{D}$
of the fluid domain
 $\mathscr{D}$
. The skin friction field
 $\boldsymbol{u}(\boldsymbol{x})$
is defined as
 $$\begin{eqnarray}\displaystyle \boldsymbol{u}(\boldsymbol{x})=\boldsymbol{u}(x_{1},x_{2},x_{3}):=\frac{\unicode[STIX]{x2202}\boldsymbol{v}}{\unicode[STIX]{x2202}x_{3}}, & & \displaystyle\end{eqnarray}$$
where
 $\boldsymbol{v}(x_{1},x_{2},x_{3})$
is the velocity field,
 $x_{3}$
is the coordinate normal to the fluid boundary
 $\unicode[STIX]{x2202}\mathscr{D}$
and the
 $x_{1}$
,
 $x_{2}$
coordinates are tangent to this boundary (de Winkel & Bakker Reference de Winkel and Bakker1988; Surana, Grunberg & Haller Reference Surana, Grunberg and Haller2006; Chong et al.
Reference Chong, Monty, Chin and Marusic2012). The critical points
 $\boldsymbol{x}_{p}$
of the skin friction field
 $\boldsymbol{u}$
(where
 $\boldsymbol{u}(\boldsymbol{x}_{p})=\mathbf{0}$
) represent the boundary counterparts to the stagnation points
 $\boldsymbol{x}_{0}$
of the interior flow field
 $\boldsymbol{v}$
(where
 $\boldsymbol{v}(\boldsymbol{x}_{0})=\mathbf{0}$
). It should be noted that the majority of stagnation points in pressure-driven Stokes flow with immobile boundaries are exterior points, as mechanisms to generate flow reversal (e.g. Moffatt vortices (Moffatt Reference Moffatt1964)) are rare.
The Poincaré–Hopf theorem states that the sum of the indices
 $\unicode[STIX]{x1D6FE}_{p}$
of critical points
 $\boldsymbol{x}_{p}$
is related to the topological genus
 $g$
and Euler characteristic
 $\unicode[STIX]{x1D712}$
as
 $$\begin{eqnarray}\displaystyle \mathop{\sum }_{p}\unicode[STIX]{x1D6FE}_{p}(\boldsymbol{x}_{p})=2(1-g)=\unicode[STIX]{x1D712}, & & \displaystyle\end{eqnarray}$$
where the index
 $\unicode[STIX]{x1D6FE}_{p}=-1$
for saddle points,
 $\unicode[STIX]{x1D6FE}_{p}=1$
for node points and
 $\unicode[STIX]{x1D6FE}_{p}=0$
for centres of the skin friction field. Hence,
 $|\unicode[STIX]{x1D712}|$
represents a lower bound for the number density of saddle points under steady 3D Stokes flow, which, as shall be shown, impart significant fluid stretching to the fluid interior. A relevant question is what the impact of this stretching is with respect to mixing in porous media.
Critical points play an important role with respect to the Lagrangian dynamics of 3D steady flows, as it is at these points that the formal analogy between transport in steady 3D volume-preserving flows and one-degree-of-freedom Hamiltonian systems breaks down (Bajer & Moffatt Reference Bajer and Moffatt1990; Bajer Reference Bajer1994), and such points are widely (Mezić & Wiggins Reference Mezić and Wiggins1994; Wiggins Reference Wiggins2010) implicated in the creation of Lagrangian chaos. Associated with these critical points are stable
 $\mathscr{W}^{s}$
and unstable
 $\mathscr{W}^{u}$
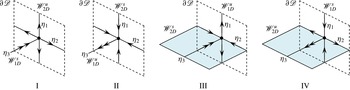
manifolds which project into the fluid interior, and these may be either one-dimensional (1D) or 2D, as shown in figure 1. MacKay (Reference MacKay1994, Reference MacKay, Chandre, Leoncini and Zaslavsky2008) proposes that the manifolds that are 2D represent surfaces of minimal transverse flux, and so the set of these co-dimension 1 manifolds forms the ‘skeleton’ of the flow which organizes transport and mixing throughout the fluid domain. While 1D manifolds also play a role, they are less important as they do not separate the fluid domain.
Schematic of type I–IV critical points of the skin friction field
 $\boldsymbol{u}$
on the boundary
 $\unicode[STIX]{x2202}\mathscr{D}$
and associated stable and unstable manifolds
 $\mathscr{W}^{s}$
,
 $\mathscr{W}^{u}$
. The double arrows reflect the eigenvalue sum
 $\unicode[STIX]{x1D702}_{1}+\unicode[STIX]{x1D702}_{2}+2\unicode[STIX]{x1D702}_{3}=0$
in (2.5).

The dimensionality of these interior manifolds
 $\mathscr{W}^{s}$
,
 $\mathscr{W}^{u}$
is dictated by the type of critical point (saddle, node, centre) and hence the index
 $\unicode[STIX]{x1D6FE}_{p}$
. Fluid deformation local to critical points
 $\boldsymbol{x}_{p}$
is quantified by the linearized skin friction tensor
 $\unicode[STIX]{x1D63C}=\unicode[STIX]{x2202}\boldsymbol{u}/\unicode[STIX]{x2202}\boldsymbol{x}|_{\boldsymbol{x}_{p}}$
which is the boundary counterpart of the strain-rate tensor
 $\unicode[STIX]{x1D641}=\unicode[STIX]{x2202}\boldsymbol{v}/\unicode[STIX]{x2202}\boldsymbol{x}|_{\boldsymbol{x}_{0}}$
which quantifies deformation local to the stagnation points
 $\boldsymbol{x}_{0}$
. The components
 $a_{ij}$
of the skin friction tensor
 $\unicode[STIX]{x1D63C}$
are given by the expansion
 $$\begin{eqnarray}\displaystyle u_{i}=\mathop{\sum }_{j=1}^{3}a_{ij}(x_{j}-x_{p,j})+O((x_{j}-x_{p,j})^{2}), & & \displaystyle\end{eqnarray}$$
and de Winkel & Bakker (Reference de Winkel and Bakker1988) and Chong et al. (Reference Chong, Monty, Chin and Marusic2012) have derived the normal form of
 $\unicode[STIX]{x1D63C}$
around a critical point
 $\boldsymbol{x}_{p}$
in an incompressible flow as
 $$\begin{eqnarray}\displaystyle \unicode[STIX]{x1D63C}=\left(\begin{array}{@{}ccc@{}}a_{11} & a_{12} & a_{13}\\ a_{21} & a_{22} & a_{23}\\ 0 & 0 & -\frac{1}{2}(a_{11}+a_{22})\end{array}\right). & & \displaystyle\end{eqnarray}$$
For incompressible flow the eigenvalues
 $\unicode[STIX]{x1D708}_{i}$
of
 $\unicode[STIX]{x1D641}$
satisfy
 $\sum _{i=1}^{3}\unicode[STIX]{x1D708}_{i}=\unicode[STIX]{x1D735}\boldsymbol{\cdot }\boldsymbol{v}=0$
, whereas the eigenvalues
 $\unicode[STIX]{x1D702}_{i}$
of
 $\unicode[STIX]{x1D63C}$
satisfy
 $\sum _{i=1}^{3}\unicode[STIX]{x1D702}_{i}=\unicode[STIX]{x1D735}\boldsymbol{\cdot }\boldsymbol{u}=-\unicode[STIX]{x1D702}_{3}$
, where
 $\unicode[STIX]{x1D702}_{1}$
,
 $\unicode[STIX]{x1D702}_{2}$
are the eigenvalues in the skin friction boundary (with
 $\unicode[STIX]{x1D702}_{1}\leqslant \unicode[STIX]{x1D702}_{2}$
), and
 $\unicode[STIX]{x1D702}_{3}$
is the interior eigenvalue. Hence, critical points consist of one stable and two unstable eigenvalues, or vice versa, and
 $\unicode[STIX]{x1D702}_{3}>0$
for separation points and
 $\unicode[STIX]{x1D702}_{3}<0$
for reattachment points. As (2.5) indicates that the boundary
 $\unicode[STIX]{x2202}\mathscr{D}$
is invariant, there exist four critical point types as shown in figure 1:
-
(1) type I separation point
 $\unicode[STIX]{x1D702}_{3}>0$
, attractor for
$\boldsymbol{u}$
with
$\unicode[STIX]{x1D702}_{1},\unicode[STIX]{x1D702}_{2}<0$
;
-
(2) type II reattachment point
$\unicode[STIX]{x1D702}_{3}<0$
, repeller for
$\boldsymbol{u}$
with
$\unicode[STIX]{x1D702}_{1},\unicode[STIX]{x1D702}_{2}>0$
; -
(3) type III separation point
$\unicode[STIX]{x1D702}_{3}>0$
, saddle for
$\boldsymbol{u}$
with
$\unicode[STIX]{x1D702}_{1}<0$
,
$\unicode[STIX]{x1D702}_{2}>0$
; -
(4) type IV reattachment point
$\unicode[STIX]{x1D702}_{3}<0$
, saddle for
$\boldsymbol{u}$
with
$\unicode[STIX]{x1D702}_{1}<0$
,
$\unicode[STIX]{x1D702}_{2}>0$
.


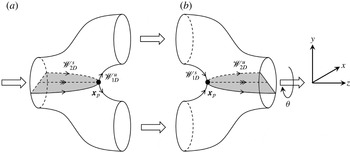
Types I, II are node points, while types III, IV are saddle points, and so the associated interior manifolds are 2D, forming barriers to transport in the fluid interior. Figure 2 illustrates these features for pore branch (a) and merge (b) elements (the union of which is termed a couplet) in an open porous network. Here, the saddle-type reattachment (type IV) and separation point (type III) points arise due to the basic topology of the pore branch and merger, and these generate the respective interior 2D manifolds
 $\mathscr{W}_{2D}^{u}$
,
 $\mathscr{W}_{2D}^{s}$
. While the geometry of pore branches and mergers may vary significantly, the basic topology shown in figure 2 is universal to almost all pore branches and mergers.
Schematic of pore branch (a) and merge (b) elements, where the black dots show the critical separation and attachment points respectively and the grey surfaces denote the associated 2D stable and unstable manifolds representing 2D surfaces of locally minimum transverse flux, the ‘skeleton’ of the flow. The angle
 $\unicode[STIX]{x1D703}$
denotes the relative orientation of the pore branch and merger elements.

The interaction of the 2D interior manifolds (
 $\mathscr{W}_{2D}^{s},\mathscr{W}_{2D}^{u}$
) controls fluid transport and mixing. If these 2D manifolds intersect transversely a heteroclinic tangle and chaotic dynamics result, whereas a smooth heteroclinic connection between them yields a 2D streamsurface that acts as a separatrix between saddle points. For the pore junction shown in figure 2, significant fluid stretching occurs transverse to the 2D interior manifolds, and folding of material elements arises from advection over the critical points
 $\boldsymbol{x}_{p}$
. These stretching and folding actions are the constituent motions of the Smale horseshoe map, a hallmark of chaotic dynamics in continuous systems. If a connected pore branch and merger are oriented symmetrically (as reflected by zero offset angle
 $\unicode[STIX]{x1D703}$
in figure 2), then this symmetry results in a smooth heteroclinic connection between the 2D manifolds. Conversely, when these pore elements are oriented with non-zero offset angle
 $\unicode[STIX]{x1D703}\neq 0$
, this symmetry is broken, resulting in transverse heteroclinic intersection of the 2D manifolds and hence chaotic streamline dynamics. The disordered nature of random porous media ensures that
 $\unicode[STIX]{x1D703}\neq 0$
and these symmetries are broken, leading to chaotic advection under steady flow conditions. While porous media may exhibit other features such as surface roughness or pore tortuosity which may also generate chaotic advection (Jones, Thomas & Aref Reference Jones, Thomas and Aref1989; Ottino & Wiggins Reference Ottino and Wiggins2004), a large density of saddle-type critical points is generic to all complex media; hence, the mechanisms described above represent a lower bound for chaotic dynamics inherent to porous media flow.
3 Three-dimensional open porous network model
To study the impact of such topology-induced chaotic advection upon transport and mixing in porous media, we consider a model 3D open porous network which consists of a random network of connected pore junctions and mergers shown in figure 2. We consider a 3D random network of these pore branches and mergers which is the simplest representation of a topologically complex open porous network that is homogeneous at the macroscale. Due to the spatial symmetries and reversibility of Stokes flow in these elements, we shall use a series of linear spatial transformations (reflection, scaling, reorientation, inversion) to map fluid transport and deformation in Stokes flow in the elements in figure 2 to construct the entire network. In this way we can develop a highly efficient model of fluid transport and deformation over a random 3D network.
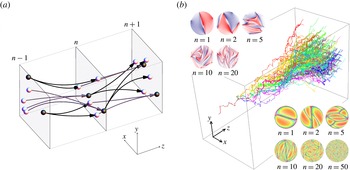
(a) Schematic of pore branches (black) and mergers (white) between mapping planes, with branch pores (black) and merge pores (white) shown. (b) (Middle) evolution of
 $10^{5}$
non-diffusive particles in the pore network from continuous injection in a single pore; (upper left) typical transverse distribution of non-diffusive coloured fluid particles with longitudinal pore number
 $n$
; (lower right) typical distribution of residence times (pink
 $=$
maximum, orange
 $=$
minimum) with longitudinal pore number
 $n$
.

To compose a 3D network over the semi-infinite domain
 $\unicode[STIX]{x1D6FA}:\boldsymbol{x}\in \mathbb{R}^{3},z>0$
, we use the pore branch and merge elements shown in figure 2 to connect a series of so-called ‘mapping planes’ oriented parallel to the
 $(x,y)$
plane, distributed along the
 $z$
axis at integer multiples of the pore element length
 $\ell$
. Each mapping plane consists of an infinite number of reflections in the
 $x$
,
 $y$
directions of a periodic square
 $(x,y)\in [0,L]\times [0,L]$
which contains
 $3J$
randomly located non-overlapping pores, as shown in figure 3. The location of the
 $j$
th pore in the
 $n$
th mapping plane is labelled
 $\boldsymbol{r}_{n,j}=(x_{n,j},y_{n,j},n\ell )$
. Of these
 $3J$
pores,
 $J$
are randomly labelled as ‘branch’ pores (i.e. pores that branch next in the positive
 $z$
direction), and the remaining
 $2J$
pores are labelled as ‘merge pores’ (i.e. those that are about to merge). A branch pore at plane
 $n$
is connected to two merge pores at plane
 $n+1$
by a pore branch element located between these planes, and conversely two branch pores at plane
 $n$
are connected to a single merge pore at plane
 $n$
by a pore merge element as per figure 2.
To accommodate connections between the merge pore locations
 $\boldsymbol{r}_{m_{1}},\boldsymbol{r}_{m_{2}}$
and the branch pore location
 $\boldsymbol{r}_{b_{1}}$
at adjacent mapping planes, the pore branch and merge elements are rotated and stretched such that the
 $\hat{\boldsymbol{e}}_{y}$
,
 $\hat{\boldsymbol{e}}_{z}$
vectors are aligned along
 $\boldsymbol{r}_{m_{1}}-\boldsymbol{r}_{m_{2}}$
,
 $\boldsymbol{r}_{b_{1}}-(\boldsymbol{r}_{m_{1}}+\boldsymbol{r}_{m_{2}})/2$
respectively, and the element height and length are rescaled to
 $\Vert \boldsymbol{r}_{m_{1}}-\boldsymbol{r}_{m_{2}}\Vert$
,
 $\Vert \boldsymbol{r}_{b_{1}}-(\boldsymbol{r}_{m_{1}}+\boldsymbol{r}_{m_{2}})/2\Vert$
respectively. The orientation angle
 $\unicode[STIX]{x1D711}$
in the
 $(x,y)$
plane of a pore branch/merge element is then
 $$\begin{eqnarray}\displaystyle \unicode[STIX]{x1D711}=\arctan \left(\frac{(\boldsymbol{r}_{m_{1}}-\boldsymbol{r}_{m_{2}})\boldsymbol{\cdot }\hat{\boldsymbol{e}}_{y}}{(\boldsymbol{r}_{m_{1}}-\boldsymbol{r}_{m_{2}})\boldsymbol{\cdot }\hat{\boldsymbol{e}}_{x}}\right), & & \displaystyle\end{eqnarray}$$
and the relative angle
 $\unicode[STIX]{x1D703}$
between subsequent elements is defined as
 $\unicode[STIX]{x1D703}_{n}=\unicode[STIX]{x1D711}_{n+1}-\unicode[STIX]{x1D711}_{n}$
. Hence, the set of non-overlapping pore locations
 $\boldsymbol{r}_{n,j}$
for
 $n=0:\infty$
,
 $j=1:3J$
completely defines a realization of the 3D open porous network, and the ensemble of all realizations of the porous network is ergodic and stationary. The resultant random orientation angle
 $\unicode[STIX]{x1D711}$
is uniformly distributed and is uncorrelated both across and within mapping planes; hence, transport within the 3D open porous network may be described by a Markov process in space.
To model transport within the porous network, we solve the fluid velocity field
 $\boldsymbol{v}$
for Stokes flow
 $\unicode[STIX]{x1D707}\unicode[STIX]{x1D6FB}^{2}\boldsymbol{v}+\unicode[STIX]{x1D735}p=0$
within the pore branch element
 $\unicode[STIX]{x1D6FA}$
driven by a differential pressure
 $p|_{z=0}-p|_{z=L}=\unicode[STIX]{x0394}p$
, subject to the no-slip boundary condition
 $\boldsymbol{v}|_{\unicode[STIX]{x2202}\unicode[STIX]{x1D6FA}}=0$
. The flow field is calculated numerically to order
 $10^{-16}$
root mean square accuracy using the finite-volume computational fluid dynamics (CFD) package ANSYS-CFX with double precision calculation. The advection dynamics for passive tracer particles within the branch element
 $\unicode[STIX]{x1D6FA}$
under Stokes flow can be represented by the spatial
 $\mathscr{M}^{\ast }$
and temporal
 $\mathscr{T}^{\ast }$
maps
 $$\begin{eqnarray}\displaystyle & \displaystyle \mathscr{M}^{\ast }:\{x_{r,n},y_{r,n}\}\mapsto \{x_{r,n+1},y_{r,n+1}\}, & \displaystyle\end{eqnarray}$$
 $$\begin{eqnarray}\displaystyle & \displaystyle \mathscr{T}^{\ast }:t_{n}\mapsto t_{n+1}, & \displaystyle\end{eqnarray}$$
 $\{x_{r,n},y_{r,n}\}$
are the
 $x,y$
particle positions relative to the inlet of
 $\unicode[STIX]{x1D6FA}$
(where
 $x_{r,n}^{2}+y_{r,n}^{2}=0,1$
correspond to the pore centre and boundary respectively), and
 $\{x_{r,n+1},y_{r,n+1}\}$
are the positions relative to the outlet of
 $\unicode[STIX]{x1D6FA}$
. It should be noted that
 $x_{r,n+1},y_{r,n+1}$
do not reflect the specific outlet pore the particle travels to, as a direct consequence of the reflection symmetry of the flow about the plane
 $y_{r}=0$
. Similarly, the temporal map
 $\mathscr{T}^{\ast }$
describes the residence time from the inlet to outlet planes. From the CFD results, the exact spatial
 $\mathscr{M}^{\ast }$
and temporal
 $\mathscr{T}^{\ast }$
maps are remarkably well approximated (within error
 $\unicode[STIX]{x1D716}\sim 10^{-3}$
) by composites of the following simple analytic maps:
 $$\begin{eqnarray}\displaystyle & \displaystyle \mathscr{M}:\{x_{r},y_{r}\}\mapsto \left\{\begin{array}{@{}l@{}}\{x_{r},2y_{r}-\sqrt{1-x_{r}^{2}}\}\quad \text{if }y_{r}>0,\quad \\ \{x_{r},2y_{r}+\sqrt{1-x_{r}^{2}}\}\quad \text{if }y_{r}\leqslant 0,\quad \end{array}\right. & \displaystyle\end{eqnarray}$$
 $$\begin{eqnarray}\displaystyle & \displaystyle \mathscr{T}:t\mapsto t+\frac{1}{1-x_{r}^{2}-y_{r}^{2}}, & \displaystyle\end{eqnarray}$$
 $\mathscr{M}^{\ast }\approx \mathscr{M}$
,
 $\mathscr{T}^{\ast }\approx \mathscr{T}\circ \mathscr{M}$
, and due to the reflection symmetry of Stokes flow
 $\mathscr{M}^{\ast }\approx \mathscr{M}^{-1}$
,
 $\mathscr{T}^{\ast }\approx \mathscr{T}\circ \mathscr{M}^{-1}$
for a pore merger. These approximate maps greatly simplify the description of the advection dynamics and preserve the essential features of advective transport, namely stretching in a pore branch (and contraction in a pore merger) of fluid elements by a factor of 2 in the
 $y$
direction, and the Poiseuille-like distribution of
 $\mathscr{T}$
(scaled such that the minimum advection time is unity) due to the no-slip boundary conditions. The composite
 $\mathscr{T}^{\ast }\approx \mathscr{T}\circ \mathscr{M}$
accurately captures the residence time distribution because the advection map
 $\mathscr{M}$
accurately captures the streamline geometry, and the no-slip boundary condition within
 $\unicode[STIX]{x1D6FA}$
dominates temporal advection. Hence, a simple Poiseuille distribution concatenated with
 $\mathscr{M}$
accurately approximates the temporal map
 $\mathscr{T}^{\ast }$
. While the advective maps
 $\mathscr{M}$
,
 $\mathscr{M}^{-1}$
are not area-preserving, they are implicitly volume-preserving when deformation in the
 $z$
direction is considered.
While the symmetry of the pore branch and merger results in zero fluid stretching (as reflected by the concatenation
 $\mathscr{M}^{-1}\circ \mathscr{M}=I$
, where
 $I$
is the identity operator), these elements at arbitrary orientations in the
 $xy$
plane can break this symmetry and lead to persistent fluid stretching. The reoriented advective maps
 $\mathscr{S}(\unicode[STIX]{x1D711})$
,
 $\mathscr{S}^{-1}(\unicode[STIX]{x1D711})$
define transport in pore branches and mergers at arbitrary angles,
 $$\begin{eqnarray}\displaystyle \mathscr{S}(\unicode[STIX]{x1D711})=R(\unicode[STIX]{x1D711})\circ \mathscr{M}\circ R(-\unicode[STIX]{x1D711}),\quad \mathscr{S}^{-1}(\unicode[STIX]{x1D711})=R(\unicode[STIX]{x1D711})\circ \mathscr{M}^{-1}\circ R(-\unicode[STIX]{x1D711}), & & \displaystyle\end{eqnarray}$$
where
 $R(\unicode[STIX]{x1D711})$
is a rotation operator and
 $\mathscr{S}^{-1}(\unicode[STIX]{x1D711}_{n+1})\circ \mathscr{S}(\unicode[STIX]{x1D711}_{n})\neq I$
for
 $\unicode[STIX]{x1D703}_{n}=\unicode[STIX]{x1D711}_{n+1}-\unicode[STIX]{x1D711}_{n}\neq 0$
. Coupled with the residence time distribution
 $\mathscr{T}$
, the composite maps
 $\mathscr{S}$
,
 $\mathscr{S}^{-1}$
quantify advective transport relative to a local co-moving reference frame through the 3D porous network, and so the position and residence time of fluid particles can be rapidly propagated via these approximate maps, as shown in figure 3. Hence, the sequence of alignment angles
 $\unicode[STIX]{x1D711}_{1},\unicode[STIX]{x1D711}_{2},\ldots$
for a particular trajectory can impart either regular or chaotic advection at the pore scale (Lester et al.
Reference Lester, Metcalfe and Trefry2013), and the associated infinite-time Lyapunov exponent for ordered porous media spans
 $\unicode[STIX]{x1D706}_{\infty }\in [0,\ln 2]$
. It should be noted that
 $\unicode[STIX]{x1D706}_{\infty }$
is the Lyapunov exponent per pore branch, related to the Lyapunov exponent per unit time
 $\unicode[STIX]{x1D706}_{\infty }^{\ast }$
as
 $\unicode[STIX]{x1D706}_{\infty }^{\ast }=\unicode[STIX]{x1D706}_{\infty }/\unicode[STIX]{x0394}t_{a}$
, where
 $\unicode[STIX]{x0394}t_{a}$
is the mean residence time per pore branch. Conversely, for random media
 $\unicode[STIX]{x1D703}_{n}$
is uniformly distributed over
 $[-\unicode[STIX]{x03C0},\unicode[STIX]{x03C0}]$
and so always generates chaotic advection.
This basic pore network model has been used (Lester et al.
Reference Lester, Metcalfe and Trefry2013, Reference Lester, Metcalfe and Trefry2014) to study the impact of pore-scale chaotic advection upon dispersion in porous media, i.e. the spatial spreading of transport particles. Figure 3(b) illustrates the evolution of
 $10^{5}$
non-diffusive particles propagated by the composite maps
 $\mathscr{S}$
,
 $\mathscr{S}^{-1}$
through a realization of the random network. The lower right subfigure in figure 3(b) illustrates the creation of fine-scale structure via chaotic advection within the pore scale (from an initially segregated distribution of half blue/half red points across all pores), and the upper left subfigure shows the evolution of the residence time distribution evolved via the composite temporal maps
 $\mathscr{S}\circ \mathscr{T}$
,
 $\mathscr{S}^{-1}\circ \mathscr{T}$
. It should be noted that there is no visual evidence of folding of fluid elements in the
 $xy$
plane, as folding occurs around critical points
 $\boldsymbol{x}_{p}$
as fluid elements are advected downstream in the
 $z$
direction.
4 Fluid advection and deformation in 3D porous networks
4.1 Fluid deformation in 3D ordered networks
To calculate mixing within the 3D network model, we consider the deformation of a 2D material surface arising from continuous injection of a 1D line at the inlet plane due the mean flow in the
 $z$
direction. It shall prove convenient to consider this steady 2D filament as an evolving 1D material line at the intersection of each mapping plane, the constituent points of which are advected via the maps
 $\mathscr{S}$
,
 $\mathscr{S}^{-1}$
. While fluid deformation does occur in the
 $z$
direction, the impact upon mixing is considered to be negligible due to close alignment of the continuously injected 2D filament with the mean flow direction. Hence, the gross impact of chaotic advection upon mixing is to accelerate mixing in the
 $xy$
plane transverse to the mean flow direction
 $z$
.
As the advective map
 $\mathscr{M}$
maps fluid particles from the inlet to the outlet pores, the 2D fluid deformation gradient tensor
 $\unicode[STIX]{x1D641}_{2D}$
over a pore branch is given by the Jacobian of
 $\mathscr{M}$
, which may be linearized as
 $$\begin{eqnarray}\displaystyle \unicode[STIX]{x1D641}_{2D}=\frac{\unicode[STIX]{x2202}\mathscr{M}_{i}}{\unicode[STIX]{x2202}x_{j}}=\left(\begin{array}{@{}cc@{}}1 & \pm \displaystyle \frac{x}{\sqrt{1-x^{2}}}\\ 0 & 2\end{array}\right)\approx \left(\begin{array}{@{}cc@{}}1 & 0\\ 0 & 2\end{array}\right), & & \displaystyle\end{eqnarray}$$
and likewise fluid deformation for
 $\mathscr{M}^{-1}$
over a pore merger is given by
 $\unicode[STIX]{x1D641}_{2D}^{-1}$
. The CFD results show that this linearization well approximates fluid deformation in the pore branch and merger. The pore branch acts to stretch fluid elements by 2 in the
 $y$
direction, and contract elements by
 $1/2$
in the
 $z$
direction (not reflected in
 $\unicode[STIX]{x1D641}_{2D}$
), while the pore merger contracts elements by
 $1/2$
in the
 $y$
direction and stretches by a factor of
 $2$
in the
 $z$
direction. To account for arbitrary orientations we consider the reoriented deformation tensors
 $$\begin{eqnarray}\displaystyle \unicode[STIX]{x1D64E}_{s}=\unicode[STIX]{x1D64D}(\unicode[STIX]{x1D711}_{s})\boldsymbol{\cdot }\unicode[STIX]{x1D641}_{2D}\boldsymbol{\cdot }\unicode[STIX]{x1D64D}^{-1}(\unicode[STIX]{x1D711}_{s}),\quad \unicode[STIX]{x1D64E}_{c}=\unicode[STIX]{x1D64D}(\unicode[STIX]{x1D711}_{c})\boldsymbol{\cdot }\unicode[STIX]{x1D641}_{2D}^{-1}\boldsymbol{\cdot }\unicode[STIX]{x1D64D}^{-1}(\unicode[STIX]{x1D711}_{c}), & & \displaystyle\end{eqnarray}$$
where
 $\unicode[STIX]{x1D64D}(\unicode[STIX]{x1D711})$
is the rotation matrix, and the subscripts
 $s$
and
 $c$
indicate fluid stretching (in the pore branch) and compression (in the pore merger) respectively. The fluid deformation over a coupled pore branch/merge element (couplet) is then
 $$\begin{eqnarray}\displaystyle \unicode[STIX]{x1D64E}:=\unicode[STIX]{x1D64E}_{c}\boldsymbol{\cdot }\unicode[STIX]{x1D64E}_{s} & = & \displaystyle \unicode[STIX]{x1D64D}(\unicode[STIX]{x1D711}_{c})\boldsymbol{\cdot }\unicode[STIX]{x1D641}_{2D}\boldsymbol{\cdot }\unicode[STIX]{x1D64D}(\unicode[STIX]{x1D6E5})\boldsymbol{\cdot }\unicode[STIX]{x1D641}_{2D}^{-1}\boldsymbol{\cdot }\unicode[STIX]{x1D64D}^{-1}(\unicode[STIX]{x1D6E5})\boldsymbol{\cdot }\unicode[STIX]{x1D64D}^{-1}(\unicode[STIX]{x1D711}_{c})\nonumber\\ \displaystyle & = & \displaystyle \unicode[STIX]{x1D64D}(\unicode[STIX]{x1D711}_{c})\boldsymbol{\cdot }\unicode[STIX]{x1D63F}(\unicode[STIX]{x1D6E5})\boldsymbol{\cdot }\unicode[STIX]{x1D64D}^{-1}(\unicode[STIX]{x1D711}_{c}),\end{eqnarray}$$
where
 $\unicode[STIX]{x1D6E5}=\unicode[STIX]{x1D711}_{c}-\unicode[STIX]{x1D711}_{s}$
. The net deformation over a series of
 $n$
concatenated couplets is then given by the series
 $$\begin{eqnarray}\displaystyle \boldsymbol{\unicode[STIX]{x1D6EC}}_{n} & = & \displaystyle \unicode[STIX]{x1D64D}(\unicode[STIX]{x1D711}_{n})\boldsymbol{\cdot }\unicode[STIX]{x1D63F}(\unicode[STIX]{x1D6E5}_{n})\boldsymbol{\cdot }\unicode[STIX]{x1D64D}^{-1}(\unicode[STIX]{x1D711}_{n})\boldsymbol{\cdot }\cdots \boldsymbol{\cdot }\unicode[STIX]{x1D64D}(\unicode[STIX]{x1D711}_{1})\boldsymbol{\cdot }\unicode[STIX]{x1D63F}(\unicode[STIX]{x1D6E5}_{1})\boldsymbol{\cdot }\unicode[STIX]{x1D64D}^{-1}(\unicode[STIX]{x1D711}_{1}),\nonumber\\ \displaystyle & = & \displaystyle \unicode[STIX]{x1D64D}(\unicode[STIX]{x1D711}_{n})\boldsymbol{\cdot }\left(\mathop{\prod }_{j=1}^{n}\unicode[STIX]{x1D647}(\unicode[STIX]{x1D6FF}_{j},\unicode[STIX]{x1D6E5}_{j})\right)\boldsymbol{\cdot }\unicode[STIX]{x1D64D}^{-1}(\unicode[STIX]{x1D711}_{n}),\end{eqnarray}$$
where
 $\unicode[STIX]{x1D647}(\unicode[STIX]{x1D6FF},\unicode[STIX]{x1D6E5}):=\unicode[STIX]{x1D64D}(\unicode[STIX]{x1D6FF})\boldsymbol{\cdot }\unicode[STIX]{x1D63F}(\unicode[STIX]{x1D6E5})$
,
 $\unicode[STIX]{x1D6FF}_{j}=\unicode[STIX]{x1D711}_{j+1}-\unicode[STIX]{x1D711}_{j}$
for
 $j=1:n-1$
and
 $\unicode[STIX]{x1D6FF}_{n}=\unicode[STIX]{x1D711}_{1}-\unicode[STIX]{x1D711}_{n}$
. Hence, the deformation tensor
 $\unicode[STIX]{x1D647}(\unicode[STIX]{x1D6FF},\unicode[STIX]{x1D6E5})$
quantifies fluid deformation over a series of connected pore couplets. For ordered media with fixed
 $\unicode[STIX]{x1D6FF}$
,
 $\unicode[STIX]{x1D6E5}$
, the fluid deformation is quantified by the infinite-time Lyapunov exponent
 $\unicode[STIX]{x1D706}$
given by the logarithm of the eigenvalues of the deformation tensor
 $\unicode[STIX]{x1D647}(\unicode[STIX]{x1D6FF},\unicode[STIX]{x1D6E5})$
,
 $$\begin{eqnarray}\displaystyle \unicode[STIX]{x1D706}(\unicode[STIX]{x1D6FF},\unicode[STIX]{x1D6E5})=\pm \ln |\unicode[STIX]{x1D701}+\sqrt{\unicode[STIX]{x1D701}^{2}-1}|, & & \displaystyle\end{eqnarray}$$
where
 $\unicode[STIX]{x1D701}=(9/8)\cos \unicode[STIX]{x1D6FF}-(\cos (2\unicode[STIX]{x1D6E5}+\unicode[STIX]{x1D6FF}))/8$
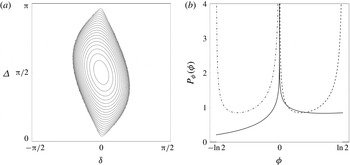
. As shown in figure 4(a), zero net deformation occurs for
 $|\unicode[STIX]{x1D701}|\leqslant 1$
, while maximum deformation (
 $\unicode[STIX]{x1D706}=\ln 2$
) occurs for
 $\unicode[STIX]{x1D6E5}=(n+1/2)\unicode[STIX]{x03C0}$
,
 $\unicode[STIX]{x1D6FF}=n\unicode[STIX]{x03C0}$
,
 $n=0,1,2,\ldots .$
Hence, ordered 3D porous networks represent extreme cases with respect to fluid stretching; while a large class (
 $|\unicode[STIX]{x1D701}|\leqslant 1$
) of ordered media do not exhibit chaotic advection (
 $\unicode[STIX]{x1D706}=0$
), certain networks exhibit the maximum theoretic stretching (
 $\unicode[STIX]{x1D706}=\ln 2$
) for continuous systems.
(a) Contour plot of the distribution of logarithmic stretching rates
 $\unicode[STIX]{x1D706}(\unicode[STIX]{x1D6FF},\unicode[STIX]{x1D6E5})$
in ordered 3D networks as a function of the orientation angles
 $\unicode[STIX]{x1D6FF}$
,
 $\unicode[STIX]{x1D6E5}$
, between and within pore couplets. The stretching rate
 $\unicode[STIX]{x1D706}$
varies between
 $\unicode[STIX]{x1D706}=0$
for
 $|\unicode[STIX]{x1D701}|\leqslant 1$
and the theoretical maximum for continuous systems
 $\unicode[STIX]{x1D706}=\ln 2$
for
 $\unicode[STIX]{x1D701}=5/4$
at
 $\unicode[STIX]{x1D6E5}=\unicode[STIX]{x03C0}/2$
,
 $\unicode[STIX]{x1D6FF}=0$
. (b) The PDFs of the logarithmic stretching rates
 $P_{\unicode[STIX]{x1D719}}(\unicode[STIX]{x1D719})$
(solid),
 $P_{\unicode[STIX]{x1D719}_{s}}(\unicode[STIX]{x1D719}_{s})$
(dashed) and
 $P_{\unicode[STIX]{x1D719}_{c}}(\unicode[STIX]{x1D719}_{c})$
(dot-dashed) in random 3D networks. It should be noted that
 $P_{\unicode[STIX]{x1D719}}(\unicode[STIX]{x1D719})$
is strongly peaked but asymmetric around
 $\unicode[STIX]{x1D719}=0$
.

The stretching rate
 $\unicode[STIX]{x1D706}(\unicode[STIX]{x1D6FF},\unicode[STIX]{x1D6E5})$
quantifies the stretching of the 2D material filament as it propagates through the 3D network in that the length
 $l$
of the filament cross-section in the
 $xy$
plane grows with the longitudinal pore number
 $n$
or distance
 $z$
as
 $$\begin{eqnarray}\displaystyle l(z)=l_{0}\exp (\unicode[STIX]{x1D706}(\unicode[STIX]{x1D6FF},\unicode[STIX]{x1D6E5})n)=l_{0}\exp \left(\unicode[STIX]{x1D706}(\unicode[STIX]{x1D6FF},\unicode[STIX]{x1D6E5})\frac{z}{\ell }\right), & & \displaystyle\end{eqnarray}$$
where
 $l_{0}$
is the initial length of the filament cross-section. In the presence of chaotic advection (
 $\unicode[STIX]{x1D706}>0$
), exponential growth of the filament cross-section is accommodated by striated packing within pores as per figure 3.
4.2 Fluid deformation in 3D random networks
In contrast to ordered 3D networks, the orientation angle
 $\unicode[STIX]{x1D703}$
between pore elements in the model random 3D network follows a Markov process, and so the average stretching rate
 $\unicode[STIX]{x1D706}_{\infty }$
(Lyapunov exponent) is calculated by Lester et al. (Reference Lester, Metcalfe and Trefry2013) as
 $$\begin{eqnarray}\displaystyle \unicode[STIX]{x1D706}_{\infty }=\frac{1}{\unicode[STIX]{x03C0}^{2}}\int _{-\unicode[STIX]{x03C0}/2}^{\unicode[STIX]{x03C0}/2}\text{d}\unicode[STIX]{x1D6FF}\int _{0}^{\unicode[STIX]{x03C0}}\text{d}\unicode[STIX]{x0394}\unicode[STIX]{x1D706}(\unicode[STIX]{x1D6FF},\unicode[STIX]{x1D6E5})\approx 0.1178. & & \displaystyle\end{eqnarray}$$
To develop a model of deformation in a random network we consider the evolution of an arbitrary infinitesimal material line element
 $\unicode[STIX]{x1D6FF}\boldsymbol{l}$
, which evolves with pore number
 $n$
over the branch and merge elements respectively via the two-step process
 $$\begin{eqnarray}\displaystyle \unicode[STIX]{x1D6FF}\boldsymbol{l}_{2n+1}=\unicode[STIX]{x1D64D}(\unicode[STIX]{x1D711}_{s})\boldsymbol{\cdot }\unicode[STIX]{x1D641}_{2D}\boldsymbol{\cdot }\unicode[STIX]{x1D64D}^{-1}(\unicode[STIX]{x1D711}_{s})\cdot \unicode[STIX]{x1D6FF}\boldsymbol{l}_{2n},\quad \unicode[STIX]{x1D6FF}\boldsymbol{l}_{2n+2}=\unicode[STIX]{x1D64D}(\unicode[STIX]{x1D711}_{c})\boldsymbol{\cdot }\unicode[STIX]{x1D641}_{2D}^{-1}\boldsymbol{\cdot }\unicode[STIX]{x1D64D}^{-1}(\unicode[STIX]{x1D711}_{c})\cdot \unicode[STIX]{x1D6FF}\boldsymbol{l}_{2n+1},\qquad & & \displaystyle\end{eqnarray}$$
where
 $\unicode[STIX]{x1D711}_{s}$
and
 $\unicode[STIX]{x1D711}_{c}$
are the orientation angles of the pore branch and merger with respect to the
 $y$
direction. For random media, these angles are randomly, independently and uniformly distributed. As such, it is not necessary to resolve the absolute orientation of the line element
 $\unicode[STIX]{x1D6FF}\boldsymbol{l}$
, but rather
 $\unicode[STIX]{x1D711}_{s}$
,
 $\unicode[STIX]{x1D711}_{c}$
can be reframed as the orientation angles of the pore branch or merger with respect to the line element without change to (4.8). Henceforth, we shall use this definition of
 $\unicode[STIX]{x1D711}$
, and so the length
 $\unicode[STIX]{x1D6FF}l=|\unicode[STIX]{x1D6FF}\boldsymbol{l}|$
of the line element then evolves via the two-step process
 $$\begin{eqnarray}\displaystyle \unicode[STIX]{x1D6FF}l_{2n+1}=\unicode[STIX]{x1D6FF}l_{2n}\unicode[STIX]{x1D70C}_{s}(\unicode[STIX]{x1D711}_{2n}),\quad \unicode[STIX]{x1D6FF}l_{2n+2}=\unicode[STIX]{x1D6FF}l_{2n+1}\unicode[STIX]{x1D70C}_{c}(\unicode[STIX]{x1D711}_{2n+1}), & & \displaystyle\end{eqnarray}$$
where
 $\unicode[STIX]{x1D70C}_{s}$
,
 $\unicode[STIX]{x1D70C}_{c}$
respectively are the relative elongations due to stretching and compression within a pore branch and merger derived from (4.2):
 $$\begin{eqnarray}\displaystyle \unicode[STIX]{x1D70C}_{s}(\unicode[STIX]{x1D711}_{s})=\sqrt{1+3\cos ^{2}\unicode[STIX]{x1D711}_{s}},\quad \unicode[STIX]{x1D70C}_{c}(\unicode[STIX]{x1D711}_{c})={\textstyle \frac{1}{2}}\sqrt{4-3\cos ^{2}\unicode[STIX]{x1D711}_{c}}. & & \displaystyle\end{eqnarray}$$
The mean stretching
 $\unicode[STIX]{x1D706}_{s}$
and compression
 $\unicode[STIX]{x1D706}_{c}$
rates within a pore branch and merger are then
 $$\begin{eqnarray}\displaystyle \unicode[STIX]{x1D706}_{s}=\frac{1}{2\unicode[STIX]{x03C0}}\int _{-\unicode[STIX]{x03C0}}^{\unicode[STIX]{x03C0}}\text{d}\unicode[STIX]{x1D711}_{s}\ln [\unicode[STIX]{x1D70C}_{s}(\unicode[STIX]{x1D711}_{s})]\approx 0.4055,\quad \unicode[STIX]{x1D706}_{c}=\frac{1}{2\unicode[STIX]{x03C0}}\int _{-\unicode[STIX]{x03C0}}^{\unicode[STIX]{x03C0}}\text{d}\unicode[STIX]{x1D711}_{c}\ln [\unicode[STIX]{x1D70C}_{c}(\unicode[STIX]{x1D711}_{c})]\approx -0.2877, & & \displaystyle \nonumber\\ \displaystyle & & \displaystyle\end{eqnarray}$$
and the sum of these stretching rates recovers the infinite-time Lyapunov exponent
 $\unicode[STIX]{x1D706}_{\infty }\approx 0.1178$
. The full distribution of stretching rates can be derived from (4.10) as
 $$\begin{eqnarray}\displaystyle P_{\unicode[STIX]{x1D70C}_{s}}(\unicode[STIX]{x1D70C}_{s})=\frac{4}{\unicode[STIX]{x03C0}\sqrt{\unicode[STIX]{x1D70C}_{s}^{2}-1}\sqrt{4-\unicode[STIX]{x1D70C}_{s}^{2}}},\quad P_{\unicode[STIX]{x1D70C}_{c}}(\unicode[STIX]{x1D70C}_{c})=\frac{4}{\unicode[STIX]{x03C0}\sqrt{1-\unicode[STIX]{x1D70C}_{c}^{2}}\sqrt{4\unicode[STIX]{x1D70C}_{c}^{2}-1}}, & & \displaystyle\end{eqnarray}$$
and the total stretch
 $\unicode[STIX]{x1D70C}:=\unicode[STIX]{x1D70C}_{s}\unicode[STIX]{x1D70C}_{c}$
over a couplet is then distributed as
 $$\begin{eqnarray}\displaystyle P_{\unicode[STIX]{x1D70C}}(\unicode[STIX]{x1D70C}) & = & \displaystyle \int _{\frac{1}{2}}^{1}\text{d}\unicode[STIX]{x1D70C}_{c}^{\prime }\int _{1}^{2}\text{d}\unicode[STIX]{x1D70C}_{s}^{\prime }P_{\unicode[STIX]{x1D70C}_{s}}(\unicode[STIX]{x1D70C}_{s}^{\prime })P_{\unicode[STIX]{x1D70C}_{c}}(\unicode[STIX]{x1D70C}_{c}^{\prime })\unicode[STIX]{x1D6FF}(\unicode[STIX]{x1D70C}-\unicode[STIX]{x1D70C}_{c}^{\prime }\unicode[STIX]{x1D70C}_{s}^{\prime }),\nonumber\\ \displaystyle & = & \displaystyle \frac{4}{\unicode[STIX]{x03C0}^{2}}\left|\frac{\unicode[STIX]{x1D70C}}{\unicode[STIX]{x1D70C}^{2}-1}\right|K\left(1-\frac{9\unicode[STIX]{x1D70C}^{2}}{4\unicode[STIX]{x1D70C}^{2}-4}\right),\unicode[STIX]{x1D70C}\in \left[\frac{1}{2},2\right],\end{eqnarray}$$
where
 $K$
is the complete elliptic integral of the first kind. To develop an additive process for fluid deformation we consider the evolution of the logarithmic length
 $s:=\ln \unicode[STIX]{x1D6FF}l$
of a line element, where
 $s$
evolves over a couplet via the one-step additive process
 $$\begin{eqnarray}\displaystyle s_{n+2}=s_{n}+\unicode[STIX]{x1D719}, & & \displaystyle\end{eqnarray}$$
and the stretching increment
 $\unicode[STIX]{x1D719}=\ln \unicode[STIX]{x1D70C}$
is distributed as
 $P_{\unicode[STIX]{x1D719}}(\unicode[STIX]{x1D719})=\exp (\unicode[STIX]{x1D719})P_{\unicode[STIX]{x1D70C}}(\exp \unicode[STIX]{x1D719})$
, for
 $\unicode[STIX]{x1D719}\in [-\ln \,2,\ln 2]$
. Asymmetry of the stretching PDF
 $P_{\unicode[STIX]{x1D719}}(\unicode[STIX]{x1D719})$
for random
 $\unicode[STIX]{x1D711}_{s}$
,
 $\unicode[STIX]{x1D711}_{c}$
leads to persistent fluid stretching, as shown in figure 4(b) and reflected by the Lyapunov exponent
 $\unicode[STIX]{x1D706}_{\infty }$
. This asymmetry arises from the basic differences between stretching and compression; within a pore branch stretching is enhanced as the material line rotates towards the maximum stretching direction, while compression is retarded in a pore merger due to rotation away from the contraction direction. Hence, while transverse fluid stretching and compression are equally partitioned in random 3D networks, the asymmetry between stretching and compression generates persistent exponential stretching.
As both the mean
 $\unicode[STIX]{x1D706}_{\infty }$
and the variance
 $\unicode[STIX]{x1D70E}^{2}\approx 0.1144$
of the stretching increment distribution
 $P_{\unicode[STIX]{x1D719}}(\unicode[STIX]{x1D719})$
are bounded, then from the central limit theorem the PDF of the non-dimensional strip elongation
 $\unicode[STIX]{x1D70C}_{n}=\unicode[STIX]{x1D6FF}l_{n}/\unicode[STIX]{x1D6FF}l_{0}$
converges to a lognormal distribution
 $$\begin{eqnarray}\displaystyle \hat{p}_{\unicode[STIX]{x1D70C}}(\unicode[STIX]{x1D70C},n)\approx \frac{1}{\unicode[STIX]{x1D70C}\sqrt{\unicode[STIX]{x03C0}n\unicode[STIX]{x1D70E}^{2}}}\exp \left[-\frac{(\ln \unicode[STIX]{x1D70C}-n\unicode[STIX]{x1D706}_{\infty }/2)^{2}}{n\unicode[STIX]{x1D70E}^{2}}\right], & & \displaystyle\end{eqnarray}$$
which captures the convergence of the finite-time Lyapunov exponents
 $\unicode[STIX]{x1D706}_{n}=s_{n}/n$
towards
 $\unicode[STIX]{x1D706}_{\infty }$
as per Lester et al. (Reference Lester, Metcalfe and Trefry2013). As material filaments flow through pore branches and mergers in random 3D porous networks, they undergo a series of punctuated stretching and compression events around critical points which lead to net exponential stretching transverse to the mean flow direction.
It should be noted that the PDF (4.15) quantifies the pointwise elongation statistics for an infinitesimal line element. However, when sampling an evolving 1D material line in space, the sampling rate is proportional to the length of the entire 1D line. This is important because the solute concentration statistics are determined by spatial sampling across such a 1D line. The elongation PDF weighted by the length of the entire line,
 $p_{\unicode[STIX]{x1D70C}}(\unicode[STIX]{x1D70C},n)\propto \unicode[STIX]{x1D70C}\hat{p}_{\unicode[STIX]{x1D70C}}(\unicode[STIX]{x1D70C},n)$
, is then
 $$\begin{eqnarray}\displaystyle p_{\unicode[STIX]{x1D70C}}(\unicode[STIX]{x1D70C},n)=\frac{1}{\unicode[STIX]{x1D70C}\sqrt{2\unicode[STIX]{x03C0}\unicode[STIX]{x1D70E}_{\ln \unicode[STIX]{x1D70C}}^{2}}}\exp \left[-\frac{(\ln \unicode[STIX]{x1D70C}-\unicode[STIX]{x1D707}_{\ln \unicode[STIX]{x1D70C}})^{2}}{2\unicode[STIX]{x1D70E}_{\ln \unicode[STIX]{x1D70C}}^{2}}\right], & & \displaystyle\end{eqnarray}$$
where
 $\unicode[STIX]{x1D707}_{\ln \unicode[STIX]{x1D70C}}=n\unicode[STIX]{x1D6EC}_{\infty }/2$
,
 $\unicode[STIX]{x1D70E}_{\ln \unicode[STIX]{x1D70C}}^{2}=n\unicode[STIX]{x1D70E}^{2}/2$
and
 $\unicode[STIX]{x1D6EC}_{\infty }:=\unicode[STIX]{x1D706}_{\infty }+\unicode[STIX]{x1D70E}^{2}$
. Due to issues of non-stationarity and nonlinearity of the map
 $\mathscr{M}$
, the values of the mean
 $\unicode[STIX]{x1D706}_{\infty }$
and variance
 $\unicode[STIX]{x1D70E}^{2}$
of the stretching distribution
 $P_{\unicode[STIX]{x1D719}}(\unicode[STIX]{x1D719})$
derived contain small errors (
 ${<}10$
%). In appendix A we derive more accurate values for these parameters (
 $\unicode[STIX]{x1D706}_{\infty }\approx 0.1277$
,
 $\unicode[STIX]{x1D70E}^{2}\approx 0.1237$
), which are used throughout the rest of this study.
4.3 Fluid advection in 3D random networks
The transit time PDF over a pore branch or merger is the same for both elements and is defined by the temporal map
 $\mathscr{T}$
(3.5) in terms of the radial pore coordinate
 $r_{r}^{2}=x_{r}^{2}+y_{r}^{2}$
,
 $$\begin{eqnarray}\displaystyle \unicode[STIX]{x0394}t(r_{r})=\frac{\unicode[STIX]{x0394}t_{a}}{1-r_{r}^{2}}, & & \displaystyle\end{eqnarray}$$
where
 $\unicode[STIX]{x0394}t_{a}$
is the average residence time within the pore element. As
 $r_{r}$
is distributed as
 $P_{r}(r)=2r$
for
 $r\leqslant 1$
, then the transition time is Pareto distributed as
 $$\begin{eqnarray}\displaystyle \unicode[STIX]{x1D713}(\unicode[STIX]{x0394}t)=\frac{1}{\unicode[STIX]{x0394}t_{a}}\left(\frac{\unicode[STIX]{x0394}t}{\unicode[STIX]{x0394}t_{a}}\right)^{-2},\quad \unicode[STIX]{x0394}t\geqslant \unicode[STIX]{x0394}t_{a}. & & \displaystyle\end{eqnarray}$$
It should be noted that the Pareto distribution describes the transition times of non-diffusive material fluid elements over a pore length. Unlike for solute particles, whose transit times are cut off at the diffusion time over the pore cross-section, this is not the case here. For more complex porous media, pore velocities are often found to align according to exponential or stretched exponential distributions (Moroni & Cushman Reference Moroni and Cushman2001; Kang et al. Reference Kang, de Anna, Nunes, Bijeljic, Blunt and Juanes2014; Siena et al. Reference Siena, Riva, Hyman, Winter and Guadagnini2014; Holzner et al. Reference Holzner, Morales, Willmann and Dentz2015). The corresponding transit times show a similar long-time behaviour to (4.18).
5 Stretching CTRW
To quantify pore-scale mixing in terms of the stretching and advection dynamics considered above, we propose to represent the stochastic stretching process as a random walk in the space of time and elongation. As the orientation angles
 $\unicode[STIX]{x1D711}_{s}$
,
 $\unicode[STIX]{x1D711}_{c}$
for the pore branch and merge elements are random, the elongation rates are uncorrelated across successive pores. Hence, the successive material line elongations follow a Markov process defined by (4.9). Similarly, because of the random reorientation, the travel times across successive pores are also weakly correlated (Lester et al.
Reference Lester, Metcalfe and Trefry2013). Hence, both the series of elongations and the travel times follow Markov processes in space. This implies that the deformation of a fluid material element can be modelled as a CTRW, whereby fluid elements undergo a series of punctuated stretching and compression events occurring in random times as they propagate through the pore network. While most CTRW models consider random spatial increments in random times to model spatial transport processes, we develop a stretching CTRW model that considers random elongation events occurring in random times to represent the stochastic stretching process.
The approach we shall employ to model fluid mixing is to consider both the deformation and the advection of an infinitesimal fluid element in the absence of diffusion as random walk processes conditioned upon the transport dynamics derived in the previous section. We then account for molecular diffusion by utilizing the deformation history in the CTRW to solve a local ADE, and the ensemble of such elements informs the evolution of the concentration PDF in the pore space. It should be noted that as the diffusion is fully coupled to the deformation we account explicitly for stretching enhanced diffusion.
The two-step stretching process (4.9) over a couplet provides a natural discretization for a CTRW of fluid deformation, and the temporal map
 $\mathscr{T}$
also quantifies the residence time. For this random walk model we do not need to resolve the particle location in terms of pore-space coordinates
 $(x_{r},y_{r})$
, but rather only consider the distributions of the travel time
 $\unicode[STIX]{x0394}t$
and stretch
 $\unicode[STIX]{x1D70C}_{s},\unicode[STIX]{x1D70C}_{c}$
derived from the relationships in § 4. The resultant two-step CTRW over a couplet is then
 $$\begin{eqnarray}\displaystyle & \unicode[STIX]{x1D6FF}l_{2n+1}=\unicode[STIX]{x1D6FF}l_{2n}\unicode[STIX]{x1D70C}_{s}(\unicode[STIX]{x1D711}_{2n}),\quad t_{2n+1}=t_{2n}+\unicode[STIX]{x0394}t_{2n}, & \displaystyle\end{eqnarray}$$
 $$\begin{eqnarray}\displaystyle & \unicode[STIX]{x1D6FF}l_{2n+2}=\unicode[STIX]{x1D6FF}l_{2n+1}\unicode[STIX]{x1D70C}_{c}(\unicode[STIX]{x1D711}_{2n+1}),\quad t_{2n+2}=t_{2n+1}+\unicode[STIX]{x0394}t_{2n+1}, & \displaystyle\end{eqnarray}$$
 $\unicode[STIX]{x0394}t_{n}$
is distributed as
 $\unicode[STIX]{x1D713}(\unicode[STIX]{x0394}t)$
(4.18), and the random alignment angles
 $\unicode[STIX]{x1D711}_{2n}$
,
 $\unicode[STIX]{x1D711}_{2n+1}$
are uniformly distributed over
 $[-\unicode[STIX]{x03C0},\unicode[STIX]{x03C0}]$
. Thus, the stretching CTRW quantifies the elongation of the length
 $\unicode[STIX]{x1D6FF}l_{n}$
of a material element at subsequent downstream positions
 $z_{n}$
, and the deformation time through the temporal random walk
 $t_{n}$
. For simplicity, we approximate the deformation rates during a stretching or compression transition as being constant. While the multiplicative two-step nature of the CTRW (5.1) does not permit analytic solution, analytic solutions are possible for an equivalent additive one-step CTRW over a couplet in terms of
 $s=\ln \unicode[STIX]{x1D6FF}l$
,
 $$\begin{eqnarray}\displaystyle s_{2n+2}=s_{2n}+\unicode[STIX]{x1D719}_{2n},\quad t_{n+2}=t_{2n}+\unicode[STIX]{x0394}t_{2n}+\unicode[STIX]{x0394}t_{2n+1}. & & \displaystyle\end{eqnarray}$$
It should be noted that the fluid stretching for this one-step CTRW is not uniform over a couplet, but rather is oscillatory due to stretching and compression over a pore branch or merger respectively. While such oscillations do not impact the overall stretching rate
 $\unicode[STIX]{x1D706}_{\infty }$
, such oscillatory stretching may generate a significant diffusive signature over the couplet. We shall return to this issue in § 6 where we develop a pore-scale mixing model based upon this one-step CTRW (5.2).
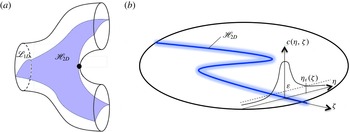
(a) Schematic of the lamella formed by the 2D material sheet
 $\mathscr{H}_{2D}$
arising from continuous injection of a 1D material line in the inlet plane (b). The lamella
 $\mathscr{H}_{2D}$
(solid blue line) forms the backbone of the diffusive concentration field
 $c(\boldsymbol{x})$
(blurred blue region), shown here intersecting a pore outlet in the
 $xy$
plane, injected along the same material line in the inlet plane, resulting in a Gaussian concentration distribution transverse to
 $\mathscr{H}_{2D}$
. Here,
 $(\unicode[STIX]{x1D702},\unicode[STIX]{x1D701})$
are the material coordinates normal and tangential to
 $\mathscr{H}_{2D}$
in the
 $xy$
plane.

6 Scalar mixing and fluid stretching CTRW
To model pore-scale solute mixing we employ a 1D lamellar mixing model (Ranz Reference Ranz1979; Duplat & Villermaux Reference Duplat and Villermaux2008; Le Borgne et al. Reference Le Borgne, Dentz and Villermaux2015), where fluid stretching is quantified by the CTRW model developed in § 5. Due to exponential fluid stretching, an evolving concentration field conforms to a highly striated lamellar structure, where these lamellae align with the dominant stretching direction(s) of the flow and are simultaneously stretched longitudinally and compressed transversely.
The continuous injection of a 1D material line
 $\mathscr{L}_{1D}$
of length
 $l_{0}$
across a single pore of the inlet plane (
 $z=n=0$
) of the 3D network forms a continuous 2D material sheet
 $\mathscr{H}_{2D}$
shown in figure 5(a) which propagates throughout the pore space of the network and branches into multiple pores. We denote this 2D material sheet
 $\mathscr{H}_{2D}$
as a single lamella, and define the material coordinates
 $\{\unicode[STIX]{x1D702},\unicode[STIX]{x1D701}\}$
in the
 $xy$
plane, where
 $\unicode[STIX]{x1D701}$
is the coordinate along the lamella and
 $\unicode[STIX]{x1D702}$
is the transverse coordinate. We consider the steady concentration field
 $c(\boldsymbol{x})=c(\unicode[STIX]{x1D702},\unicode[STIX]{x1D701},z)$
which arises from the continuous injection of a concentration strip along the 1D material line
 $\mathscr{L}_{1D}$
with a Gaussian transverse profile
 $$\begin{eqnarray}\displaystyle c(\unicode[STIX]{x1D702},\unicode[STIX]{x1D701},0)=\frac{c_{0}}{\sqrt{2\unicode[STIX]{x03C0}\unicode[STIX]{x1D70E}_{0}^{2}}}\exp \left(-\frac{\unicode[STIX]{x1D702}^{2}}{2\unicode[STIX]{x1D70E}_{0}^{2}}\right), & & \displaystyle\end{eqnarray}$$
with maximum initial concentration
 $c_{m}(0)=c_{0}/\sqrt{2\unicode[STIX]{x03C0}\unicode[STIX]{x1D70E}_{0}^{2}}$
and variance
 $\unicode[STIX]{x1D70E}_{0}^{2}$
. As shown in figure 5(b), the lamella
 $\mathscr{H}_{2D}$
then forms the ridge of the 3D solute concentration field
 $c(\boldsymbol{x})$
throughout the pore network, and the concentration transverse to
 $\mathscr{H}_{2D}$
follows a Gaussian profile. For simplicity of exposition we consider a uniform solute injection applied at the inlet plane
 $z=0$
across the entire network. This means that we assume the same ‘initial’ concentration profile (6.1) across the lamellae in all pores located at the inlet plane at
 $z=0$
. Thus, the composition of the concentration field does not depend on the position transverse to the mean flow direction and only depends on the longitudinal distance
 $z$
. We shall extend these results in § 7 to the case of a heterogeneous solute injection across the inlet plane.
The macroscopically homogeneous initial condition described above results in an ensemble of 2D lamellae
 $\mathscr{H}_{2D}$
which are homogeneously distributed throughout the pore network. Hence, lamella segments from different inlet pores may coexist within a single pore, and the spacing between lamella segments decays in the longitudinal direction as the exponential stretching rate; however, these segments never overlap due to their invariant nature. Conversely, the associated 3D concentration field
 $c(\boldsymbol{x})$
has finite width and so will eventually overlap and coalesce. While a pore may contain segments of different lamellae, this redistribution of lamellar segments between pores does not impact the concentration distribution at a statistical level due to the homogeneous inlet condition described above. Hence, the statistical concentration distribution is the same across all pores for fixed
 $n$
and we do not need to resolve the redistribution of lamellar segments across pores. This homogeneous inlet condition greatly simplifies the exposition of the method, but in principle may be extended to inhomogeneous inlet conditions by explicitly tracking this redistribution, facilitating solution of both the evolving pore-scale and the macroscopic concentration distributions throughout the network.
The steady 3D concentration field
 $c(\boldsymbol{x})$
in the network is governed by the steady ADE
 $$\begin{eqnarray}\displaystyle -\boldsymbol{v}(\boldsymbol{x})\boldsymbol{\cdot }\unicode[STIX]{x1D735}c(\boldsymbol{x})+D_{m}\unicode[STIX]{x1D6FB}^{2}c(\boldsymbol{x})=0,\quad \unicode[STIX]{x1D735}c(\boldsymbol{x})\boldsymbol{\cdot }\boldsymbol{n}|_{\unicode[STIX]{x2202}\mathscr{D}}=0, & & \displaystyle\end{eqnarray}$$
where
 $D_{m}$
is the molecular diffusivity and
 $\boldsymbol{n}$
is the outward normal from the boundary
 $\unicode[STIX]{x2202}\mathscr{D}$
. Under the assumption that the spatial concentration gradients are small in the
 $z$
direction, we ignore longitudinal diffusion and pose the steady 3D ADE (6.2) as an equivalent unsteady 2D ADE in the
 $xy$
plane,
 $$\begin{eqnarray}\displaystyle \frac{\unicode[STIX]{x2202}c}{\unicode[STIX]{x2202}t}=v_{z}\frac{\unicode[STIX]{x2202}c}{\unicode[STIX]{x2202}z}=-\boldsymbol{v}_{\bot }(x,y,t)\boldsymbol{\cdot }\unicode[STIX]{x1D735}_{\bot }c(x,y,t)+D_{m}\unicode[STIX]{x1D6FB}_{\bot }^{2}c(x,y,t), & & \displaystyle\end{eqnarray}$$
where
 $v_{z}$
is the
 $z$
component of
 $\boldsymbol{v}(\boldsymbol{x})$
and
 $\bot$
denotes the
 $xy$
components. The
 $z$
coordinate is also parameterized in terms of the Lagrangian travel time
 $t=t(z)$
along a fluid particle trajectory as
 $$\begin{eqnarray}\displaystyle t(z)=\int _{0}^{z}\text{d}z^{\prime }\frac{1}{v_{z}(z^{\prime })}. & & \displaystyle\end{eqnarray}$$
The lamellar mixing model is based upon posing (6.3) in terms of the material coordinates
 $\{\unicode[STIX]{x1D702},\unicode[STIX]{x1D701}\}$
in the
 $xy$
plane; hence,
 $c(x,y,t)\mapsto c(\unicode[STIX]{x1D702},\unicode[STIX]{x1D701},t)$
. Under exponential fluid stretching, concentration gradients along the lamella (
 $\unicode[STIX]{x2202}_{\unicode[STIX]{x1D701}}$
) decay exponentially while the gradients normal to the lamella (
 $\unicode[STIX]{x2202}_{\unicode[STIX]{x1D702}}$
) are maintained; thus, level sets of the concentration field identify with the lamella. This alignment occurs regardless of the inlet condition, and so the lamellar approach is quite generic. Under these conditions the ADE (6.3) simplifies to the 1D lamellar transport (Ranz Reference Ranz1979; Duplat & Villermaux Reference Duplat and Villermaux2008; Villermaux Reference Villermaux2012; Le Borgne et al.
Reference Le Borgne, Dentz and Villermaux2013)
 $$\begin{eqnarray}\displaystyle \frac{\unicode[STIX]{x2202}}{\unicode[STIX]{x2202}t}c(\unicode[STIX]{x1D702},\unicode[STIX]{x1D701},t)=\unicode[STIX]{x1D6FE}(t,\unicode[STIX]{x1D701})\unicode[STIX]{x1D702}\frac{\unicode[STIX]{x2202}}{\unicode[STIX]{x2202}\unicode[STIX]{x1D702}}c(\unicode[STIX]{x1D702},\unicode[STIX]{x1D701},t)+D_{m}\frac{\unicode[STIX]{x2202}^{2}}{\unicode[STIX]{x2202}\unicode[STIX]{x1D702}^{2}}c(\unicode[STIX]{x1D702},\unicode[STIX]{x1D701},t), & & \displaystyle\end{eqnarray}$$
where the stretching rate
 $\unicode[STIX]{x1D6FE}(t,\unicode[STIX]{x1D701})\equiv \unicode[STIX]{x2202}_{\unicode[STIX]{x1D701}}v_{\unicode[STIX]{x1D701}}=-\unicode[STIX]{x2202}_{\unicode[STIX]{x1D702}}v_{\unicode[STIX]{x1D702}}$
arises from a first-order expansion of the
 $\unicode[STIX]{x1D702}$
component of the velocity field, and the stretching rate
 $\unicode[STIX]{x1D6FE}(t,\unicode[STIX]{x1D701})$
can be expressed in terms of the lamella elongation in the
 $xy$
plane
 $l(t,\unicode[STIX]{x1D701})$
as
 $$\begin{eqnarray}\displaystyle \unicode[STIX]{x1D6FE}(t,\unicode[STIX]{x1D701})\equiv \frac{\unicode[STIX]{x2202}v_{\unicode[STIX]{x1D701}}}{\unicode[STIX]{x2202}\unicode[STIX]{x1D701}}=\frac{\text{d}\ln l(t,\unicode[STIX]{x1D701})}{\text{d}t}. & & \displaystyle\end{eqnarray}$$
It should be noted that the 1D nature of (6.5) renders it only valid up to the coalescence of lamellae in the pore space. While methods (Duplat & Villermaux Reference Duplat and Villermaux2008; Villermaux Reference Villermaux2012; Le Borgne et al. Reference Le Borgne, Dentz and Villermaux2013) exist to extend beyond coalescence and are readily applicable to this problem, they are beyond the scope of the present study.
Due to negligible transport in the
 $\unicode[STIX]{x1D701}$
direction, equation (6.5) can be posed with respect to a single fluid element trajectory within the lamella, and describes the evolution of the associated transverse concentration
 $c(\unicode[STIX]{x1D702},t)$
profile as
 $$\begin{eqnarray}\displaystyle \frac{\unicode[STIX]{x2202}}{\unicode[STIX]{x2202}t}c(\unicode[STIX]{x1D702},t)=\unicode[STIX]{x1D6FE}(t)\unicode[STIX]{x1D702}\frac{\unicode[STIX]{x2202}}{\unicode[STIX]{x2202}\unicode[STIX]{x1D702}}c(\unicode[STIX]{x1D702},t)+D_{m}\frac{\unicode[STIX]{x2202}^{2}}{\unicode[STIX]{x2202}\unicode[STIX]{x1D702}^{2}}c(\unicode[STIX]{x1D702},t). & & \displaystyle\end{eqnarray}$$
This particle-based description of fluid mixing is compatible with the CTRW stretching model. As such, we do not seek to directly solve the evolution of an entire lamella, but rather solve the evolving concentration profile
 $c(\unicode[STIX]{x1D702},t_{n})$
over a representative ensemble of points, which recovers the same statistics of the ensemble of all lamellae in the pore space due to ergodicity.
If we consider fluid advection and stretching as stochastic processes, then for given
 $z_{n}$
or
 $n$
the advection time
 $t_{n}=t(z_{n})$
is distributed randomly according to the waiting time distribution (4.18). Hence,
 $c(\unicode[STIX]{x1D702},t_{n})$
is a random variable through its dependence on both the random advection time
 $t_{n}$
and the random deformation
 $\unicode[STIX]{x1D6FE}_{n}=\unicode[STIX]{x1D6FE}(t_{n})$
. Under the assumption of independent lamellae, the PDF of concentration at a cross-section at
 $z_{n}$
is obtained by (i) sampling the concentration values across the lamella and (ii) sampling between the lamellae. This interpretation allows the lamellar mixing (6.7) to describe the evolution of the transverse concentration profile with the advection time and stretching history of any part of any lamella in the entire 3D porous network.
We non-dimensionalize (6.7) by introducing the variables
 $c^{\prime }=c/c_{m}(0)$
,
 $t^{\prime }=t/\unicode[STIX]{x0394}t_{a}$
,
 $\unicode[STIX]{x1D702}^{\prime }=\unicode[STIX]{x1D702}/(\sqrt{2}\unicode[STIX]{x1D70E}_{0})$
, with the characteristic advection time
 $\unicode[STIX]{x0394}t_{a}=\ell /v_{0}$
, where
 $\ell$
is the length of a pore and
 $v_{0}$
is the mean pore velocity. We also define the Péclet number as
 $Pe=\unicode[STIX]{x1D70E}_{0}^{2}v_{0}/(2D_{m}\ell )$
, and henceforth drop the primes for simplicity of notation. Under these scalings (6.7) is non-dimensionalized, with
 $D_{m}$
now replaced by
 $1/Pe$
, and the initial condition (6.1) is now
 $c(\unicode[STIX]{x1D702},0)=\exp (-\unicode[STIX]{x1D702}^{2})$
. To solve (6.7), following Ranz (Reference Ranz1979) we define the reduced coordinate
 $\unicode[STIX]{x1D702}_{0}$
and operational time
 $\unicode[STIX]{x1D70F}(t)$
respectively as
 $$\begin{eqnarray}\displaystyle \unicode[STIX]{x1D702}_{0}(t)=\unicode[STIX]{x1D702}\unicode[STIX]{x1D70C}(t),\quad \unicode[STIX]{x1D70F}(t)=\int _{0}^{t}\text{d}t^{\prime }\unicode[STIX]{x1D70C}(t^{\prime })^{2}, & & \displaystyle\end{eqnarray}$$
where the solution
 $c(\unicode[STIX]{x1D702},t)=g[\unicode[STIX]{x1D702}_{0}(t),\unicode[STIX]{x1D70F}(t)]$
is equivalent to a transformation into the characteristic system of (6.7). Making this substitution, equation (6.7) simplifies to the diffusion equation
 $$\begin{eqnarray}\displaystyle \frac{\unicode[STIX]{x2202}g(\unicode[STIX]{x1D702}_{0},\unicode[STIX]{x1D70F})}{\unicode[STIX]{x2202}\unicode[STIX]{x1D70F}}=Pe\frac{\unicode[STIX]{x2202}^{2}g(\unicode[STIX]{x1D702}_{0},\unicode[STIX]{x1D70F})}{\unicode[STIX]{x2202}\unicode[STIX]{x1D702}_{0}^{2}}, & & \displaystyle\end{eqnarray}$$
with initial condition
 $g(\unicode[STIX]{x1D702}_{0},0)=\exp (-\unicode[STIX]{x1D702}_{0}^{2})$
. Hence, the concentration profile
 $c(\unicode[STIX]{x1D702},t)=g[\unicode[STIX]{x1D702}_{0}(t),\unicode[STIX]{x1D70F}(t)]$
across the strip is given by the Gaussian distribution
 $$\begin{eqnarray}\displaystyle c(\unicode[STIX]{x1D702},t)=\frac{1}{\sqrt{1+\displaystyle \frac{\unicode[STIX]{x1D70F}(t)}{Pe}}}\exp \left(-\frac{\unicode[STIX]{x1D702}^{2}\unicode[STIX]{x1D70C}(t)^{2}}{1+\displaystyle \frac{\unicode[STIX]{x1D70F}(t)}{Pe}}\right), & & \displaystyle\end{eqnarray}$$
and so the concentration profile is determined by the total stretch
 $\unicode[STIX]{x1D70C}(t)$
which acts to narrow lamellae, and the stretching history
 $\unicode[STIX]{x1D70F}(t)$
which broadens and dilutes the lamellae. As
 $\unicode[STIX]{x1D70F}(t)$
depends upon the stretching history, stretching oscillations in the two-step process (5.1) over a couplet are captured by
 $\unicode[STIX]{x1D70F}(t)$
, and so must be accounted for if significant. From (6.10) the maximum concentration
 $c_{m}(t)=c(0,t)$
is now
 $$\begin{eqnarray}\displaystyle c_{m}(t)=\frac{1}{\sqrt{1+\displaystyle \frac{\unicode[STIX]{x1D70F}(t)}{Pe}}}. & & \displaystyle\end{eqnarray}$$
Equations (6.8)–(6.11) show that the pore-space mixing explicitly depends upon
 $Pe$
and the stretching history
 $\unicode[STIX]{x1D70C}(t)$
which is used to encode the operational time
 $\unicode[STIX]{x1D70F}(t)$
. The fluid deformation CTRW model developed in § 4 yields expression (4.16) for the PDF of
 $\unicode[STIX]{x1D70C}(t_{n})$
, and so this must be extended to generate analytic expressions for the PDF of
 $\unicode[STIX]{x1D70F}(t_{n})$
, the concentration PDF and associated measures.
Equations (6.8)–(6.11) also form the basis of the diffusive strip method (Meunier & Villermaux Reference Meunier and Villermaux2010) which facilitates efficient numerical solution of the 1D lamellar ADE (6.7) across a broad range of
 $Pe$
. To test the accuracy of the analytic solutions for the concentration PDF described above, we employ this method in conjunction with the advective
 $\mathscr{M}$
and temporal
 $\mathscr{T}$
maps to simulate deformation of a 2D material filament within the 3D pore space. The diffusion is calculated as a post-processing step for various
 $Pe$
via (6.10) given computation of
 $\unicode[STIX]{x1D70C}$
and
 $\unicode[STIX]{x1D70F}$
along the strip from the stretching history. This method is capable of accurately capturing the stretching, diffusion and coalescence of the scalar field up to
 $n\sim 100$
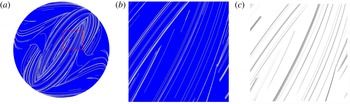
pores, beyond which the exponential growth of the lamellar structure is too large for feasible computation. Figure 6 shows a typical distribution of the operational time
 $\ln \unicode[STIX]{x1D70F}$
over the cross-section of a pore at
 $n=40$
using this method, as well as the concentration distribution
 $c(\boldsymbol{x},t_{n})$
calculated at
 $Pe=10^{8}$
.
(a) Typical distribution of the logarithm of the operational time
 $\ln \unicode[STIX]{x1D70F}$
(black,
 $\ln \unicode[STIX]{x1D70F}=50$
; white,
 $\ln \unicode[STIX]{x1D70F}=5$
) representing the backbone of the lamellar concentration field, with detail (dashed box) shown in (b). The associated scalar field
 $c(\boldsymbol{x})$
for
 $Pe=10^{8}$
shown in (c) is calculated via the diffusive strip method (Meunier & Villermaux Reference Meunier and Villermaux2010).

In order to obtain a closed-form expression for the PDF of
 $\unicode[STIX]{x1D70F}(t_{n})$
from the CTRW model, we approximate the evolution of
 $\unicode[STIX]{x1D70C}(t)$
between
 $t=0$
and
 $t=t_{n}$
as a constant exponential stretching process,
 $$\begin{eqnarray}\displaystyle \unicode[STIX]{x1D70C}(t)\approx \exp (\unicode[STIX]{x1D6E4}_{n}t), & & \displaystyle\end{eqnarray}$$
in terms of the average stretching rate
 $\unicode[STIX]{x1D6E4}_{n}=\ln (\unicode[STIX]{x1D70C}_{n})/t_{n}$
after
 $n$
steps. From (6.12), the operational time
 $\unicode[STIX]{x1D70F}(t_{n})$
is then approximated as
 $$\begin{eqnarray}\displaystyle \unicode[STIX]{x1D70F}_{n}\equiv \unicode[STIX]{x1D70F}(t_{n})\approx \frac{t_{n}\unicode[STIX]{x1D70C}_{n}^{2}}{2\ln (\unicode[STIX]{x1D70C}_{n})}. & & \displaystyle\end{eqnarray}$$
This expression can be further simplified by noticing that the PDF (4.16) of
 $\ln (\unicode[STIX]{x1D70C}_{n})$
is Gaussian, with mean
 $n\unicode[STIX]{x1D6EC}_{\infty }/2$
and variance
 $n\unicode[STIX]{x1D70E}^{2}/2$
. Thus, we may approximate the denominator in (6.13) by its mean value
 $\ln (\unicode[STIX]{x1D70C}_{n})\approx n\unicode[STIX]{x1D6EC}_{\infty }/2$
,
 $$\begin{eqnarray}\displaystyle \unicode[STIX]{x1D70F}_{n}\approx \frac{t_{n}\unicode[STIX]{x1D70C}_{n}^{2}}{n\unicode[STIX]{x1D6EC}_{\infty }}, & & \displaystyle\end{eqnarray}$$
the accuracy of which is shown in figure 7(a). In essence, equation (6.14) solves the pore-scale fluid mixing, involving exponential growth of
 $\unicode[STIX]{x1D70F}_{n}$
with
 $n$
. Oscillations associated with the two-step stretching process (5.1) appear to play a minor role as
 $\unicode[STIX]{x1D70F}_{n}$
is well approximated by the one-step stretching process (5.2) characterized in terms of the mean stretching rate
 $\unicode[STIX]{x1D6EC}_{\infty }$
, as reflected by figure 7(a). Thus, while in principle the diffusion is dependent upon the entire stretching history, it is predominantly governed by the arrival time
 $t_{n}$
of the material strip at position
 $z_{n}$
and the elongation
 $\unicode[STIX]{x1D70C}_{n}$
. The travel time distribution over a single pore is given by the Pareto distribution (4.18). The distribution of the arrival times
 $t_{n}$
is given by the self-convolution of the Pareto distribution, which results in a Landau distribution. In appendix B we show explicitly that the bulk of the Landau distribution can be well approximated by the Moyal distribution.
(a) Comparison of direct computation (black) and analytic approximation (6.14) (blue) for operational time
 $\unicode[STIX]{x1D70F}_{n}$
with pore number
 $n$
over four different realizations of the CTRW model. (b) Comparison of the PDF of
 $\ln \unicode[STIX]{x1D70F}$
based upon the analytic approximation (6.16) (solid lines), the PDF of
 $\ln \unicode[STIX]{x1D70F}$
from the CTRW model for (circles)
 $n=20$
, (pentagons)
 $n=40$
, (diamonds)
 $n=60$
, (squares)
 $n=80$
and (triangles)
 $n=160$
.

The PDF of
 $\ln (\unicode[STIX]{x1D70F}_{n})=\ln (t_{n})+2\ln (\unicode[STIX]{x1D70C}_{n})-\ln (n\unicode[STIX]{x1D6EC}_{\infty })$
is well approximated by replacing
 $\ln (t_{n})$
with its average,
 $$\begin{eqnarray}\displaystyle \langle \ln t_{n}\rangle \approx \ln \left[\frac{n}{a}(\ln 2+\unicode[STIX]{x1D6FE}+b)+n(\ln n+1-\unicode[STIX]{x1D6FE})\right], & & \displaystyle\end{eqnarray}$$
where
 $\unicode[STIX]{x1D6FE}$
is the Euler–Mascheroni constant,
 $a=0.7413$
and
 $b=0.0064$
(appendix B). Due to the central limit theorem,
 $\ln (\unicode[STIX]{x1D70C}_{n})$
converges with
 $n$
towards the Gaussian distribution (4.16) with the mean
 $n\unicode[STIX]{x1D6EC}_{\infty }/2$
and variance
 $n\unicode[STIX]{x1D70E}^{2}/2$
, and so the PDF of
 $\unicode[STIX]{x1D709}_{n}:=\ln (\unicode[STIX]{x1D70F}_{n})$
also converges with
 $n$
towards the Gaussian distribution
 $$\begin{eqnarray}\displaystyle p_{\ln \unicode[STIX]{x1D70F}}(\unicode[STIX]{x1D709},n)=\frac{\exp \left(-\displaystyle \frac{[\unicode[STIX]{x1D709}-\unicode[STIX]{x1D707}_{\ln \unicode[STIX]{x1D70F}}(n)]^{2}}{2\unicode[STIX]{x1D70E}\ln \unicode[STIX]{x1D70F}^{2}(n)}\right)}{\sqrt{2\unicode[STIX]{x03C0}\unicode[STIX]{x1D70E}_{\ln \unicode[STIX]{x1D70F}}^{2}(n)}}, & & \displaystyle\end{eqnarray}$$
with mean and variance
 $$\begin{eqnarray}\displaystyle \unicode[STIX]{x1D707}_{\ln \unicode[STIX]{x1D70F}}(n)=\langle \ln (t_{n})\rangle +n\unicode[STIX]{x1D6EC}_{\infty }-\ln (n\unicode[STIX]{x1D6EC}_{\infty }),\quad \unicode[STIX]{x1D70E}_{\ln \unicode[STIX]{x1D70F}}^{2}(n)=2n\unicode[STIX]{x1D70E}^{2}. & & \displaystyle\end{eqnarray}$$
Figure 7(b) shows that for
 $\unicode[STIX]{x1D70F}>10^{3}$
the approximation (6.16) exhibits very good agreement with the PDF of
 $\unicode[STIX]{x1D709}_{n}$
obtained from evaluating
 $\unicode[STIX]{x1D70F}(t_{n})$
according to (6.8) with
 $\unicode[STIX]{x1D70C}(t_{n})$
given by the CTRW (5.1). The mismatch at short times is expected due to the asymptotic nature of the central limit theorem.
7 Chaotic mixing in 3D random porous media
The approximation (6.16) for
 $\unicode[STIX]{x1D70F}_{n}$
provides an accurate solution to the two-step CTRW (5.1), which along with the distribution (4.16) for
 $\unicode[STIX]{x1D70C}_{n}$
quantifies the evolution of the concentration distribution, mixing and dilution in the 3D open porous network prior to the onset of coalescence. In the following we apply this solution to determine the evolution of the mixing scale, concentration PDF, maximum concentration, scalar variance and the onset of coalescence in the 3D random porous network.
7.1 Mixing scale and onset of coalescence
The mixing scale
 $\unicode[STIX]{x1D716}_{m}$
characterizes the distribution of lamella widths at
 $z_{n}=n$
as
 $$\begin{eqnarray}\displaystyle \unicode[STIX]{x1D716}_{m}(n)=\frac{\displaystyle \int _{-\infty }^{\infty }\text{d}\unicode[STIX]{x1D702}|\unicode[STIX]{x1D702}|c(\unicode[STIX]{x1D702},t_{n})}{\displaystyle \int _{-\infty }^{\infty }\text{d}\unicode[STIX]{x1D702}c(\unicode[STIX]{x1D702},t_{n})}=\frac{\sqrt{(1+\unicode[STIX]{x1D70F}_{n}/Pe)}}{\unicode[STIX]{x03C0}\unicode[STIX]{x1D70C}_{n}}, & & \displaystyle\end{eqnarray}$$
the average of which is well approximated by substitution of (6.14) for
 $\unicode[STIX]{x1D70F}_{n}$
for the Landau distribution as outlined in appendix B,
 $$\begin{eqnarray}\displaystyle \langle \unicode[STIX]{x1D716}_{m}(n)\rangle \approx \left\langle \sqrt{\frac{\langle t_{n}\rangle +Pe\unicode[STIX]{x1D70C}_{n}^{-2}}{\unicode[STIX]{x03C0}nPe\unicode[STIX]{x1D6EC}_{\infty }}}\right\rangle . & & \displaystyle\end{eqnarray}$$
It should be noted that while
 $\langle t_{n}\rangle$
is strictly infinite, the above average is dominated by the bulk of
 $p_{n}(t)$
, which, as outlined in appendix B, can be well approximated by the Moyal distribution. In order to perform the average over
 $\unicode[STIX]{x1D70C}_{n}$
, we use Laplace’s method (Erdélyi Reference Erdélyi1956) to evaluate the corresponding integral, which yields
 $$\begin{eqnarray}\displaystyle \langle \unicode[STIX]{x1D716}_{m}(n)\rangle \approx \sqrt{\frac{\ln n}{\unicode[STIX]{x03C0}Pe\unicode[STIX]{x1D6EC}_{\infty }}}\sqrt{1+\frac{\ln 2+\unicode[STIX]{x1D6FE}+b}{a\ln n}+\frac{1-\unicode[STIX]{x1D6FE}}{\ln n}+\frac{Pe\exp (-\unicode[STIX]{x1D6EC}_{\infty }n)}{n\ln n}}. & & \displaystyle\end{eqnarray}$$
This is a remarkable result because although fluid elements grow exponentially with the longitudinal pore number
 $n$
, the mixing scale
 $\unicode[STIX]{x1D716}_{m}$
does not converge to a constant Batchelor scale with i
 $n$
, but, as shown in figure 8, rather
 $\unicode[STIX]{x1D716}_{m}$
reaches a minimum at
 $$\begin{eqnarray}\displaystyle n_{c}\approx \frac{\ln (Pe\unicode[STIX]{x1D6EC}_{\infty })}{\unicode[STIX]{x1D6EC}_{\infty }}, & & \displaystyle\end{eqnarray}$$
and then increases asymptotically as
 $\langle \unicode[STIX]{x1D716}_{m}(n)\rangle \approx \sqrt{\ln n/(\unicode[STIX]{x03C0}Pe\unicode[STIX]{x1D6EC}_{\infty })}$
. This non-monotonic behaviour is driven by the broad distribution of arrival times between the couplets arising from the no-slip condition, which renders a distribution of stretching rates of variable strength. It should be noted that the characteristic waiting time between stretching events increases with the number of couplets, and thus the stretching rate decreases. This is a characteristic of the Pareto transit time distribution. As such, we identify transport in the region
 $n\leqslant n_{c}$
as advection-dominated, where compression of concentration filaments dominates due to stretching of lamellae, whereas for
 $n>n_{c}$
transport is diffusion-dominated, leading to diffusive spreading of the concentration profile transverse to lamellae. It should be noted that these results apply even if concentration filaments have not yet coalesced.
(a) Evolution of the average mixing scale (7.3) with
 $n$
for (dash-dotted)
 $Pe=10^{4}$
, (dashed)
 $Pe=10^{6}$
and (solid)
 $Pe=10^{8}$
. (b) The PDF (7.6) of
 $\ln c_{m}$
at downstream positions of (solid)
 $n=20$
, (dash-dotted)
 $n=40$
, (long dashed)
 $n=60$
and (short dashed)
 $n=80$
for
 $Pe=10^{8}$
.

While such prediction is beyond the scope of this study, it is important to determine the onset of coalescence and hence the envelope of validity of the model. The onset of coalescence occurs when the mixing scale
 $\langle \unicode[STIX]{x1D716}_{m}(n)\rangle$
exceeds the average spacing
 $\unicode[STIX]{x1D716}(n)=\unicode[STIX]{x03C0}R^{2}/l(n)$
between lamellae of length
 $l(n)=l_{0}\exp (\unicode[STIX]{x1D706}_{\infty }n)$
with an initial length
 $l_{0}$
in pores of average radius
 $R$
. From (7.3), the lamellae are non-interacting up to pore number
 $$\begin{eqnarray}\displaystyle n+\frac{1}{2\unicode[STIX]{x1D706}_{\infty }}\ln \ln n\leqslant \frac{1}{\unicode[STIX]{x1D706}_{\infty }}\ln \left(\frac{\unicode[STIX]{x03C0}R^{2}}{l_{0}\unicode[STIX]{x1D70E}_{0}}\sqrt{\frac{\unicode[STIX]{x03C0}Pe\unicode[STIX]{x1D6EC}_{\infty }}{2}}\right), & & \displaystyle\end{eqnarray}$$
where the linear contribution on the left-hand side of (7.5) is due to exponential stretching of the lamellae, and the weaker nonlinear term is due to evolution of the mixing scale
 $\langle \unicode[STIX]{x1D716}_{m}(n)\rangle$
.
Evolution of the average maximum concentration with
 $n$
for (dash-dotted)
 $Pe=10^{4}$
, (dashed)
 $Pe=10^{6}$
and (solid)
 $Pe=10^{8}$
in (a) linear and (b) log–log axes. In (b) the thin lines indicate the 3D pore mixing model and the thick lines the 2D pore mixing model (7.8)–(7.9) with
 $\unicode[STIX]{x1D6FC}=1$
and
 $\unicode[STIX]{x1D6FD}=1/5$
. The inset illustrates the same plot in a semilogarithmic scale.

7.2 The PDF of maximum concentration
The dimensionless maximum concentration
 $c_{m}(t)$
as a function of pore number
 $n$
,
 $c_{m}(n)=c_{m}(t_{n})$
, is given by (6.11). In order to develop an analytic expression for the PDF of
 $c_{m}(n)=c_{m}(t_{n})$
, we express (6.11) as a function of
 $\unicode[STIX]{x1D709}_{n}=\ln (\unicode[STIX]{x1D70F}_{n})$
, which is distributed according to (6.16) as
 $\unicode[STIX]{x1D709}_{n}=\ln (Pe[c_{m}(n)^{-2}-1])$
. Hence, the PDF of
 $\unicode[STIX]{x1D701}_{n}=\ln c_{m}(n)$
is
 $$\begin{eqnarray}\displaystyle p_{\ln c_{m}}(\unicode[STIX]{x1D701},n)=\frac{2}{1-\exp (2\unicode[STIX]{x1D701})}p_{\ln \unicode[STIX]{x1D70F}}[\ln (Pe[\exp (-2\unicode[STIX]{x1D701})-1])]. & & \displaystyle\end{eqnarray}$$
For
 $|\unicode[STIX]{x1D701}|\gg 1$
the PDF of
 $\unicode[STIX]{x1D701}$
is well approximated by a Gaussian distribution, as per figure 8(b) which shows the PDF of
 $\ln c_{m}$
for
 $Pe=10^{8}$
. For small
 $n\leqslant 40$
, the PDF is sharply peaked about the initial concentration
 $c_{m}=1$
, but for
 $n>40$
a peak starts forming away from
 $c_{m}=1$
and the bulk of the probability weight moves away from this initial concentration. This behaviour is reflected by the evolution of the mixing scale with
 $n$
, which assumes its minimum at
 $n_{c}$
(7.4), which for the
 $Pe=10^{8}$
chosen here is
 $n_{c}\approx 70$
. Thus, once the mixing scale assumes its minimum value, the dilution increases markedly due to increased diffusive mass transfer. The average maximum concentration
 $\langle c_{m}(n)\rangle$
shown in figure 9 evolves in a similar manner; in the advection-dominated regime (
 $n<n_{c}$
)
 $\langle c_{m}(n)\rangle$
is essentially equal to the initial concentration of
 $1$
, whereas in the diffusion-dominated regime
 $n\gg n_{c}$
, it decays exponentially rapidly according to
 $$\begin{eqnarray}\displaystyle \langle c_{m}(n)\rangle \approx \exp \left[\frac{\unicode[STIX]{x1D70E}_{\ln \unicode[STIX]{x1D70F}}^{2}(n)}{8}-\frac{\unicode[STIX]{x1D707}_{\ln \unicode[STIX]{x1D70F}}(n)-\ln Pe}{2}\right], & & \displaystyle\end{eqnarray}$$
where
 $\unicode[STIX]{x1D707}_{\ln \unicode[STIX]{x1D70F}}$
and
 $\unicode[STIX]{x1D70E}_{\ln \unicode[STIX]{x1D70F}}^{2}$
are given by (6.17). Hence, once the diffusion-dominated regime (
 $n\gg n_{c}$
) is reached, exponential fluid stretching due to chaotic advection in 3D porous media generates exponential dilution. Chaotic advection exponentially increases concentration gradients and so effectively shortens the advection-dominated regime, as reflected by (7.4) which shows that
 $n_{c}$
decreases with increasing Lyapunov exponent
 $\unicode[STIX]{x1D706}_{\infty }$
.
In contrast, fluid deformation in 2D porous media is limited to algebraic stretching. In such media Dentz et al. (Reference Dentz, Le Borgne, Lester and de Barros2015) and Le Borgne et al. (Reference Le Borgne, Dentz and Villermaux2015) find that the mean and variance of
 $\ln \unicode[STIX]{x1D70C}$
reflect such algebraic stretching,
 $$\begin{eqnarray}\displaystyle \unicode[STIX]{x1D707}_{\ln \unicode[STIX]{x1D70C},2D}(n)=\unicode[STIX]{x1D6FC}\ln (n+1)+\unicode[STIX]{x1D70E}_{\ln \unicode[STIX]{x1D70C},2D}^{2}(n),\quad \unicode[STIX]{x1D70E}_{\ln \unicode[STIX]{x1D70C},2D}^{2}(n)=\unicode[STIX]{x1D6FD}\ln (n+1), & & \displaystyle\end{eqnarray}$$
where
 $\unicode[STIX]{x1D6FC},\unicode[STIX]{x1D6FD}\in [1/2,2]$
. As the derivation leading to (6.16) also holds for algebraic deformation, the mean and variance of the Gaussian
 $\ln \unicode[STIX]{x1D70F}_{n}$
PDF in 2D porous media are
 $$\begin{eqnarray}\displaystyle \unicode[STIX]{x1D707}_{\ln \unicode[STIX]{x1D70F},2D}(n)=\langle \ln t_{n}\rangle +2\unicode[STIX]{x1D707}_{\ln \unicode[STIX]{x1D70C},2D}(n)-\ln [2\unicode[STIX]{x1D707}_{\ln \unicode[STIX]{x1D70C},2D}(n)],\quad \unicode[STIX]{x1D70E}_{\ln \unicode[STIX]{x1D70F},2D}^{2}(n)=4\unicode[STIX]{x1D70E}_{\ln \unicode[STIX]{x1D70C},2D}^{2}(n), & & \displaystyle \nonumber\\ \displaystyle & & \displaystyle\end{eqnarray}$$
and from (7.7) we obtain the asymptotic algebraic decay of average maximum concentration as
 $\langle c_{m,2D}(n)\rangle \propto n^{-\unicode[STIX]{x1D6FC}-(\unicode[STIX]{x1D6FD}+1)/2}$
. Hence, there exists a qualitative difference in fluid mixing between 2D and 3D porous media: in 2D media fluid stretching is constrained to be algebraic, leading to algebraic dilution, whereas exponential stretching is inherent to 3D porous media, yielding dilution that scales exponentially with longitudinal distance.
7.3 Concentration PDF, mean and variance
We also derive the pore-scale concentration PDF, mean and variance as a function of the longitudinal pore number
 $n$
. In terms of the spatial concentration PDF, there exist two different measures that are used to measure, predict and quantify mixing and dilution. The first measure, termed the fluid support PDF, considers the concentration PDF over the entire fluid cross-sectional area
 $A$
at a fixed longitudinal distance
 $z_{n}$
. The second measure, termed the concentration support PDF, considers a subset
 $A_{c}$
of the area
 $A$
corresponding to concentration values greater than a minimum threshold
 $\unicode[STIX]{x1D716}$
. We shall derive expressions for both concentration measures.
To determine the concentration support PDF, we note that the concentration PDF across a lamella for a given maximum concentration
 $c_{m}$
is obtained from (6.10) through spatial mapping over
 $c\in [\unicode[STIX]{x1D716},c_{m}]$
as
 $$\begin{eqnarray}\displaystyle p(c|c_{m})=\frac{1}{2c\sqrt{\ln (c_{m}/\unicode[STIX]{x1D716})\ln (c_{m}/c)}},\quad p(c,n)=\int _{c}^{\infty }\text{d}c_{m}p(c|c_{m})p_{m}(c_{m},n),\quad & & \displaystyle\end{eqnarray}$$
which, using (7.6) and (7.10), may be expressed in terms of the PDF (6.16) of
 $\ln \unicode[STIX]{x1D70F}$
as
 $$\begin{eqnarray}\displaystyle p(c,n)=\int _{\ln c}^{\infty }\text{d}z\frac{1}{1-\exp (2z)}\frac{p_{\ln \unicode[STIX]{x1D70F}}[\ln (Pe[\exp (2z)-1],n)]}{c\sqrt{(z-\ln \unicode[STIX]{x1D716})(z-\ln c)}}, & & \displaystyle\end{eqnarray}$$
which may be simplified via Laplace’s method for
 $c<\langle c_{m}(n)\rangle$
to
 $$\begin{eqnarray}\displaystyle p(c,n)\approx \frac{1}{2c\sqrt{(\ln \langle c_{m}(n)\rangle -\ln \unicode[STIX]{x1D716})(\ln \langle c_{m}(n)\rangle -\ln c)}}, & & \displaystyle\end{eqnarray}$$
the
 $k$
th moment of which is then
 $$\begin{eqnarray}\displaystyle \langle c(n)^{k}\rangle =\frac{\langle c_{m}(n)\rangle ^{k}\sqrt{\unicode[STIX]{x03C0}}\text{erf}[\sqrt{k\ln (\langle c_{m}(n)\rangle /\unicode[STIX]{x1D716})}]}{2\sqrt{k\ln (\langle c_{m}(n)\rangle /\unicode[STIX]{x1D716})}}. & & \displaystyle\end{eqnarray}$$
Figure 10 shows the concentration support PDFs of
 $\ln c$
and
 $c$
from (7.12) for
 $Pe=10^{8}$
as a function of the longitudinal pore number
 $n$
. The concentration PDF follows the same trend as that for the maximum concentration in that the PDFs for
 $n=20$
and
 $40$
are almost indistinguishable due to limited dilution in the advection-dominated regime
 $n\leqslant n_{c}$
(where
 $n_{c}\approx 70$
for
 $Pe=10^{8}$
), whereas significant dilution arises in the diffusion-dominated regime
 $n>n_{c}$
after the mixing scale reaches its minimum.
Concentration support PDF of (a)
 $\ln c$
and (b)
 $c$
at downstream positions of (solid)
 $n=20$
, (dash-dotted)
 $n=40$
, (long dashed)
 $n=60$
and (short dashed)
 $n=80$
pores for
 $Pe=10^{8}$
.

We denote the
 $k$
th moment of the spatial concentration PDF under the concentration and fluid supports respectively as
 $$\begin{eqnarray}\displaystyle & \displaystyle \langle c(n)^{k}\rangle \equiv \frac{1}{A_{c}}\int _{A_{c}}\text{d}\boldsymbol{x}c(x,y,n)^{k}, & \displaystyle\end{eqnarray}$$
 $$\begin{eqnarray}\displaystyle & \displaystyle \overline{c(n)^{k}}\equiv \frac{1}{A}\int _{A}\text{d}\boldsymbol{x}c(x,y,n)^{k}\approx \frac{1}{A}\int _{A_{c}}\text{d}\boldsymbol{x}c(x,y,n)^{k}, & \displaystyle\end{eqnarray}$$
 $\unicode[STIX]{x1D716}\ll c_{m}$
these moments are related as
 $$\begin{eqnarray}\displaystyle A\overline{c(n)^{k}}\approx A_{c}\langle c(n)^{k}\rangle . & & \displaystyle\end{eqnarray}$$
From (7.13), under the assumption
 $\langle c_{m}(n)\rangle \gg \unicode[STIX]{x1D716}$
, the concentration support mean and variance are then
 $$\begin{eqnarray}\displaystyle & \displaystyle \langle c(n)\rangle \approx \frac{\langle c_{m}(n)\rangle \sqrt{\unicode[STIX]{x03C0}}}{2\sqrt{\ln (\langle c_{m}(n)\rangle /\unicode[STIX]{x1D716})}}, & \displaystyle\end{eqnarray}$$
 $$\begin{eqnarray}\displaystyle & \displaystyle \unicode[STIX]{x1D70E}_{\langle c\rangle }^{2}(n)\equiv \langle c(n)^{2}\rangle -\langle c(n)\rangle ^{2}=\langle c(n)\rangle ^{2}\left(\frac{\langle c_{m}(n)\rangle }{\langle c(n)\rangle \sqrt{2}}-1\right), & \displaystyle\end{eqnarray}$$
 $\langle c_{m}(n)\rangle$
,
 $\langle c_{m}(n)\rangle ^{2}$
. Due to conservation of mass the fluid support mean concentration
 $\overline{c(n)}$
is constant, and is given in dimensional terms by integration of (6.1) for
 $\unicode[STIX]{x1D716}\ll c_{m}(0)$
as
 $$\begin{eqnarray}\displaystyle \overline{c(n)}=\frac{1}{A}\int _{0}^{l_{0}}\text{d}\unicode[STIX]{x1D701}\int _{-\unicode[STIX]{x1D702}_{\unicode[STIX]{x1D716}}}^{\unicode[STIX]{x1D702}_{\unicode[STIX]{x1D716}}}\text{d}\unicode[STIX]{x1D702}c(\unicode[STIX]{x1D702},\unicode[STIX]{x1D701},0)\approx \frac{c_{0}l_{0}}{A}, & & \displaystyle\end{eqnarray}$$
where
 $c|_{\unicode[STIX]{x1D702}=\pm \unicode[STIX]{x1D702}_{\unicode[STIX]{x1D716}}}=\unicode[STIX]{x1D716}$
. Using (7.16)–(7.18) the fluid support concentration variance scales linearly with
 $\langle c_{m}(n)\rangle$
as
 $$\begin{eqnarray}\displaystyle \unicode[STIX]{x1D70E}_{\overline{c}}^{2}(n)\equiv \overline{c(n)^{2}}-\overline{c(n)}^{2}=\overline{c(n)}^{2}\left(\frac{\langle c_{m}(n)\rangle }{\overline{c(n)}\sqrt{2}}-1\right). & & \displaystyle\end{eqnarray}$$
Although (7.18), (7.20) yield negative concentration variances in the homogenization limit of large
 $n$
(as
 $\langle c_{m}(n)\rangle \rightarrow \langle c(n)\rangle ,\overline{c(n)}$
), the derived model is valid in the pre-coalescence regime, and so is not expected to capture the late-time dissipation dynamics. Conversely, at earlier times when
 $\langle c_{m}(n)\rangle \gg \overline{c(n)},\langle c(n)\rangle$
, the pore-scale concentration and fluid support measures of concentration variance respectively scale as
 $\langle c_{m}(n)\rangle ^{2}$
,
 $\langle c_{m}(n)\rangle$
, and so directly inherit the behaviour of the maximum concentration
 $c_{m}(n)$
for both 2D and 3D porous media. In the diffusion-dominated regime (
 $n>n_{c}$
) this yields exponential scalar dissipation with pore number
 $n$
for 3D porous media and algebraic dissipation in 2D media.
7.4 Chaotic mixing within an arbitrary plume
While the results above pertain to pore-scale mixing of a macroscopically homogeneous concentration field, we also consider how these results apply to dilution within an arbitrary solvent plume. For illustration we consider a steady plume arising from a continuously injected point source, as shown in figure 3. For such a plume the mean macroscopic concentration develops a Gaussian distribution in the direction transverse to the mean flow. Hence, the average lamellar length
 $l_{p}$
per pore varies with the transverse radial
 $r$
and longitudinal
 $z_{n}=\ell n$
distance from the injection source point as
 $$\begin{eqnarray}\displaystyle l_{p}(n,r)=\frac{l(n)}{\unicode[STIX]{x03C0}n^{2}d^{2}}\exp \left(-\frac{(\unicode[STIX]{x1D719}_{A}r)^{2}}{n^{2}d^{2}}\right), & & \displaystyle\end{eqnarray}$$
where the total lamellar length is
 $l(n)=l_{0}\exp (\unicode[STIX]{x1D706}_{\infty }n)$
,
 $\unicode[STIX]{x1D719}_{A}$
is the transverse areal porosity and
 $d$
is the pore inlet/outlet centre-to-centre distance. Pore-scale concentration support measures such as the mean mixing scale
 $\langle \unicode[STIX]{x1D716}_{m}(n)\rangle$
, maximum concentration
 $\langle c_{m}(n)\rangle$
, concentration PDF
 $p(c|n)$
, concentration mean
 $\langle c(n)\rangle$
and variance
 $\unicode[STIX]{x1D70E}_{\langle c\rangle }^{2}(n)$
under the concentration support are the same as for pointwise or uniform injection, while the concentration mean
 $\overline{c(n)}$
and variance
 $\unicode[STIX]{x1D70E}_{\overline{c}}^{2}(n)$
under the fluid support are markedly different. Following (7.17) and (7.18), these pore-scale quantities within the plume vary with the pore number
 $n$
and radial distance
 $r$
as
 $$\begin{eqnarray}\displaystyle & \displaystyle \overline{c_{p}(n,r)}=\overline{c(n)}\frac{l_{p}(n,r)}{l(n)}, & \displaystyle\end{eqnarray}$$
 $$\begin{eqnarray}\displaystyle & \displaystyle \unicode[STIX]{x1D70E}_{\overline{c},p}^{2}(n,r)=\overline{c_{p}(n,r)}^{2}\left(\frac{\langle c_{m}(n)\rangle }{\overline{c_{p}(n,r)}\sqrt{2}}-1\right). & \displaystyle\end{eqnarray}$$
 $\langle c_{m}(n)\rangle$
which decays exponentially with the pore number
 $n$
in 3D random media. In general, (7.22), (7.23) hold for any macroscopic concentration distribution
 $l_{p}(x,y,n)/l(n)$
arising from any injection protocol at
 $n=0$
in both heterogeneous and homogeneous media.
8 Conclusions
Three-dimensional pore networks are characterized by (i) significant topological complexity inherent to all porous media and (ii) highly heterogeneous velocity distributions imparted by ubiquitous no-slip conditions at pore walls, which are further compounded by the distribution of pore sizes. The ubiquity of these mechanisms has significant implications for the prediction and understanding of fluid mixing and macroscopic dispersion in 3D random porous media. The interplay of exponential fluid stretching and broad velocity distributions arising from the no-slip condition generates significantly accelerated mixing via the production of highly striated lamellar concentration distributions.
Conversely, classical conceptual models that are implicitly based upon transport in a two-dimensional pore space impart topological constraints on streamline dynamics (i.e. forbidding streamline crossing) which limit fluid stretching to grow algebraically with time under steady flow conditions. In 3D, chaotic stretching is generated by the critical points which are typically located at pore junctions in the flow field which impart significant stretching and folding of fluid elements during steady advection.
We study these mechanisms in a model 3D open porous network which is homogeneous at the macroscale, and develop a CTRW model for fluid deformation and pore-scale mixing based upon high-resolution CFD simulation of Stokes flow in the network model. The predictions of this model agree very well with direct numerical simulations. Analytic estimates of the mixing dynamics show that mixing and dilution under steady-state conditions is controlled by the mean and variance of the fluid stretching rates (quantified respectively by the Lyapunov exponent
 $\unicode[STIX]{x1D706}_{\infty }$
and the variance
 $\unicode[STIX]{x1D70E}^{2}$
) and the Péclet number
 $Pe$
, such that the mean concentration decays exponentially with longitudinal advection in 3D random porous media, whereas the mean concentration variance decays algebraically in 2D porous media. While highly idealized, these basic mechanisms are universal to 3D porous media and so these results have significant implications for both modelling and understanding mixing in random media.
The developed stretching CTRW model predicts mixing rates for general fluid stretching properties and transit time distributions. Hence, we anticipate that it may be applicable to quantify mixing in a range of porous materials to decipher the role of network topology and structure on pore-scale mixing and thus on upscaled dilution and mixing-limited reactions. The proposed framework may be extended to transient transport conditions, relevant, for instance, for pulse tracer injections, through the integration of longitudinal mixing processes.
Acknowledgements
M.D. acknowledges the support of the European Research Council (ERC) through the project MHetScale (contract no. 617511). T.L.B. acknowledges the support of the ERC project ReactiveFronts and Agence Nationale de la Recherche project Subsurface Mixing and Reaction.
Appendix A. Nonlinear shear and non-stationarity
The nonlinear shear deformation in
 $\mathscr{M}$
generates deformation not captured by the linearized deformation tensor
 $\unicode[STIX]{x1D641}_{2D}$
, as reflected by the stretching rates shown in figure 11(a). Such deformation extends the range of stretching beyond
 $\unicode[STIX]{x1D70C}\in [1/2,2]$
and also increases the asymmetry of the stretching process, increasing both the variance and the mean of the stretching distribution over a couplet to
 $\unicode[STIX]{x1D70E}^{2}\approx 0.128$
,
 $\unicode[STIX]{x1D706}_{\infty }\approx 0.124$
respectively.
(a) Comparison of the PDFs of logarithmic stretching
 $P_{\unicode[STIX]{x1D719}}(\unicode[STIX]{x1D719})$
over a couplet computed from the nonlinear advective map
 $\mathscr{M}$
(solid grey) or derived from the linearized deformation tensor
 $\unicode[STIX]{x1D641}_{2D}$
(black line). (b) Evolution of the mean
 $\unicode[STIX]{x1D706}_{\infty }$
(black, solid) and variance
 $\unicode[STIX]{x1D70E}^{2}$
(grey, solid) of the material deformation with the number of pores
 $n$
, and convergence of the increment of the mean
 $\langle \unicode[STIX]{x1D719}_{n+1}\rangle -\langle \unicode[STIX]{x1D719}_{n}\rangle$
(black, dashed) and variance
 $\langle (\unicode[STIX]{x1D719}_{n+1}-\langle \unicode[STIX]{x1D719}_{n+1}\rangle )^{2}\rangle -\langle (\unicode[STIX]{x1D719}_{n}-\langle \unicode[STIX]{x1D719}_{n}\rangle )^{2}\rangle$
(grey, dashed), respectively reflecting anticorrelation and non-stationarity of the adjective map
 $\mathscr{M}$
. (c) Comparison of the lognormal form (4.16) of the PDF of
 $\ln \unicode[STIX]{x1D70C}$
(lines) to the PDFs obtained numerically from the one-step CTRW model (5.2) for (circles)
 $n=20$
, (pentagons)
 $n=40$
, (diamonds)
 $n=60$
, (squares)
 $n=80$
and (triangles)
 $n=160$
.

Furthermore, the stretching process over a couplet under
 $\mathscr{M}$
is both non-stationary and anticorrelated due to preferential alignment of initially randomly oriented material elements with the pore boundary as they undergo stretching. This is purely a geometric effect in that highly striated fluid elements must preferentially align tangentially with the pore boundary to allow packing within a finite domain. As the stretching process under
 $\mathscr{M}$
rapidly converges (after 20 pores) to a stationary process, the increment of the mean
 $\langle \unicode[STIX]{x1D719}_{n+1}\rangle -\langle \unicode[STIX]{x1D719}_{n}\rangle$
and variance
 $\langle (\unicode[STIX]{x1D719}_{n+1}-\langle \unicode[STIX]{x1D719}_{n+1}\rangle )^{2}\rangle -\langle (\unicode[STIX]{x1D719}_{n}-\langle \unicode[STIX]{x1D719}_{n}\rangle )^{2}\rangle$
quickly converge as per figure 11(b). Conversely, anticorrelation causes these moments to converge more slowly towards the asymptotic values
 $\unicode[STIX]{x1D706}_{\infty }\approx 0.128$
,
 $\unicode[STIX]{x1D70E}^{2}\approx 0.124$
. Rather than develop a stochastic model that fully captures non-stationarity and anticorrelation, we approximate this process by using the uncorrelated and stationary one-step stretching CTRW (5.2), where the increment
 $\unicode[STIX]{x1D719}$
is from the distribution shown in figure 11(a) with mean and variance given by these asymptotic values. Figure 11(c) shows that the lognormal form (4.16) parameterized by the asymptotic values of
 $\unicode[STIX]{x1D706}_{\infty }\approx 0.128$
,
 $\unicode[STIX]{x1D70E}^{2}\approx 0.124$
compares very well with the PDFs of
 $\ln \unicode[STIX]{x1D70C}$
from direct numerical calculation.
Appendix B. Distribution of transit times – the Landau distribution
The PDF
 $p_{n}(t)$
of
 $t_{n}$
given in (5.1) can be written in Laplace space as
 $$\begin{eqnarray}\displaystyle p_{n}^{\ast }(\unicode[STIX]{x1D706})=\unicode[STIX]{x1D713}^{\ast }(\unicode[STIX]{x1D706})^{n}. & & \displaystyle\end{eqnarray}$$
The Pareto distribution (4.18) is a Levy-stable distribution, which means, in particular, that the long-time behaviour of
 $p_{n}(t)$
is the same as that of (4.18). The dimensionless Pareto distribution (4.18) is
 $\unicode[STIX]{x1D713}(\unicode[STIX]{x0394}t)=1/\unicode[STIX]{x0394}t^{2}$
,
 $\unicode[STIX]{x0394}t>1$
, and its Laplace transform is then
 $$\begin{eqnarray}\displaystyle \unicode[STIX]{x1D713}^{\ast }(\unicode[STIX]{x1D706})=\exp (-\unicode[STIX]{x1D706})+\unicode[STIX]{x1D706}\text{Ei}(-\unicode[STIX]{x1D706}), & & \displaystyle\end{eqnarray}$$
where
 $\text{Ei}(x)$
is the exponential integral (Abramowitz & Stegun Reference Abramowitz and Stegun1972). For small
 $\unicode[STIX]{x1D706}\ll 1$
, this expression can be expanded as
 $$\begin{eqnarray}\displaystyle \unicode[STIX]{x1D713}^{\ast }(\unicode[STIX]{x1D706})=1-\unicode[STIX]{x1D706}(1-\unicode[STIX]{x1D6FE})+\unicode[STIX]{x1D706}\ln (\unicode[STIX]{x1D706})+\cdots \,. & & \displaystyle\end{eqnarray}$$
Thus, we can write
 $p_{n}^{\ast }(\unicode[STIX]{x1D706})$
for small
 $\unicode[STIX]{x1D706}\ll 1$
as
 $$\begin{eqnarray}\displaystyle p_{n}^{\ast }(\unicode[STIX]{x1D706})=\exp [-\unicode[STIX]{x1D706}n(\ln n+1-\unicode[STIX]{x1D6FE})+\unicode[STIX]{x1D706}n\ln (\unicode[STIX]{x1D706}n)]. & & \displaystyle\end{eqnarray}$$
The inverse Laplace transform of this expression gives for
 $p_{n}(t)$
 $$\begin{eqnarray}\displaystyle p_{n}(t)=\frac{1}{n}f_{1}\left[\frac{t-n(\ln n+1-\unicode[STIX]{x1D6FE})}{n}\right], & & \displaystyle\end{eqnarray}$$
where
 $$\begin{eqnarray}\displaystyle f_{1}(t)=\int \frac{\text{d}\unicode[STIX]{x1D706}}{2\unicode[STIX]{x03C0}\text{i}}\exp [\unicode[STIX]{x1D706}\ln (\unicode[STIX]{x1D706})]\exp (-\unicode[STIX]{x1D706}t) & & \displaystyle\end{eqnarray}$$
denotes the Landau distribution (Uchaikin & Zolotarev Reference Uchaikin and Zolotarev1999), which scales as
 $f_{1}(t)\approx t^{-2}$
for
 $t\gg 1$
. Expression (B 5) describes the density
 $p_{n}(t)$
in the limit of large
 $t$
or large
 $n$
. In order to test this approximation, we performed numerical random walk simulations for
 $10^{6}$
realizations of the random time
 $t_{n}$
. The obtained PDF
 $p_{n}(t)$
is rescaled as
 $$\begin{eqnarray}\displaystyle \hat{p}_{n}(z)=np_{n}[nz+n(\ln n+1-\unicode[STIX]{x1D6FE})]. & & \displaystyle\end{eqnarray}$$
In the limit
 $n\rightarrow \infty$
, we expect
 $\hat{p}_{n}(z)\rightarrow f_{1}(z)$
. Figure 12 shows
 $\hat{p}_{n}(z)$
for
 $n=10$
and
 $10^{3}$
compared with (B 6), which is obtained by numerical inverse Laplace transform. The maximum of (B 6) is assumed at
 $t_{m}=-(\ln \unicode[STIX]{x03C0}/2)/2$
, as illustrated in figure 12(b).
(a) Rescaled and shifted PDF
 $\hat{p}_{n}(z)$
for (blue)
 $n=10$
and (green)
 $n=10^{3}$
obtained from random walk simulations for
 $10^{6}$
realizations of the stochastic process
 $t_{n}$
. The red line indicates the Landau PDF obtained from numerical inverse Laplace transform of (B 6). (b) Comparison of the (red) Landau PDF
 $f_{1}(z)$
defined by (B 6) and (green) the approximation (B 8) by the Moyal distribution.

We consider now the average
 $\langle \ln t_{n}\rangle$
, which is dominated by the bulk of the Landau distribution
 $p_{n}(t)$
. To this end, we note that the bulk of the Landau distribution
 $f_{1}(t)$
can be approximated by the Moyal distribution
 $$\begin{eqnarray}\displaystyle f_{m}(x)=\frac{1}{\sqrt{2\unicode[STIX]{x03C0}}}\exp \left[-\frac{1}{2}(x+\text{e}^{-x})\right]\quad \text{as }f_{1}(t)=af_{m}[a(t-b)], & & \displaystyle\end{eqnarray}$$
with
 $a=0.7413$
and
 $b=0.0064$
. Thus, we may approximate
 $p_{n}(t)$
in terms of
 $f_{m}(x)$
as
 $$\begin{eqnarray}\displaystyle p_{n}(t)\approx \frac{a}{n}f_{m}\left(a\left[\frac{t-n(\ln n+1-\unicode[STIX]{x1D6FE})}{n}-b\right]\right). & & \displaystyle\end{eqnarray}$$
The mean of
 $\ln t_{n}$
is then approximated by
 $$\begin{eqnarray}\displaystyle \langle \ln t_{n}\rangle \approx \int _{-\infty }^{\infty }\text{d}x\ln \left[n(\ln n+1-\unicode[STIX]{x1D6FE})+\frac{n}{a}(\langle x_{m}\rangle +b)+\frac{nx}{a}\right]f_{m}(\langle x_{m}\rangle +x), & & \displaystyle\end{eqnarray}$$
where
 $\langle x_{m}\rangle =\ln 2+\unicode[STIX]{x1D6FE}$
is the mean of the Moyal distribution. Thus, we obtain approximately for
 $\langle \ln t_{n}\rangle$
 $$\begin{eqnarray}\displaystyle \langle \ln t_{n}\rangle \approx \ln \left[\frac{n}{a}(\ln 2+\unicode[STIX]{x1D6FE}+b)+n(\ln n+1-\unicode[STIX]{x1D6FE})\right]=\ln (\langle t_{n}\rangle ), & & \displaystyle\end{eqnarray}$$
where the mean
 $\langle t_{n}\rangle$
of the Moyal distribution (B 9) is given by
 $$\begin{eqnarray}\displaystyle \langle t_{n}\rangle \approx \frac{n}{a}(\ln 2+\unicode[STIX]{x1D6FE}+b)+n(\ln n+1-\unicode[STIX]{x1D6FE}). & & \displaystyle\end{eqnarray}$$
We consider now the average over
 $\sqrt{t_{n}+Pe\unicode[STIX]{x1D70C}_{n}^{-2}}$
, which is required to estimate the average mixing scale (7.2). It is also dominated by the bulk of the Landau distribution. As in (B 10),
 $\langle \sqrt{t_{n}+Pe\unicode[STIX]{x1D70C}_{n}^{-2}}\rangle$
can be approximated as
 $$\begin{eqnarray}\displaystyle \int _{-\infty }^{\infty }\text{d}xf_{m}(\langle x_{m}\rangle +x)\sqrt{\left[n(\ln n+1-\unicode[STIX]{x1D6FE})+\frac{n}{a}(\langle x_{m}\rangle +b)+\frac{nx}{a}\right]+Pe\unicode[STIX]{x1D70C}_{n}^{-2}}. & & \displaystyle\end{eqnarray}$$
As above, this expression can be approximated by
 $$\begin{eqnarray}\displaystyle \left\langle \sqrt{t_{n}+Pe\unicode[STIX]{x1D70C}_{n}^{-2}}\right\rangle \approx \sqrt{\langle t_{n}\rangle +Pe\unicode[STIX]{x1D70C}_{n}^{-2}}. & & \displaystyle\end{eqnarray}$$