


1 Introduction
There is considerable concern across the social sciences with the fragility of estimated treatment effects and their reproducibility (Maniadis, Tufano, and List Reference Maniadis, Tufano and List2014; Levitt and List Reference Levitt and List2015; Open Science Collaboration 2015). Short of outright fraud, experiments do not replicate either because of knife-edge treatment effects (Gelman Reference Gelman2013) or experimental measurement error. Some of this concern has focused on the appropriateness of different experimental modes (Chang and Krosnick Reference Chang and Krosnick2009; Camerer Reference Camerer2015; Levitt and List Reference Levitt and List2015; Coppock Reference Coppock2018). In this essay we demonstrate that experimental designs that incorporate diverse experimental modes can facilitate the detection of treatment effect heterogeneity and associated experimental measurement error.
Our novel contribution is to suggest how replicating identical experimental protocols across diverse experimental modes can inform efforts to detect experimental measurement error. We propose an iterative, machine-learning-based estimation strategy in order to assess the magnitude of heterogeneous treatment effects across modes. These multi-mode microreplications can be informative if researchers observe sufficiently different estimated treatment effects and they can distinguish, with reasonable precision, modes with high versus low experimental measurement error. We propose two further diagnostic strategies that help assess whether any observed heterogeneity reflects experimental measurement error. First, we propose to embed measurement items in the experimental protocol to help calibrate measurement error. Second, we advocate supplemental experiments that directly manipulate the magnitude of experimental measurement error. These diagnostic techniques along with multi-mode microreplications help assess the robustness of estimated treatment effects.
We illustrate our case for multi-mode microreplications with the results from four identical interactive experiments. One experiment consists of 6 sessions with 116 subjects in the Nuffield Centre for Experimental Social Sciences (CESS) Lab. A second identical experiment was conducted online with 144 subjects from the same CESS lab subject pool. In a third experiment 90 subjects from the CESS UK Online subject pool took decisions in the identical interactive experiment. Finally, 390 MTurk workers, all from the U.S., made choices in an identical interactive experiment.Footnote 1 Separately, to illustrate how embedded, or complementary, experiments can help identify experimental measurement error, we conducted experimental vignette experiments in India with samples of 200 MTurk and 200 CESS India Online subjects.
We begin with a discussion of multi-mode microreplications, suggesting why this strategy helps identify experimental measurement error. We present the results of a simulation that illustrates the informative value of multi-mode replications. This is followed by three sections, each presenting a diagnostic strategy along with empirical examples: an iterative machine learning-based statistical method for estimating mode-specific heterogeneous treatment effects; measurement strategies for detecting experimental measurement error; and experimental approaches for evaluating conjectures about experimental measurement error.
2 Microreplication and Multi-modes
2.1 How Should I Microreplicate?
Many experiments are conducted with a nonprobability sample and can be implemented in a variety of modes. By modes we mean how the experimental treatments are delivered to subjects. Classic social science experiments are conducted in experimental labs where subjects receive treatments under the close supervision of the experimenter. Over the past decades, the modes for delivering experimental treatments have diversified dramatically. The subjects could be “workers” who agree to do paid tasks on the internet—MTurk being the most popular example although there are quite numerous variations on this theme. They could be part of a regular panel that agrees to answer various types of surveys on a regular basis. And experiments embedded in these surveys could be conducted in person, online, on the phone, on various personal devices, or on Skype. Social media experimentation can take place on the internet with digital traces representing the outcomes of interest (Centola Reference Centola2018). And of course there is a proliferation of experiments that are conducted in a wide variety of field settings.
We contend that this diversity of modes provides researchers with a unique opportunity to identify experimental measurement error. Our contribution is to suggest effective microreplication strategies given this diversity of experimental modes and constraints on researchers’ resources. For many, having already invested in a particular mode—say MTurk—the preferred strategy is to replicate within that same mode.Footnote 2 We contend however that if the mode itself incorporates features that exaggerate, or contribute to, experimental measurement error then replicating within mode may not be particularly informative about fragile treatment effects. If the objective is to identify the measurement error associated with an experimental implementation, then the most cost-effective microreplication strategy is to invest in alternative modes.
The experimental endeavor is all about a design and implementation that will generate convincing results that replicate. We contend multi-mode microreplications not only facilitate measurement error detection but have higher marginal payoffs than investing in same-mode replication. To demonstrate this proposition, we construct a simple simulation of experimental decision-making. As our simulations suggest, multi-mode microreplications will be helpful under two reasonable assumptions: the prevalence of experimental measurement error varies by experimental context, or mode; and, second, when observing treatment effects that vary by mode researchers can typically identify the mode exhibiting lower measurement error.
2.2 Experimental Measurement Error
Experimental measurement error occurs when subjects make choices or decisions that are an unintended artifact of the experimental design. This is a violation of the exclusion restriction since elements of the treatment delivery (mode) are confounded with treatment effects. An underlying theme of much of the voluminous literature on experimental modes is the claim that experimental measurement error is, or is not, exaggerated in one mode versus another. Experimental measurement error fuels the debate in economics regarding the merits and failings of classic lab experiments as opposed to field experiments (Camerer Reference Camerer2015; Levitt and List Reference Levitt and List2015). One of the most widely cited examples of experimental measurement error is the experimenter effect (Zizzo Reference Zizzo2010) that has been attributed to classic lab settings (Levitt and List Reference Levitt and List2007), field experiments (Al-Ubaydli et al. Reference Al-Ubaydli, List, LoRe and Suskind2017; Dupas and Miguel Reference Dupas, Miguel, Duflo and Banerjee2017) and survey experiments (Bertrand and Mullainathan Reference Bertrand and Mullainathan2001; Gooch and Vavreck Reference Gooch and Vavreck2019), although de Quidt, Haushofer, and Roth (Reference de Quidt, Haushofer and Roth2018) suggest its overall effect might be exaggerated. Online experiments have a range of potential experimental measurement errors that are unique to the mode, including inattention, online use of search browsers, trolling, and multiple identities. MTurk online experiments, particularly because of their popularity, have come under scrutiny due to potential measurement error associated with experimenter effects, the active social networks that link MTurk workers, questions about the nationality of MTurk workers, and, in fact, whether many MTurk workers are real people or simply bots (Burleigh, Kennedy, and Clifford Reference Burleigh, Kennedy and Clifford2018; Kennedy et al. Reference Kennedy, Clifford, Burleigh, Jewell and Waggoner2018). Our general point is that regardless of what experimental mode is selected—a lab experiment, crowd-sourced worker experiment, online with highly paid subjects, lab in the field, Facebook-recruited subjects, online with representative panel, random control trials in the field—there will be well-regarded published authorities demonstrating the extent to which a particular mode is prone to experimental measurement error.
Researchers should adopt designs that maximize their chances of being informed about this potential experimental measurement error. By deliberately varying the experimental mode, researchers increase the likelihood of observing heterogeneous treatment effects produced by measurement error. The challenge for researchers is discerning whether results are artifacts of experimental measurement error when they observe different mode-related treatment effects.Footnote 3
2.3 Are Multi-mode Replications Informative?
Experimental measurement error occurs when outcomes are an unintended artifact of the experimental design. As a result we observe an outcome with error. The implementation of multi-mode experiments can anticipate, and help account for, this measurement error (Loomes Reference Loomes2005). One of the important challenges for experimentalists is simply detecting experimental measurement error and hence potential threats to the robustness of a reported treatment effect. In a perfect world we report an  $\text{ATE}_{T}$ that reflects the “true” treatment effect. In fact, of course, the typical experiment generates
 $\text{ATE}_{k}$ where
 $k=a$ mode. Having conducted a single experiment—lets say with 500 subjects on MTurk—it is difficult to be certain that
 $\text{ATE}_{k}$ approximates
 $\text{ATE}_{T}$.Footnote 4
We contend that measurement error is exaggerated or minimized in some modes versus others. For example, underreporting on the outcome variable is more prevalent in certain modes. A concern is whether our data is generated in a mode that exaggerates this measurement error, i.e.,  $\text{ME}_{k}>0$ and hence our estimated treatment effect is biased, i.e.,
 $\text{ATE}_{k}^{\ast }=(\text{ATE}_{T}+\text{ME}_{k})$. Incorporating a multi-mode replication in the design may be informative about this measurement error—probably more informative than a monomode replication. Two conditions must hold in order for multi-mode replications to be informative about measurement error. First,
 $\text{ME}_{k}\neq \text{ME}_{k^{\prime }}$ and, second, there is a reasonably high probability the researcher can distinguish low- from high-error modes.
Microreplications are designed to identify experimental measurement error. A microreplication that has a low probability of signaling measurement error is probably not worth the investment. Repeated sampling from the same mode may simply confirm the underlying bias created by mode-related measurement error. But of course, depending on one’s priors regarding the prevalence of measurement error in different modes, multi-mode replications might not be cost-effective. We have constructed a simple simulation based on reasonable priors regarding the state of experimental measurement error. It suggests that multi-mode replication has as-good, if not better, payoffs than single-mode replication even when researchers’ capacity to identify modes with low experimental measurement error are low.
Our “true” average treatment effect, ( $\text{ATE}_{T}$), excludes any bias created by mode-related measurement error—respondent fatigue, experimenter effects, falsified responses, etc.Footnote 5
 $\text{ATE}_{T}$ is unobserved. A typical experimenter will observe
 $\text{ATE}_{k}^{\ast }$, where
 $k$ is the mode in which the experiment is conducted. In our illustration, researchers can be in one of three “mode” states with some fixed probability,
 $p_{k}$ such that
 $\sum _{k=1}^{3}p_{k}=1$.
 $\text{ME}_{k}$ is the experimental measurement error associated with mode
 $k\in \{1,2,3\}$. In our illustration this can vary between 0 and 50. Each treatment effect will be observed with some probability:
 $\text{ATE}_{k}^{\ast }=(\text{ATE}_{T}+\text{ME}_{k})\times p_{k}$. A key consideration in engaging in multi-mode microreplication is the researcher’s ability to detect which mode has a measurement error advantage. We capture this in the expected value calculation with the
 $\unicode[STIX]{x1D707}$ term.
 $\unicode[STIX]{x1D707}$ is the probability, conditional on observing the mode with the least experimental measurement error, of correctly identifying this mode,
 $k$, as having the least experimental measurement error.
We assume in this illustration that  $\sum _{k\neq 2}\text{ME}_{k}>\text{ME}_{2}=0$. Researchers observe
 $\text{ATE}_{k}^{\ast }$ and then make a decision regarding microreplication; to either replicate within the same mode or to replicate with a different mode. Their replication decision determines their final estimated
 $\text{ATE}_{k}^{\ast }$. For those who choose the path of microreplication within the same mode, their expected
 $\text{ATE}_{k}^{\ast }$ will simply be a function of the
 $p_{k}$ and
 $\text{ME}_{k}$. In a three mode setting, where
 $P=\{p_{1},p_{2}\}$ and
 $p_{3}=1-p_{1}-p_{2}$, the expected measurement error for microreplication within the same mode is as follows:
 $$\begin{eqnarray}E(P,\text{ME})=p_{1}\times \text{ME}_{1}+(1-p_{1}-p_{2})\times \text{ME}_{3}.\end{eqnarray}$$
Similarly we can compute the expected measurement error for those who opt for microreplication in a different mode. Their expected observed treatment effect is slightly different. First, the expected value calculation will include the probability of ending up in one of the other two modes. It of course also includes the mode-specific  $\text{ME}_{k}$. We include a third term,
 $\unicode[STIX]{x1D707}$ that is specific to those instances in which the researcher observes
 $\text{ATE}_{T}$, i.e, when
 $k=2$ in our scenario. This term reflects the ability of the researcher to correctly identify
 $k=2$ as having
 $\text{ME}=0$. Essentially this term reflects the success of efforts by researchers to embed measures and design microexperiments that identify experimental measurement error. For the sake of simplicity in this illustration we assume mode comparisons are only informative if the researcher is comparing a mode with experimental measurement error to one without. In fact, the result can be generalized to cases in which researchers are comparing modes with varying levels of experimental measurement error. The expected measurement error for microreplication in different modes is:
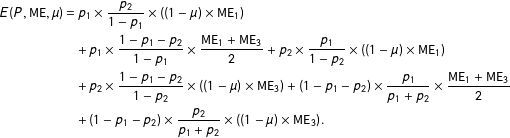 $$\begin{eqnarray}\displaystyle E(P,\text{ME},\unicode[STIX]{x1D707}) & = & \displaystyle p_{1}\times \frac{p_{2}}{1-p_{1}}\times ((1-\unicode[STIX]{x1D707})\times \text{ME}_{1})\nonumber\\ \displaystyle & & \displaystyle +\,p_{1}\times \frac{1-p_{1}-p_{2}}{1-p_{1}}\times \frac{\text{ME}_{1}+\text{ME}_{3}}{2}+p_{2}\times \frac{p_{1}}{1-p_{2}}\times ((1-\unicode[STIX]{x1D707})\times \text{ME}_{1})\nonumber\\ \displaystyle & & \displaystyle +\,p_{2}\times \frac{1-p_{1}-p_{2}}{1-p_{2}}\times ((1-\unicode[STIX]{x1D707})\times \text{ME}_{3})+(1-p_{1}-p_{2})\times \frac{p_{1}}{p_{1}+p_{2}}\times \frac{\text{ME}_{1}+\text{ME}_{3}}{2}\nonumber\\ \displaystyle & & \displaystyle +\,(1-p_{1}-p_{2})\times \frac{p_{2}}{p_{1}+p_{2}}\times ((1-\unicode[STIX]{x1D707})\times \text{ME}_{3}).\end{eqnarray}$$
The optimal microreplication strategy depends on the three parameters:  $p_{k}$,
 $\text{ME}_{k}$ and
 $\unicode[STIX]{x1D707}$, as Figure 1 illustrates. Here we have generated a schedule of outcomes for varying degrees of measurement error:
 $\text{ME}_{k}\in \{5,10,40\}$, for
 $k\in \{1,3\}$;
 $\text{ME}_{2}=0$. And
 $\unicode[STIX]{x1D707}$ is varied in the interval
 $[0.5,1]$; at
 $\unicode[STIX]{x1D707}=0.5$, the researcher places equal weighting between the two modes i.e., has no relevant priors that lead to the researcher weighting their estimation in favor of Mode 2 (as opposed to 1 or 3).Footnote 6 The values presented in Figure 1 are the effect on the expected measurement error of a multi-mode replication strategy relative to monomode replication. We vary the value of the measurement error in Modes 1 and 3 as detailed above, as well as the probabilities
 $p_{1}$ and
 $p_{2}$ (and so, by implication, the probability of being in Mode 3).Footnote 7 Each facet represents a different value of
 $\unicode[STIX]{x1D707}$, ranging from 0.5 to 1.0.
Simulation of relative measurement error using multi- versus single-mode replication.
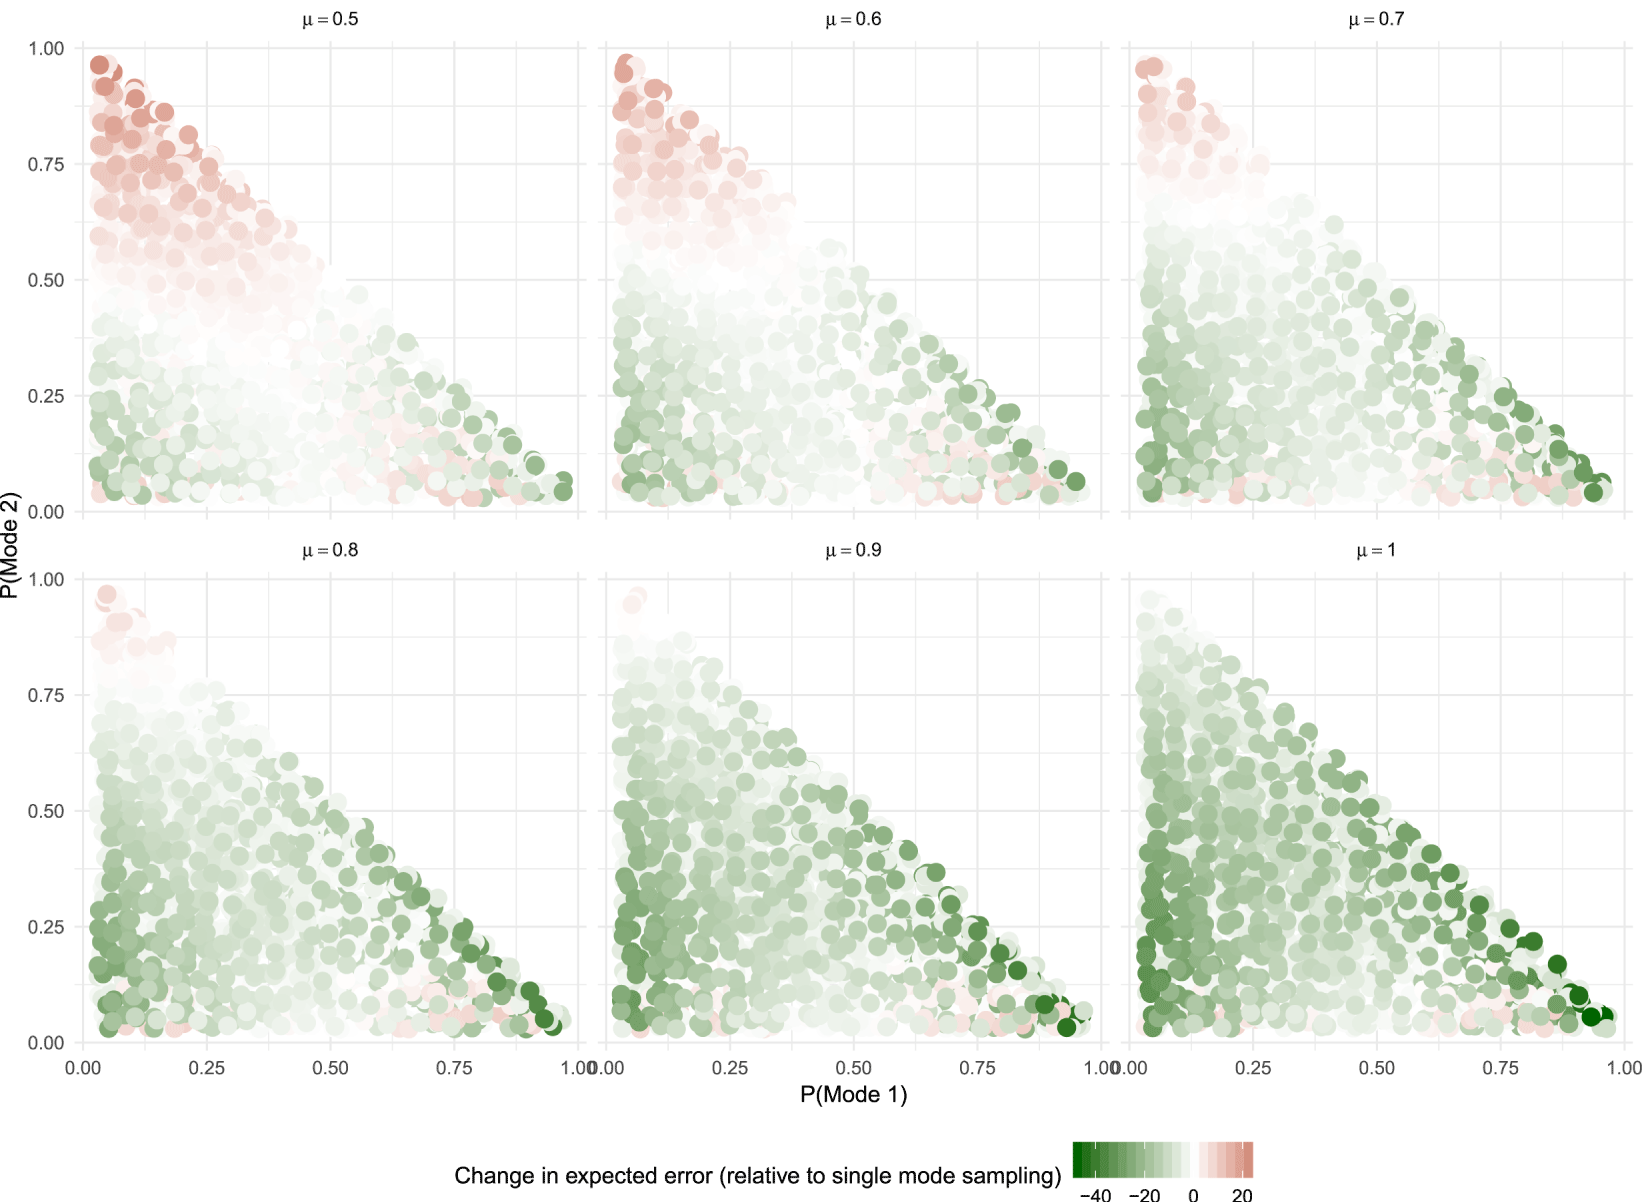
The red shading represents states of the replication world in which it is preferable to adopt a single mode replication strategy. First, and this is clear from Equation (2), as  $\unicode[STIX]{x1D707}$ declines from certainty and approaches 0.5, the monomode replication strategy becomes optimal across a larger range of scenarios. This corresponds to research designs that are poorly equipped to detect experimental measurement error—hence unable to distinguish a treatment effect with minimal versus considerable experimental measurement error. Being unable to weigh more favorably the estimate within Mode 2 means that in expectation it is more advantageous to microreplicate within the same mode. And we can see from Figure 1 that as a researcher becomes increasingly likely to recognize Mode 2 as having low measurement error, a high
 $\unicode[STIX]{x1D707}$, then adopting multi-mode microreplication is the dominant strategy.
But for intermediate values of  $\unicode[STIX]{x1D707}$, which are probably the most plausible, i.e., between 0.5 and 0.7, we get some sense of how variations in the state of experimental measurement error affect microreplication strategies. First, the probability of Mode 2 has to be much greater than 0.5 for it to make sense, in general, for researchers to adopt monoreplication strategies. Even when researchers have a greater than 50 percent chance of already having conducted an experiment with no measurement error, researchers will place greater weight on the mode with zero measurement error if it is chosen. As a result, multi-mode replication becomes less costly in expectation.
If the probability of a no experimental measurement error mode (i.e., Mode 2 with  $\text{ME}=0$) is less than 0.5 and
 $\unicode[STIX]{x1D707}$ is between 0.5 and 0.7 then multi-mode replication is the dominant strategy. Because the researcher expects to observe one of two modes with measurement error and is more than likely to distinguish the no experimental measurement error mode (Mode 2) from the nonzero mode (either Mode 1 or 3), in expectation the multi-mode replication strategy will have lower experimental measurement error than a single mode replication.
The bottom row of Figure 1 is in some sense aspirational. It represents a world in which researchers are almost certain to incorporate into their experimental design mechanisms for confidently detecting experimental measurement error ( $\unicode[STIX]{x1D707}>0.7$). In this case, a multi-mode microreplication is virtually always the dominant strategy. The remainder of the essay suggests strategies both in the design, and subsequent analysis of results, that facilitate detection of experimental measurement error, i.e. increases the magnitude of
 $\unicode[STIX]{x1D707}$.
3 Identifying Heterogeneous Mode Effects
The benefits of multi-mode replications illustrated in Figure 1 are very much contingent on our ability to identify heterogeneous treatment effects that are associated with mode. And by mode here we are referring to features of the experimental design that determine how treatments are administered to subjects. In a multi-mode replication we treat experimental modes like covariates that could potentially condition treatment effects. There are potentially many other competing covariates that could be conditioning treatment effects. And, as Huff and Tingley (Reference Huff and Tingley2015) suggest, clustering of particular covariates in different experimental modes could be confounded with what we are characterizing as mode effects.Footnote 8 The diagnostic utility of multi-mode replications depends on our ability to tease out the relative importance of mode in conditioning treatment effects.
To determine whether there are significant mode effects we implement an iterative, machine learning-based statistical method designed for estimating heterogeneous treatment effects (Athey and Imbens Reference Athey and Imbens2017; Grimmer, Messing, and Westwood Reference Grimmer, Messing and Westwood2017; Künzel et al. Reference Künzel, Sekhon, Bickel and Yu2019). The estimation is conducted without any a priori specification of the functional form of the heterogeneity in treatment effects. The method allows us to estimate the magnitude of treatment effects for all possible combinations of relevant covariates including the experimental modes. To the extent that there is no significant mode-related heterogeneity in conditional average treatment effects (CATEs) we gain some confidence that the estimated treatment effects are not confounded with experimental measurement error. Of course, this will only be the case for measurement error that is correlated with experimental mode. If the measurement error is similarly shared (i.e., the same magnitude) across modes then the multi-mode design would be uninformative. But to the extent that there is a correlation between mode and the magnitude of experimental measurement error (an argument frequently made in the literature) then the multi-mode design will be informative. We illustrate this with an experimental design that has identical interactive experiments implemented in four diverse experimental modes. And we implement one of a number of iterative machine learning-based statistical methods to estimate heterogeneity in treatment effects associated with these modes.
3.1 Experiment
We illustrate this approach using treatment effects generated from four different mode replications of identical experiments conducted by Duch, Laroze, and Zakharov (Reference Duch, Laroze and Zakharov2018). The aim of this study was to understand lying behavior. These experiments consisted of lying games in which subjects earn money performing real effort tasks (RETs); deductions are then applied to their earnings and distributed to other group members (subjects are randomly assigned to groups of four); and subjects have opportunities to lie about their earnings. In all experiments, subjects make the same interactive decisions in real time.
The lab sessions were conducted at Nuffield CESS in Nov.–Dec. 2013 and Aug.–Sep. 2017. The experiment begins with a Dictator Game. This is followed by two lying modules consisting of ten rounds each and they only differ in the audit rates—0% audit in the first module and 20% audit in the second. Prior to the lying game, participants are randomly assigned to groups of four and the composition of each group remains unchanged throughout both lying modules. Each round of these two lying modules has two stages. In the first stage subjects perform RET to compute a series of two-number additions in one minute. Their Preliminary Gains depend on the number of correct answers, getting 150 ECUs for each correct answer.
In the second stage, subjects receive information concerning their Preliminary Gains and they are asked to declare these gains. A certain percentage of these Declared Gains is then deducted from their Preliminary Gains. These deductions are then summed up and evenly divided among the members of the group. Note that in each session the deduction rate is consistent. The deduction treatments implemented in the lab experiments are: 10%, 20% and 30%. Subjects are informed of the audit rate at the beginning of each module and that, if there is an audited discrepancy between the Declared and Preliminary gains, they will be deducted half of the difference between the two values plus the full deduction of the Preliminary gains.
At the end of each round participants are informed of their Preliminary and Declared gains; the amount they receive from the group deductions; and their earnings in the round. Subjects are paid for one out of the ten rounds in each lying module at the end of the experiment, and do not receive feedback about earnings until the end of the experiment. Further details of these experiments are provided in the Appendix and in Duch, Laroze, and Zakharov (Reference Duch, Laroze and Zakharov2018).Footnote 9
We also conduct an online version of the lying experiment with three different subject pools—the same student subject pool eligible for the lab, a general population UK panel (CESS online), and U.S. MTurk workers. The only substantive differences are that: (1) participants play one cheating module of 10 rounds instead of the two modules that exist in the lab version. The second cheating module is omitted to reduce the length of the experiment.Footnote 10 In the lying module there is either a 0% or 10% audit rate that is fixed throughout the session. (2) There are only on-screen instructions. (3) The conversion rate is lower, at 1000 ECUs = £1 for UK samples (US $1 for Mturk) (compared to the 300 ECUs = £1 in the lab).
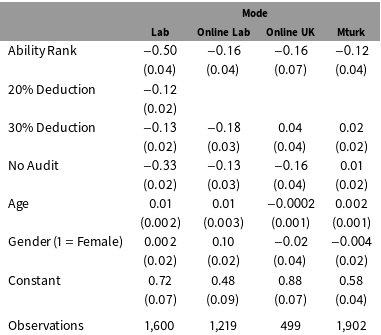
GLM estimation on percent declared.
3.2 Treatment Effects
Subjects in all experiments were assigned to similar deduction and audit treatments. Our general expectation is that report rates will drop as deduction rates rise (a.k.a. higher lying); report rates will be lower when there is no auditing of income; and those who perform better on the RET will lie more about their income.
Table 1 reports results for the regression model with the percent of income reported as the dependent variable. To estimate treatment effects, we include two dummy variables for the 20% and 30% deduction rates, and a “No Audit” dummy variable. The covariate ability is measured by the rank of one’s average performance across all experimental rounds relative to all other participants (normalized between 0 and 1, where 1 is the highest performer). In addition, we include age and gender as further controls. The baseline is the 10% deduction rate and a 10 percent audit rate.
The Deduction dummy coefficients are negative and significant for the lab subject pools (but not for the online subject pools). And the Audit dummy variable is negative and significant in three of the four models. For the four online and lab models, the estimated coefficients for Ability Rank are, as expected, negative and significant in all four equations. The lab results stand out as being most consistently supportive of our conjectures. The experiments outside of the lab are less consistently supportive although again not contradictory.
The estimated effects reported in Table 1 are significant and in the expected direction for the lab experiments; there is more variability in direction and significance for the online multivariate results. In the Appendix we report the Wild and PCB  $p$ values for the coefficients reported in Table 1, which further indicate that effects for online experiments are much more imprecisely estimated.
3.3 Heterogeneous Mode Effects
Table 1 suggests a straightforward estimation strategy for identifying heterogeneous mode effects. We run separate generalized linear models (GLMs) for each mode, and there clearly is a pattern in the estimated coefficients suggesting variation in treatment effects across modes. Note that the deduction rate treatments are particularly significant, and in the correct direction, for the lab and online lab modes—but weaker and incorrectly signed for Online UK and MTurk. The “No Audit” treatment is quite large, significant and correctly signed for the Lab experiment but weaker for Online Lab and Online UK and indistinguishable from zero for the MTurk experiment. And the coefficient for ability is strongly negative for the Lab mode but smaller for the other three modes. And demographic covariates are significant in some, although not all, modes.
The GLM estimation in Table 1 may be a perfectly reasonable specification for a model explaining lying behavior. It may not be the most conservative strategy for identifying heterogeneous treatment effects, however. The possible complication is that we are effectively imposing a particular specification (“ad hoc variable selection”) that might not be optimal for identifying heterogeneous mode effects (Imai and Ratkovic Reference Imai and Ratkovic2013, p. 445). At least with respect to estimating possible heterogeneous mode effects typically we have no a priori expectations as to how mode interacts with either the treatment or other covariates. Nor do we necessarily have any priors on how other covariates interact with treatment itself.
To avoid imposing a restrictive structure on the estimated treatment and covariate effects, and their interactions, we estimate CATEs for the combined data from identical experiments using an iterative, machine learning-based statistical method. As many have pointed out, there are significant advantages to automating this estimation by employing nonparametric iterative estimation techniques (Imai and Strauss Reference Imai and Strauss2011; Green and Kern Reference Green and Kern2012; Athey and Imbens Reference Athey and Imbens2017; Grimmer, Messing, and Westwood Reference Grimmer, Messing and Westwood2017; Wager and Athey Reference Wager and Athey2018). These techniques allow us to assess whether experimental modes condition estimated treatment effects (Imai and Strauss Reference Imai and Strauss2011; Green and Kern Reference Green and Kern2012). Hence, we estimate CATEs for subjects sharing particular values on all combinations of relevant covariates including the experimental modes in which they participated.
In spite of the relatively large sample, the number of subjects populating any one unique covariate/mode value will be relatively small. With so few observations sharing any one of these unique covariate values, estimated differences in CATEs are likely to be driven by random variation in the small samples (Athey and Imbens Reference Athey and Imbens2017; Grimmer, Messing, and Westwood Reference Grimmer, Messing and Westwood2017). The challenge then is to estimate heterogeneous effects that distinguish systematic responses from differences that are the result of chance random assignment.
A number of techniques have been proposed for overcoming this limitation in estimating the response surface for any treatment variable conditional on particular covariates. Grimmer, Messing, and Westwood (Reference Grimmer, Messing and Westwood2017) present an excellent overview and suggest estimating a weighted ensemble of such estimators. In the main text we present the results of one machine learning-based strategy we believe is well-suited to estimating mode-related heterogeneity: Bayesian Additive Regression Trees (BART) (Hill Reference Hill2011; Green and Kern Reference Green and Kern2012).
BART is the Bayesian adaptation of the frequentist classification and regression tree (CART) strategy for estimating models that repeatedly divide up the sample into increasingly more homogeneous subgroups. Fitted values of the outcome variable are estimated for all of the terminal nodes of a tree which will reflect ranges of covariate values in addition to treatment status. Given a regularization procedure to prevent model overfit (Mullainathan and Spiess Reference Mullainathan and Spiess2017), the resultant estimates prove useful for estimating treatment heterogeneity across a vector of treatment assignments and covariates.Footnote 11
BART has several advantages. First, as with other supervised-learning methods, it takes the substantial decision about the functional form of the model out of the hands of the researcher. As the number of potential covariate–treatment interactions increases, the benefits of automating this aspect of estimation are greater (given the greater chance of model misspecification). Second, BART results are relatively robust to experimenters’ choice of pruning parameters (Green and Kern Reference Green and Kern2012). As a result, observed heterogeneity in CATEs across modes is less likely to be the result of idiosyncratic parameter selection. Third, even when outcomes are linear with treatment, BART’s performance is very similar to the results of linear models (Hill Reference Hill2011). As we demonstrate below, even with a relatively small number of covariates, the results of the BART procedure nevertheless confirm the intuitions of the separate GLM models in Table 1. Finally, BART more easily enables us to recover individual CATE estimates, and to visualize mode heterogeneity in an informative way.
BART employs an MCMC algorithm for generating individual estimated outcomes given the covariate values of interest. For a set of  $N$ observations, and a
 $N\times C$ vector of covariates including the treatment variable, BART generates a posterior draw of 1,000 predicted values for each unique treatment and covariate profile after a model burn-in phase (Green and Kern Reference Green and Kern2012). We treat the average of each of these 1,000 draws as the estimated outcome given the observed treatment value and covariate profile.
Since the implemented BART procedure predicts outcomes rather than coefficients, we recover CATE estimates by first simulating outcomes for the observed data, and then for a set of counterfactual observations. For the first set of simulated outcomes the BART model takes as inputs the outcome variable of the study (in our case lying) and a training data matrix consisting of the actual treatment assignments and covariates of interest. The second set of simulated outcomes is based on a separate “test” data matrix. This dataset contains “synthetic” observations that are identical to the training data, except that the treatment assignments are reversed. The test dataset does not influence the estimation procedure itself. Rather, these counterfactual cases are used postestimation to predict counterfactual outcomes given the results of the BART model using the observed, training data. Estimating outcomes for both the observed and counterfactual observations ensures that for any unique set of covariates that have treated cases there will be a matched set of counterfactual “control” cases at that set of values, and vice versa. The CATE for the various covariate values is simply the difference between the predicted outcome for the covariate value in the training dataset and the corresponding observation in the synthetic, test dataset.
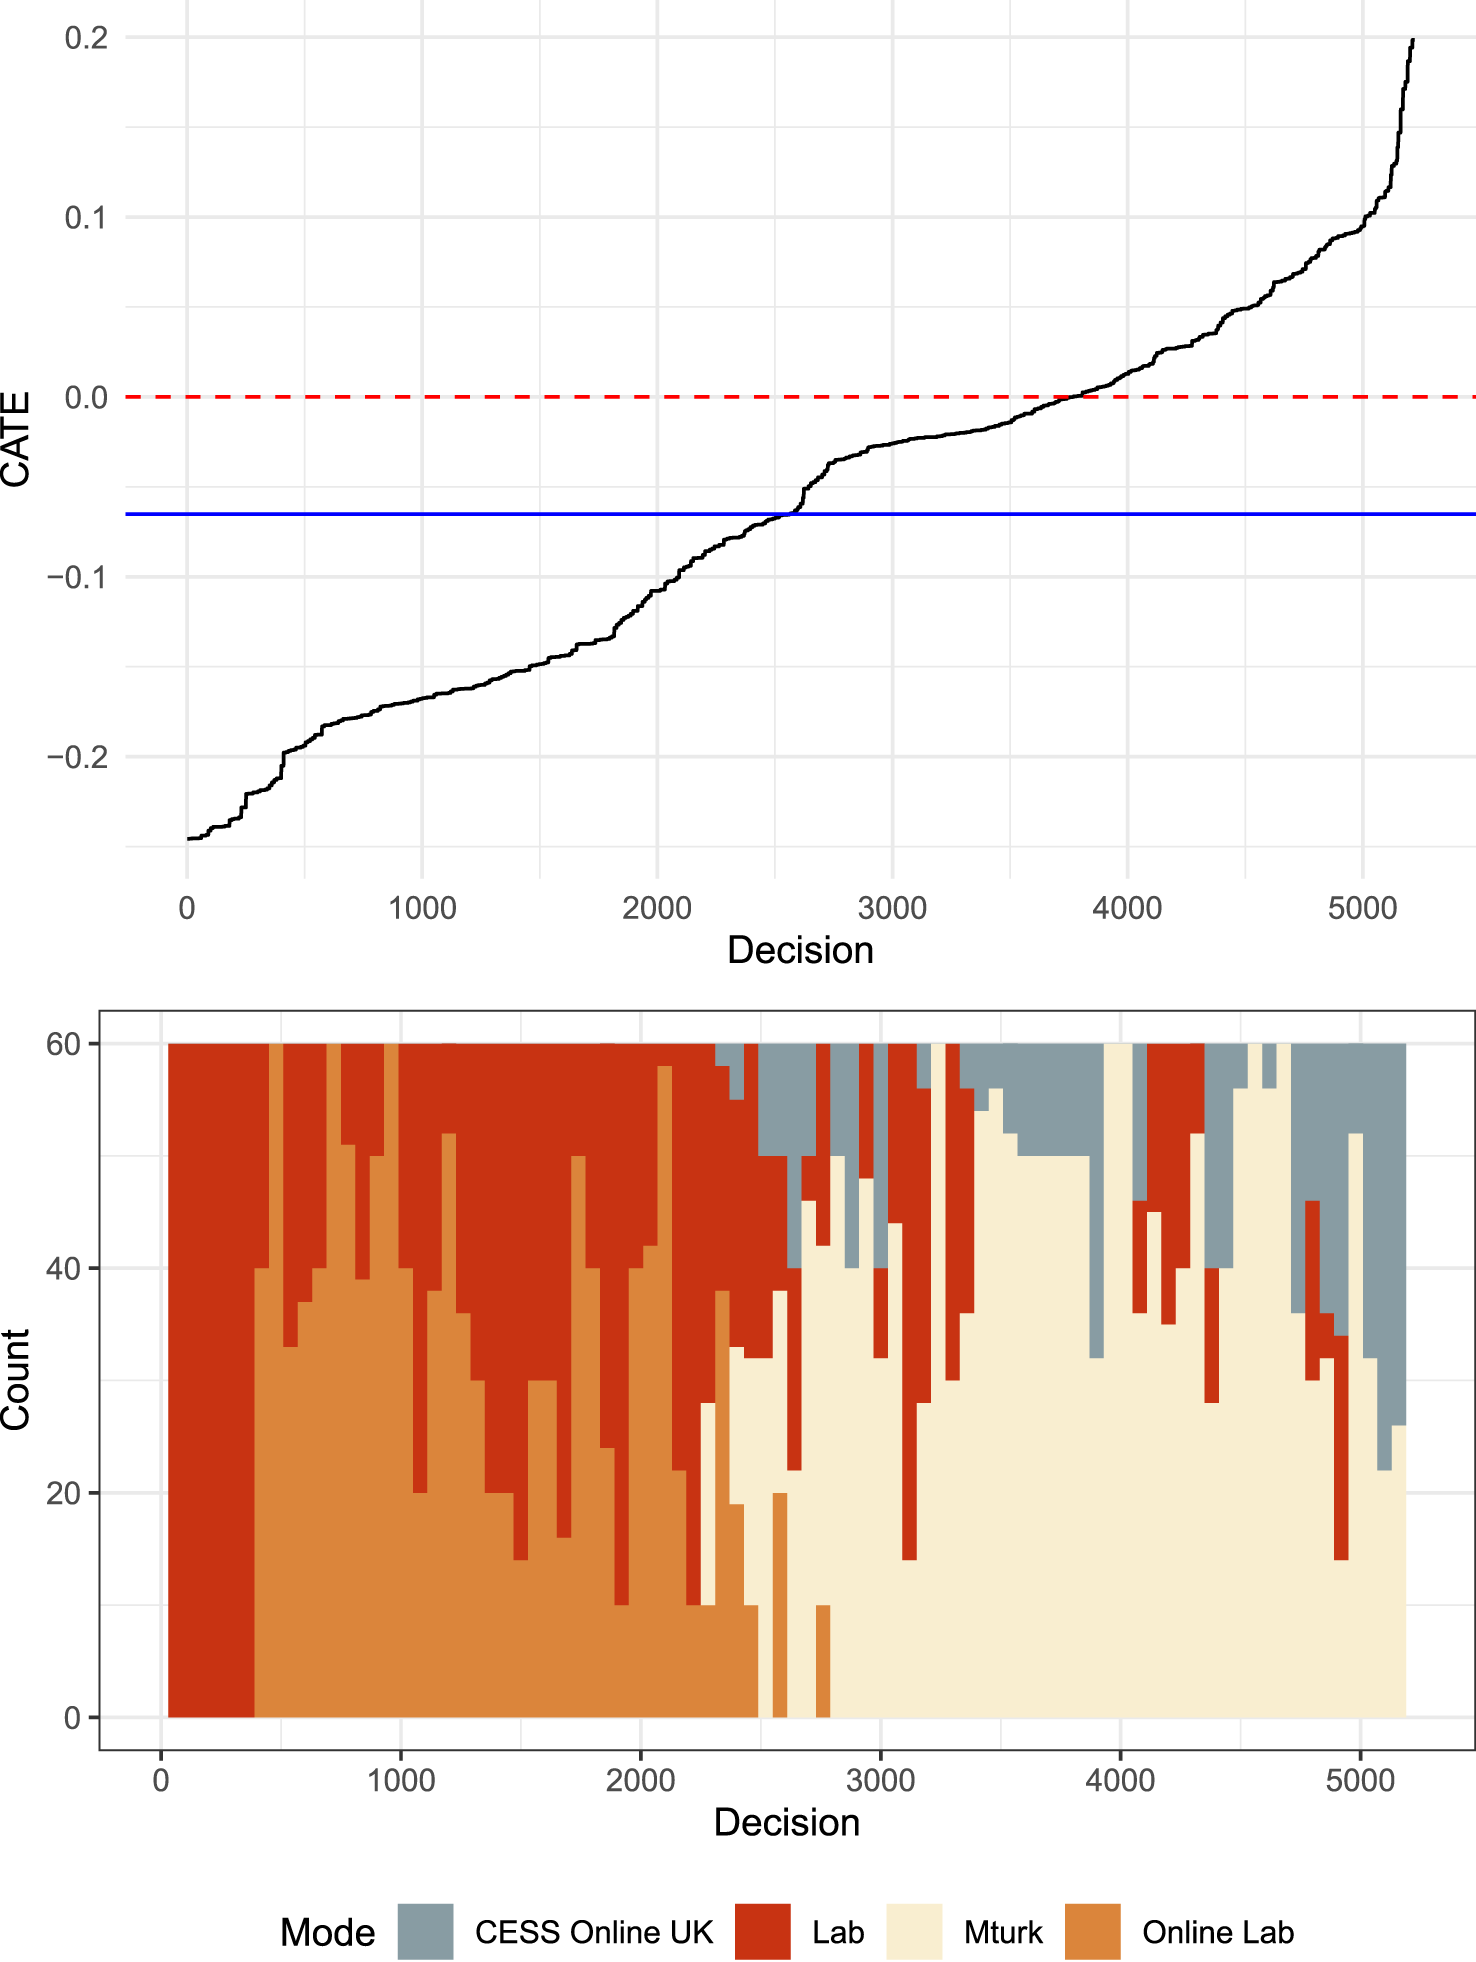
BART estimated heterogeneous effects by mode; predicted CATEs (top panel) and corresponding histogram of mode distributions (bottom panel).
A CATE is estimated for each subject based on their individual vector of treatment and covariate values. This specification uses the same covariates as in Table 1—age, gender, and ability rank—except here we pool observations across mode rather than estimating individual mode-specific models. Consequently, the ability rank covariate is now calculated with respect to the entire pooled sample, rather than individually within each mode. Our BART model of heterogeneous effects is generated using the BayesTree R package with inputs described as above. All other options within BayesTree are left at their default value.
The distribution of CATEs organized by magnitude along with the histogram of covariate and mode/sample pool profiles are presented in Figure 2. The overall average ATE is  $-0.07$ and the range over all the covariate values is
 $-0.25$ to 0.20. The distribution of CATEs generated by BART suggests that about 70 percent of the CATEs are negative which is consistent with the initial conjecture and with the estimated ATE in Table 1. About half of the CATEs were less than
 $-0.07$ suggesting that to the extent that there is subject heterogeneity it tends to be consistent with the direction of the ATE.
The overall treatment effect is negative but there is distinctive mode-related heterogeneity. The histogram in the lower part of Figure 2 provides a sense of how experimental modes influence the magnitude of treatment effects. Participants from the classic lab subject pool—whether they play the game in the lab or online—exhibit the highest Deduction Treatment effects. Most of these subjects have treatment effects that are more negative than the ATE of  $-0.07$. Online subjects from either MTurk or CESS Online for the most part had CATEs greater than
 $-0.07$; and over half of these subjects (MTurk or CESS Online) had CATEs that were incorrectly signed.
In total we observe over 5,000 decisions in four identical experiments conducted with different modes. We estimate the impact of their ability on lying. Automated iterative statistical estimators allow us to identify whether any particular covariates, including our four experimental modes, are responsible for heterogeneity in treatment effects. Two different such estimations of heterogeneity effects, one reported here and the other in the Online Appendix, result in very similar conclusions: treatment effects differ by mode. Treatment effects for MTurk and CESS Online modes were smaller than expected.
Implementing multi-mode replications along with automated iterative estimation is a powerful diagnostic tool for identifying potential mode-related experimental measurement error. But since subjects in our, and most typical, experiments are not randomly assigned to modes (unlike Gooch and Vavreck Reference Gooch and Vavreck2019), resulting evidence, or lack of, should only be treated as an indirect indicator. The concern, of course, is that there are variables (unrelated to experimental measurement error), that we have not accounted for in the estimation and that covary with mode. In our illustration for example, those subjects who participate via MTurk are unlikely to be similar to student participants who sign up for in-lab experiments. Our BART estimation strategy does include relevant covariates like age and gender that mitigate mode-related effects being confounded by demographic biases across mode. But of course these do not exhaust the subject characteristics that might be confounders here.
This particular diagnostic tool should be the point of departure—it establishes the likelihood of (or absence of) mode-related experimental measurement error. We suggest two subsequent diagnostic phases that assess whether any mode-related heterogeneity signals actual experimental measurement error.
4 Experimental Measurement Error
Observing mode-related heterogeneity in CATEs is not particularly informative unless the research design incorporates explicit measurement error identification strategies. A second diagnostic component of the design, that we address now, determines whether mode-related heterogeneity actually signals experimental measurement error. We illustrate how embedded metrics in the experimental protocols can indicate whether mode-related heterogeneity reflects experimental measurement error. These illustrations focus on both random and systematic measurement errors.
4.1 Random Measurement Error Metrics
Random measurement error in the outcome variable can reduce the precision of estimated treatment effects. There is a growing recognition that an effective strategy for estimating experimental measurement error is to observe subjects making lots of decisions—either very similar, or identical, decisions or decisions that we expect to be related in a predictable fashion (Engel and Kirchkamp Reference Engel and Kirchkamp2018; Gillen, Snowberg, and Yariv Reference Gillen, Snowberg and Yariv2019).Footnote 12
In the Duch, Laroze, and Zakharov (Reference Duch, Laroze and Zakharov2018) experiment, subjects repeat, a minimum of 10 times (20 for students in the Lab), an identical RET. After the RET, they make an identical decision, again at least 10 times, as to how much of the earned income to report and be subject to a deduction rate.Footnote 13 An indicator of measurement error is the variability of the subjects’ observed behavior within a particular deduction and audit rate treatment. For a particular deduction and audit rate treatment we compare the variability of subjects’ behavior on these two tasks over the 10 rounds (intrasubject variability) with its variability across subjects (intersubject variability). We calculate the Intraclass Correlation Coefficient (ICC) which is simply the ratio of the between-cluster variance to the total variance. It indicates the proportion of the total variance in reported earnings that is accounted for by the subject clustering. We can think of it as the correlation among scores for any particular subject. Our expectation is that intersubject variability should account for much of the total variance—hence a high ICC. Moreover, the null hypothesis is not simply that the ICC is high but also that it is very similar across quite different modes.
Comparison of ICCs across modes for both outcome and RET.
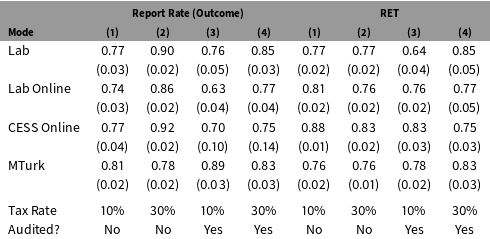
Table 2 presents the ICC for the two variables, performance on the RET and the percent of RET earnings reported in the experiment. The columns correspond to different deduction/audit rate treatments. ICCs are reported separately for each of the four experimental modes. Bootstrapped standard errors are shown in brackets. For both the RET performance and reported earnings variables, overall ICCs are quite high, and consistently so, across treatments for subjects in all four modes. In the case of reported earnings, the one potential outlier here is the 0.63 ICC estimated for the Lab Online mode.
Subjects in this experiment, at least with respect to the outcome variable, appear to behave quite consistently across many rounds of identical decision-making tasks. And consistent behavior is observed across quite different experimental modes. There is little evidence at least for these two metrics to suggest that random measurement error is correlated with experimental mode.
4.2 Systematic Measurement Error
A source of systematic measurement error is under- or overreporting preferences or behaviors measured by the outcome variable (e.g., Gooch and Vavreck Reference Gooch and Vavreck2019). The range of behavioral outcomes studied by social scientists that are plausible candidates here is vast: vote buying and other types of corrupt behavior, voting turnout, lying, tax compliance, criminal activity, etc. Systematic misreporting biases treatment effects. Incorporating diverse experimental modes in the design can facilitate the detection of this systematic measurement error.
The challenge is incorporating features into the experimental design that convincingly identify whether measurement error is generated by misreporting (Blattman et al. Reference Blattman, Jamison, Koroknay-Palicz, Rodrigues and Sheridan2016). Lying about earnings, the outcome variable in our experiment, is plausibly a sensitive choice for subjects to make. And there is an extensive measurement literature on how reporting of sensitive behavior varies by experimental, or survey, mode (Tourangeau and Yan Reference Tourangeau and Yan2007). We assume here that diverse experimental modes trigger varying concerns regarding the social desirability of certain reported behavior. There clearly is evidence that treatment effects in our experiments are not significant in some modes—possibly the result of underreporting.
The mode-related heterogeneity in CATEs observed in Figure 2 indicated that subjects in the MTurk and CESS Online modes had CATEs closer to zero or, for many, incorrectly signed. This could result because these participants from online subject pools are hesitant to lie about their earnings. We are able to compare the rates of lying across experimental modes that can provide some insight into whether underreporting might be a source of measurement error. The left-hand graph in Figure 3 reports the incidence and magnitude of lying across the four modes.
Comparing percentages of actual earnings reported for all modes (left panel) and online modes by age (right panel).
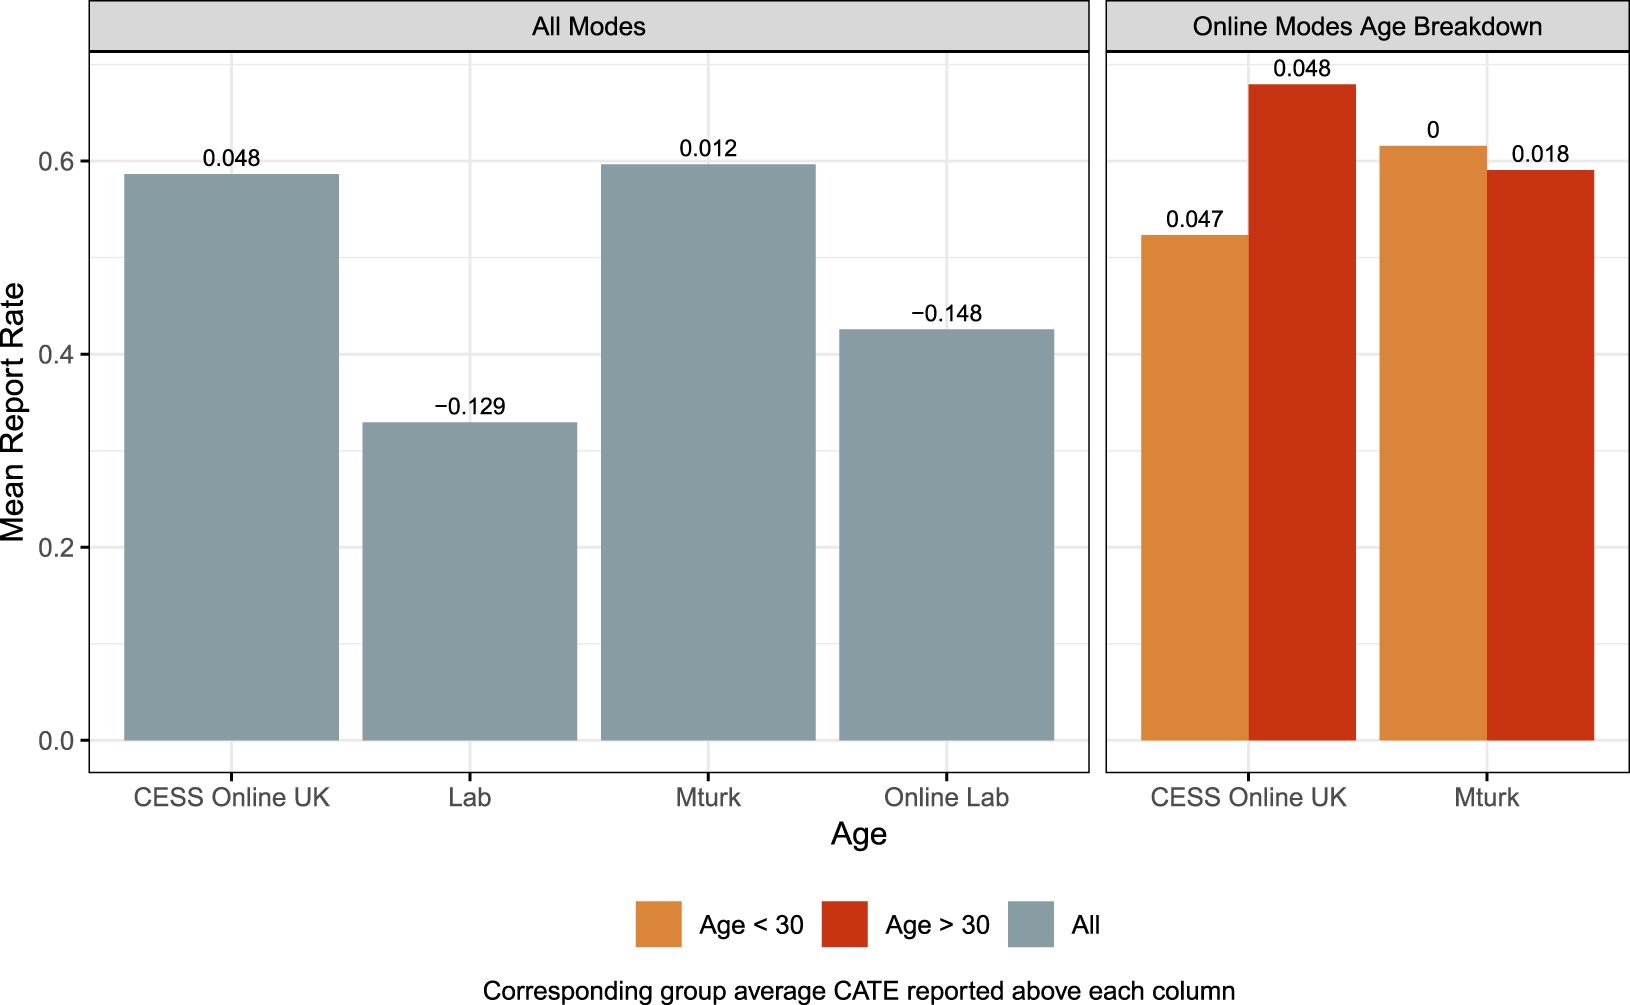
There are two behavioral differences that stand out for the zero-audit condition in Figure 3. First, subjects, for the most part Oxford undergraduate, drawn from the lab subject pool (Lab and Online Lab) are more comfortable lying about their earnings. Second, subjects from the online subject pools (CESS Online and MTurk) are more hesitant about lying. In the zero-audit condition, lab subjects overall report between 30 and 40 percent of their earnings while online subjects report about 60 percent of their gains. These results are consistent with the notion that underreporting on the outcome variable (lying) contributes to the null findings observed in Figure 2 for the MTurk and CESS Online modes.
An alternative explanation, of course, is that age and mode are confounding variables in these comparisons. The observed higher levels of earnings reported for CESS Online and MTurk modes might simply reflect the presence of older subjects in the sample (the lab samples were students and hence essentially young). The right-hand graph in Figure 3 indicates this may not be the case. Here we control for the subjects over and under 30 years of age for the zero-audit condition. For the CESS Online mode there is some evidence here that older subjects drive some of the underreporting. But for the MTurk modes the two age cohorts have essentially identical levels of reporting (or lying).
There is some evidence here that subjects from online subject pools, MTurk in particular, are reluctant to lie about their earnings; and, at least in the MTurk case, this does not seem to be related to the age differences between online and lab subject pools. As discussed previously, underreporting (lying in this case) can bias the estimated treatment effect to the null. The average CATEs for each of these modes are consistent with this notion—they are reported on the top of each bar in Figure 3. CATEs are significantly negative, as hypothesized, for those modes where subjects are clearly willing to lie about their earnings. And we see a much more muted treatment effect for those modes where subjects are generally reluctant to lie. Moreover, the muted treatment effect is similar for both young and old subjects. This suggests that the less negative CATEs estimated for the MTurk subjects are the result of a reluctance to lie on the part of both young and old alike.
Subjects from the CESS lab subject pool, regardless of whether they played the game online or in the lab, were significantly more likely to lie than was the case for CESS Online or MTurk subjects. Moreover, this difference persists for the MTurk mode even when we control for age, i.e., comparing the lab subject pool (who are essentially all young students) with young subjects from the MTurk subject pools (younger subjects who are not necessarily students). As a result, the treatment effects in Figure 2 are much larger for subjects from the Oxford lab subject pool, regardless of whether they played in the lab or online.
As part of the multi-mode replication design, the experimental protocol should anticipate this second component of the diagnostic process. Initial evidence of mode-specific heterogeneity simply signals the possibility of experimental measurement error. In this section, we proposed incorporating measurement metrics within the experimental protocol that allow researchers to assess the magnitude of measurement error in different modes.Footnote 14
5 Measurement Error by Design
The third microreplication diagnostic explicitly manipulates measurement error in order to determine which experimental mode exhibits higher levels of measurement error. Our contention is that estimated treatment effects will respond differently to these manipulations depending on the extent of measurement error inherent to the mode. This diagnostic therefore helps increase our “ $\unicode[STIX]{x1D707}$-informed” priors about certain modes. The notion of experimentally manipulating measurement error builds on similar efforts by de Quidt, Haushofer, and Roth (Reference de Quidt, Haushofer and Roth2018), for example, who employ such manipulations to identify the bounds of experimenter demand on estimated treatment effects.
5.1 Diagnostic Logic
Suppose we observe  $\text{ATE}_{1}<\text{ATE}_{2}$ and our “
 $\unicode[STIX]{x1D707}$-informed” prior is that Mode 2 has significantly less measurement error. By explicitly manipulating additional measurement error across these two modes we can gain insights into whether Mode 2 really does have less measurement error. Let
 $m\in \{\text{C},\text{M}^{+},\text{M}^{-}\}$ be the measurement error manipulation arm in a factorial design (where C is a control arm). Thus,
 $\text{ATE}_{k,m}$ is the average treatment effect in mode
 $k$ for measurement error manipulation
 $m$. Each arm in this example has a control and single treatment group such that
 $\text{ATE}_{k,m}=E[Y|k,m,T=1]-E[Y|k,m,T=0]$.
The two proposed manipulations are designed to inflate and suppress measurement error respectively in order to signal which mode exhibits less inherent experimental measurement error. The first manipulation,  $M^{+}$, inflates measurement error such that both the control and treatment conditions within this arm have high levels of measurement noise (relative to arm C). Conversely,
 $M^{-}$ explicitly depresses measurement error. This arm is particularly useful for any mode with high inherent measurement error since, if it is biased by measurement error, then suppressing it should lead to a convergence toward the estimates in modes with lower inherent measurement error.Footnote 15
We can observe an ATE for each combination of mode and measurement error manipulation. The comparisons of the ATEs under  $M^{+}$ and
 $M^{-}$ to the ATEs under
 $C$ are the diagnostics of interest. Again, our expectation is that modes with different amounts of inherent measurement error should respond differently to these manipulations. Increasing measurement error in Mode 1, with already high inherent measurement error, should have relatively small effects on the estimated treatment effect. And any observed effect will be toward the null. In other words, we should expect that
 $\text{ATE}_{1,M^{+}}=\text{ATE}_{1,C}\geqslant 0$. Conversely, in Mode 2 where we expect to find little measurement error, the additional noise should substantially reduce the treatment effect:
 $\text{ATE}_{2,C}>\text{ATE}_{2,M^{+}}\geqslant 0$. Separately, with respect to Mode 1, since
 $\text{ATE}_{1,M^{-}}$ is the observed treatment effect having suppressed measurement error in a mode with inherent measurement error, this manipulation should significantly increase the treatment effect. Our expectation here then is that
 $\text{ATE}_{1,M^{-}}>\text{ATE}_{1,C}\geqslant 0$.
5.2 Illustration
To demonstrate this diagnostic, we implemented a survey vignette experiment as part of the Nuffield CESS 2019 Vote India election study.Footnote 16 Vote India was an election study conducted with 2,734 participants from the CESS India Online subject pool and 10,036 MTurk India workers—excluding participants with partial responses. The simple survey vignette experiment aims to assess the ability of the Indian general public to identify fake election news stories. The theme of the news stories was the reliability of electronic voting machines used to tally votes in 2019 Indian Lok Sabha elections.Footnote 17 We implemented the experiment in two different modes during the period April 2–26, 2019: MTurk workers from India (equivalent to our Mode 1), and the CESS India Online subject pool (equivalent to our Mode 2). As part of the initial design we included treatment assignments to identify heterogeneous mode effects that could be associated with measurement error. Again, our primary goal is to leverage multi-mode microreplications to learn about experimental measurement error.
In this example, for all manipulation arms, the  $\text{ATE}$ is simply the difference in subjects’ perceptions of how truthful the news story was, between those presented with an “authentic” news story and those presented with a “fake” news story. In the “control” arm, the fake (authentic) reporting condition was randomly assigned to 47 (56) MTurk and 53 (42) CESS Online subjects respectively.Footnote 18 Our expectation is that, because of measurement error, the magnitude of
 $\text{ATE}_{1,\text{Control}}$ (MTurk) is significantly lower than
 $\text{ATE}_{2,\text{Control}}$ (CESS Online).
We also implemented two measurement error manipulation arms. In the first (akin to  $M^{+}$) we included a “high-error” version of both the authentic and fake news statements. We deliberately varied the framing in the “high-error” measurement arm (compared to the control arm) so as to create measurement error in fake news detection.Footnote 19 Fake (authentic) versions were randomly assigned to 47 (46) MTurk and 48 (57) CESS Online subjects. The expectation is that
 $\text{ATE}_{\text{MTurk},\text{Control}}\geqslant \text{ATE}_{\text{MTurk},\text{High}}=0$ and
 $\text{ATE}_{\text{CESS},\text{Control}}>\text{ATE}_{\text{CESS},\text{High}}>0$.
The second measurement manipulation (akin to  $M^{-}$) was implemented for the MTurk subjects only. This “attention-incentivized” version of the vignette experiment was designed to explicitly reduce inattention that we conjectured was partially responsible for the low treatment effect in this mode. Subjects were asked to complete exactly the same fake news detection task as in the other two manipulation arms. But in this version respondents also saw the following text: “On the following page, after you indicate how truthful or false the statement is, we will then ask you a factual question about the statement itself. If you answer this factual question correctly, you will be paid an additional 25 INR.” The factual question asked participants to select which institution was mentioned in the vignette text (the Indian Electoral Commission). Our goal here is to reduce measurement error resulting from inattention by both signaling that there would be a treatment check (a factual question about the treatment) and incentivizing correct answers. The incentivized version of the experiment was fielded on a further 200 subjects (high-error arm: 64 authentic news, 47 fake news; control arm: 44 authentic news, 45 fake news). The expectation is that with additional incentives, the same control and high-error manipulation treatment effects for MTurks will be significant—hence resembling the CESS Online treatment effects:
 $\text{ATE}_{\text{MTurk},\text{Control},\text{Attention}}>\text{ATE}_{\text{MTurk},\text{High},\text{Attention}}>0$ and
 $\text{ATE}_{\text{MTurk},\text{Control},\text{Attention}}>\text{ATE}_{\text{MTurk},\text{Control}}$.
Results for the nonincentivized conditions are reported in the first four rows of Table 3. There is a much greater treatment effect for CESS Online compared to MTurk subjects ( $\text{MTurk}<1$, and CESS Online
 ${>}$ 3). A design relying exclusively on the MTurk mode would favor the null—the inability of subjects to detect fake news. This is also consistent with our initial priors—that the MTurk treatments would have considerable measurement error depressing estimated treatment effects. On the other hand, and again consistent with our priors, the CESS Online treatment effects in rows 3 and 4 are large and statistically significant. Moreover, the treatment coefficients for all four models are essentially the same when we include controls for age and gender (see Appendix for full results). A possible conclusion here is that MTurk subjects are considerably less attentive than CESS Online subjects and hence were effectively not being “treated.” The result is an insignificant treatment effect.
Induced measurement error model results.
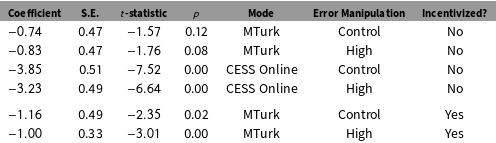
As expected, inflating the measurement error had no effect on the MTurk treatment effects—the control and high-error ATEs are similarly small and insignificant. Again, as expected, we do see treatment effects drop (by over one standard error) when we introduce identical measurement error for the CESS Online subjects. These differential responses to the measurement error treatments suggest that the MTurk mode results are depressed by experimental measurement error. This could very well be the result of MTurker’s inattention, or even MTurk bots that increase measurement error. We interpret the impact of the high-error version of the treatment effect for CESS Online subjects as an indication of relatively subdued experimental measurement error—particularly in contrast to the MTurk results. Adding measurement error to an experimental context with little prior measurement error should moderate the treatment effects although note they are still substantial and significant in the high-error manipulation.
The final two rows of Table 3 help assess the conjecture that at least some of the measurement error depressing the MTurk treatment effect results from inattention. 131 of 200 subjects correctly identified that the text mentioned the Indian Electoral Commission. Even with financial incentives, over a third of the sample failed to pay sufficient attention to answer a straightforward descriptive question. The estimated ATE for both control and “high-error” manipulations of the vignette are substantively larger than their unincentivized counterparts. Both coefficients are statistically significant, and the ATE of the control arm is now moderately larger than the corresponding “high-error” arm. There is strong evidence here that by experimentally reducing MTurk inattention to treatments we obtain results more comparable to those for the CESS India Online subjects.Footnote 20
These fake news detection results illustrate our broader theme of the importance of designs that identify mode-specific heterogeneous treatment effects. Certainly in this case it could be problematic to rely exclusively on the MTurk mode. Our specific goal in this section though is to suggest a third diagnostic strategy for determining whether mode-specific heterogeneous treatment effects are a product of experimental measurement error. Having observed mode-specific heterogeneity, we recommend designing measurement error experiments that directly assess the underlying source of the error. In our case, we designed treatments that explicitly manipulated the contextual features of the experiment that are claimed to cause experimental measurement error.
6 Discussion
Technology, ingenuity and cost have all contributed to the diversity and accessibility of experimental modes available to the average researcher. We should exploit this rich diversity of experimental modes in order to understand and address experimental measurement error in our replications. Most recognize that reported effect sizes will be an artifact of the context in which treatments are assigned. The interesting challenge is to understand the source and magnitude of this experimental measurement error. Our contribution in this respect is twofold: first we explain why multi-mode designs are informative about experimental measurement error, and second we provide suggestions for deploying multi-mode designs as a diagnostic tool.
We assume there is some mode-related heterogeneity in experimental measurement error and researchers are reasonably adept at detecting this measurement error. With these quite reasonable assumptions, we demonstrate that multi-mode replication designs are clearly the most informative about experimental measurement error.
Our recommendation is to incorporate numerous diverse experimental mode replications in the design—in our example we had four distinct modes. One of the diagnostic contributions of the essay is a simple machine learning-based strategy that identifies heterogeneous treatment effects. The researcher imposes no a priori specification on the nature of the potential heterogeneity. CATEs are generated for all subjects across all experimental modes. We then show how mode-specific heterogeneity can be estimated and viewed graphically. The absence of mode-specific heterogeneity speaks to the robustness of the estimated treatment effects.
We recommend BART because it is a flexible estimation strategy. As the number of potential covariate–treatment interactions increases, the benefits of BART over linear regression strategies also increase. Given the ease of implementing BART estimation, its robustness to varying numbers of covariates, and its accurate predictions regardless of covariate length (Hill Reference Hill2011), we believe the procedure should be used as the standard means of estimating both CATEs and mode-related heterogeneity.
That said, the choice of machine-learning estimator should depend on the nature of the data and the data generating process itself. In the Appendix we demonstrate the results of one alternative strategy—LASSO models—but other machine-learning strategies include using ensemble methods (Grimmer, Messing, and Westwood Reference Grimmer, Messing and Westwood2017) and metalearning to handle treatment-assignment imbalances (Künzel et al. Reference Künzel, Sekhon, Bickel and Yu2019).
Ultimately multi-mode replication designs are powerful where researchers are able to demonstrate that mode-specific heterogeneity is (or is not) related to experimental measurement error. To resolve the quandary of contradictory treatment effects observed for identical experiments administered in different modes, we suggest diagnostic tools for detecting experimental measurement error. Embedding measurement items can help determine whether modes exhibit systematic or random measurement error. Our examples included measurement scales (Are respondents scaling as we would expect them to?); repeated measures (Are their answers correlated over time?); and indicators of sensitive questions (Are subjects underreporting certain behaviors or preferences?).Footnote 21 Separately, implementing measurement experiments that directly manipulate levels, and types, of measurement error enable researchers to test for the presence and nature of experimental measurement error.
Funding
This work was supported by the Nuffield College Centre for Experimental Social Sciences; and Raymond Duch’s Google Faculty Research Award [2014_R1_147].
Data Availability Statement
The replication materials for this paper can be found at the Political Analysis Dataverse, doi.org/10.7910/DVN/F0GMX1 (Duch et al. Reference Duch, Laroze, Robinson and Beramendi2019).
Conflicts of Interests
The authors have no conflicts of interests to disclose.
Research with Human Subjects
All of the experiments received ethical approval from Nuffield College CESS Ethics. Details of the Nuffield College CESS ethical guidelines and ethical review procedures are available here: https://cess-nuffield.nuff.ox.ac.uk/ethics/. Data privacy and data integrity procedures are here: https://cess-nuffield.nuff.ox.ac.uk/data-protection-and-privacy-general-experiment-guidelines/.
Supplementary material
For supplementary material accompanying this paper, please visit https://doi.org/10.1017/pan.2019.34.



