I. INTRODUCTION
Thermal transport in the fuel elements is a phenomenon of critical importance for reactor operations. The performance of nuclear fuels in general and UO2 fuels in particular strongly depends on the operating temperature. Making accurate measurement and developing predictive models of the fuel thermal conductivity are essential components of fuel performance assessment. Extending the operation limit of nuclear fuels also calls for accurate fuel thermal conductivity evaluations to predict microstructure evolution, fission gas release, and fuel swelling at high burnup levels. Significant research was conducted to address this need since the 1960s, and several review articles summarize the available experimental data and the effects of various factors on the oxide fuel thermal conductivity.Reference Martin1–Reference Lucuta, Matzke and Hastings4 Among these factors, the most critical are fuel porosity and fuel stoichiometry.
Porosity is introduced to the oxide fuel either by fabrication (sintering) or during irradiation of the fuel in the reactor via fission products and gas bubble formation. Fuel porosity varies in both size and morphology and tends to be distributed heterogeneously in the fuel pellet. A correction factor is often used to characterize the effect of porosity on thermal conductivity of oxide fuels.Reference Hayes and Peddicord5,Reference Inoue, Abe and Sato6 In this approach, the effective thermal conductivity of the fuel is given by:
 $$k = k_0 \times f\quad ,$$
where k is the effective thermal conductivity of the porous fuel, k 0 is the thermal conductivity of the fully dense fuel, and f is the porosity correction factor.
Several models have been proposed for the correction factor in Eq. (1), emerging from early theoretical studies of porous materials. For example, the modified Leob model accounts for the size, shape, spatial distribution, and the emissivity of the pores.Reference Leob7 The Maxwell–Eucken model, inspired by Maxwell’s work on the electrical transport in heterogeneous mediaReference Maxwell8 and Eucken’s work on alloys,Reference Eucken9 relates the correction factor to the total porosity p and a pore shape factor σ, as shown in Eq. (2):
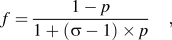 $$f = {{1 - p} \over {1 + ({\rm{\sigma }} - 1) \times p}}\quad ,$$
where σ is equal to 1.5 for spherical pores, larger for flatter pores and smaller for tubular pores.
Extensive experimental studies have been conducted to characterize the degradation of fuel thermal conductivity under irradiation environment in the reactor and to provide validation data for the theoretical models (i.e., selection of parameters in these models).Reference Nikolopoulos and Ondracek10–Reference Wiesenack12 However, the degradation of the fuel thermal conductivity is created by a combination of factors such as fission product accumulation, gas bubble formation, grain growth, precipitation, and the uncertainties associated with either in-pile or out-of-pile temperature measurements are difficult to include in the models. For example, Lucuta et al.Reference Lucuta, Matzke and Hastings4 have studied the effects of burnup (dissolved and precipitated solid fission products), porosity due to fission-gas bubbles, deviation from stoichiometry, and radiation damage on the thermal conductivity of irradiated UO2 fuel and proposed analytical expressions for various correction factors. However, their treatment does not correlate the correction factor to the 3D spatial distribution of pores.
With the advent of computational materials science, at-scale and multiscale (atomistic, meso-scale, and continuum) computer simulation techniques started to add to the experimental studies of the separate effects on thermal conductivity of irradiated materials. For example, finite-element (FE),Reference Hayes and Peddicord5,Reference Inoue, Abe and Sato6,Reference Bakker, Kwast and Cordfunke13 phase-field (PF),Reference Hu, Henager, Heinisch, Stan, Baskes and Valone14,Reference Millett and Tonks15 and Lattice Monte-Carlo (LMC)Reference Fiedler, Belova and Murch16 methods have been applied to model the effect of porosity on changing thermal conductivity of oxide fuels. These simulations have explored a variety of factors such as pore sizes, pore morphologies, and spatial distribution of porosity with respect to grain structures. However, most evaluations of effects of porosity on thermal conductivity are limited to either a unit cell (with one pore) or relatively small regions (a region which contains several grains) and are usually 2-dimensional (2D) treatments.
In this study, we investigate the effect of porosity on the thermal transport in a fuel element with oxide fuel (UO2) and metallic (Zircaloy) cladding using a 3-dimensional (3D) FE method. This work is aimed at investigating the effect of the spatial distribution of pores on the temperature profile in a typical fuel element to improve the understanding of the role of the 3D pore distribution. This is the first step in a series of computational studies that target the impact of heterogeneity on heat and chemical transport in nuclear fuel element for the purpose of optimizing microstructural features of the fuel and improving its performance in the reactor.
II. Computational setup
The coupled heat transport and oxygen diffusion simulations in this study are performed using COMSOL™ simulation package (version 4.3a).Reference Bradley, Cunningham, Lanning and Williford17 The heat transfer was modeled using the “heat transport by conduction” component of the “heat transfer” module in COMSOL. The “mathematics” module was used to implement the oxygen diffusion in the fuel pellet.
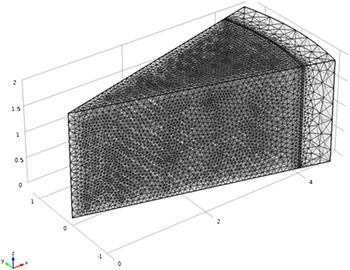
The computational setup consists of a 3D representation of a segment of the oxide fuel element consisting of a cylindrical fuel pellet and Zircaloy cladding separated by a helium gap, as shown in Fig. 1. In the fuel pellet geometry, we create spherical pores of varying size and volume density as discussed below. The fuel pellet radius is 4.095 mm, the helium gap width is 0.033 mm, and the Zircaloy cladding thickness is 0.572 mm, consistent with a reference Westinghouse pressurized water reactor (PWR) design.Reference Duderstadt and Hamilton18 The material properties of the UO2 fuel and helium used in this work are consistent with those reported in Ref. Reference Mihaila, Stan, Ramirez, Zubelewicz and Cristea19, where temperature- and stoichiometry-dependent material properties such as density, thermal conductivity (of the fully dense fuel), heat capacity at constant pressure, etc. are summarized in detail. Thermo-physical properties of Zircaloy are taken from a comprehensive IAEA technical report.20 All material property models are summarized in Table I. A reference calculation has been performed to confirm that the simulation set up was correct as to reproduce exactly the key temperature distribution result from Ref. Reference Mihaila, Stan, Ramirez, Zubelewicz and Cristea19.
3D view of the computational domain and refined mesh.

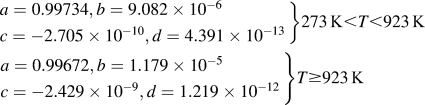
Thermo-physical properties of fuel, He gap, and cladding materials.

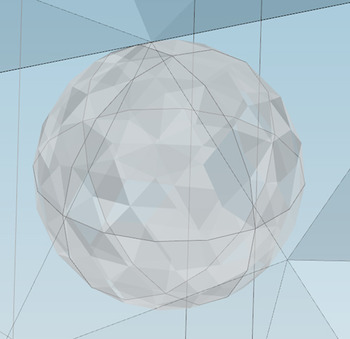
A fine mesh was used throughout the computational domain (Fig. 1). The mesh was refined, using COMSOL capabilities, in the regions of high thermal gradient, such as the gap area, and around the pores. Figure 2 shows the surface mesh elements of a 100 µm-diameter spherical pore where tetrahedron mesh elements on the pore surface can be observed. A mesh refinement study was performed to ensure convergence. The study showed that further mesh refinement changed the resulting centerline temperature of the fuel pellet by less than 0.1 K.
Computational mesh of an individual spherical pore (100 µm in diameter).

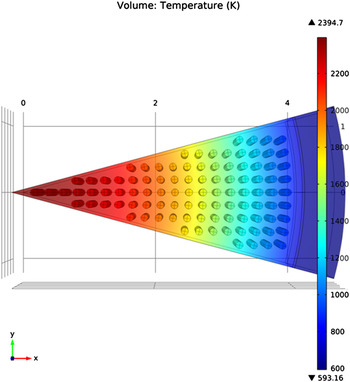
Spherical pores are introduced in the fuel pellet geometry in a systematic way such that the pores are approximately 0.2 mm apart in both azimuthal and axial directions (Fig. 3). The resulting distance between pores on the radial direction is also very close to 0.2 mm. The distance between the uppermost plane of pores and the top surface of the computational domain (segment of the fuel element) is 0.1 mm and so is the distance between the lowermost plane of pores and the bottom surface of the computational domain. These values help maintain the distribution of pores in the volume as uniform as possible. However, there is a certain level of nonuniformity in the distribution of pores in the radial direction. This can be observed in Fig. 3, where partial pores are missing on the boundary planes on both sides of the segment (as marked in the figure). Creating these partial pores introduces extremely detail-oriented and time-consuming mesh generation problems in COMSOL. The implication of this nonuniformity in the radial distribution of pores is briefly discussed in the following section.
Transparent xy-plane view of the computational domain with examples of missing partial pores (arrows).

The focus of this research is on evaluating the effects of 3D spatial distribution of pores on the heat transport in the fuel pellet. To this end, simplifications are in place for this initial evaluation. For example, the spherical pores are treated as insulated cavities, and the heat transport by radiation in the pores is neglected. Complexity will be added gradually as the simulations evolve toward more realistic representations of oxide fuel in the nuclear reactor environment.
In this study, we assume a uniformly distributed volumetric heat source, Q v, in the heat transfer equation,
 $${\rm{\rho }}C_{\rm{p}} {{\partial T} \over {\partial t}} = \nabla \times \left( {k \times \nabla T} \right) + Q_{\rm{v}} \quad ,$$
where ρ, C p, and k are the density, specific heat at constant pressure and thermal conductivity, respectively. The volumetric heat source is equivalent to a linear heat rate of 426 W/cm, which is the maximum linear heat rate of Westinghouse design PWRs recommended in Ref. Reference Duderstadt and Hamilton18. The use of a maximum heat rate rather than an average one is intended to reflect the maximum fuel temperature jump induced by porosity. A Dirichlet type (fixed value) boundary condition for temperature (T b = 320 °C) is applied at the outer surface of the Zircaloy cladding for all simulations carried out in this study. This is consistent with the temperature of the coolant in the nuclear reactor.
Oxygen diffusion in the presence of a temperature gradient (the Soret effect,Reference Janek and Timm27, Reference Korte, Janek and Timm28) is also taken into account as fuel stoichiometry is coupled with the thermal transport.Reference Ramirez, Stan and Cristea29 The modeling of the Soret effect follows the approach adopted by Mihaila et al.Reference Mihaila, Stan, Ramirez, Zubelewicz and Cristea19 As this is not the focus of the paper, the details regarding the oxygen transport are omitted here. However, the oxygen transport is taken into account in the model, so the model retains its physically realistic interpretations of this phenomenon.
One set of nonstoichiometric boundary conditions (x b = 0.0002), which is nearly stoichiometric, is applied at the outer surface of the fuel pellet to illustrate the impact of stoichiometry on fuel thermal conductivity. This latter value is consistent with realistic boundary conditions for UO2 fuel at relatively low burnup levels.Reference Ozrin30 Zero flux boundary conditions for heat transfer and oxygen diffusion are applied at the top and the bottom surfaces as well as all surfaces on both sides in the azimuthal direction of the modeled fuel element segment.
III. RESULTS AND DISCUSSIONS
In this section, we discuss the simulation results emphasizing the effect of porosity size and density on the radial temperature profile in the fuel pellet. Special attention is paid to the impact on the centerline temperature, which is an important parameter in reactor core design.
A. Temperature distribution
The temperature distribution in the segment of the oxide fuel element is calculated by solving Eq. (3). In a series of calculations, the porosity volume fraction is varied by changing the size of the spherical pores while fixing the volumetric number density at about 102 pores/mm3. A range of porosity volume fraction of 2.39 to 30 vol% has been examined in this study corresponding to 74–172 µm-diameter spherical pores. These lower and upper limits are imposed by current computational limitations as spherical pores outside that interval require significantly finer mesh representations of the pores or the regions between the pores. The temperature profile in the nonporous fuel is essentially one-dimensional (radial), whereas the temperature profile in the porous fuel has strong 3D features.
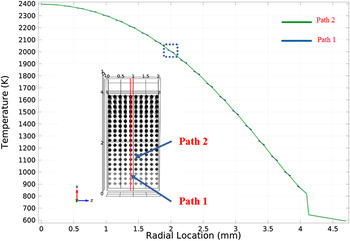
To illustrate this, Fig. 4 shows the temperature profile on two heat transport radial paths in a fuel pellet with uniformly distributed 100 µm diameter pores. Path 1 is a radial line going through the body centers of all spherical pores in the middle of the center plane of the pellet where the effect of the pores on the heat flow is expected to be quite large. Path 2 is a radial line going half way in between the spherical pores, where the effect of the pores on the heat transport is expected to be minimal.
Radial temperature profiles of the porous fuel (100 µm in diameter) along Path 1 (the discontinued blue line) and Path 2 (the solid line). The lower left inset shows the location of Path 1 and Path 2 and the dashed box points to the overlap of the two temperature profiles.

Figure 4 shows that every spherical pore affects the local temperature gradient slightly. This can be better observed in the dashed box showing the radial temperature profile at the radial location of about 2 mm from the centerline of the fuel pellet. The discontinuity in the Path 1 line is due to the existence of the pores along that path. There are slight temperature changes on both sides of each pore due to the thermal barrier (the pores are insulated). The magnitude of these local temperature changes is 1–2° near the center of the fuel pellet, where the temperature gradient is relatively small, and 7–8° near the edge of the fuel pellet, where the temperature gradient is relatively large. The relatively small local temperature variations indicate that the presence of the spherical pores along the radial path of the heat flow only slightly alters the local temperature as heat transfer is redirected along the surface of the pores. In other words, for the case of spherical pores, the temperature profile along Path 2 is a reasonably good representation of the temperature distribution in the fuel pellet.
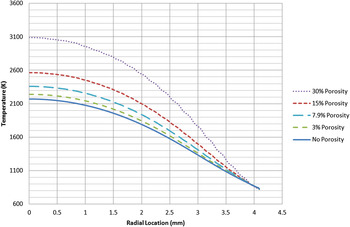
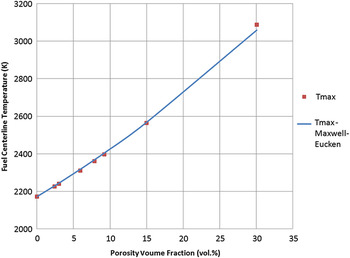
Figure 5 shows one of the key results from this work, the radial temperature profiles in the porous fuel with various total porosity ratios in percent from ∼3 to 30%. It needs to be noted that the cladding materials, Zircaloy, is omitted in the plot as only the porous materials are of main interests here. It is clearly observable that fuel temperature profile changes with total porosity, somewhat insignificantly from ∼3 to 7%. At 15% and 30% porosity, the fuel maximum (centerline) temperature increases quite significantly. In the extreme case of 30% porosity, the fuel centerline temperature reaches almost the melting temperature of UO2. Also noticeable is that temperature profile changes are particularly strong at the locations where temperature gradients are big. Figure 6 shows the fuel maximum temperature as a function of total fuel porosity where results from the Maxwell–Eucken formulation for the case of spherical pores using an effective thermal conductivity are also included. The comparison shows that at low porosity values the predicted centerline temperatures are almost identical. There is a small difference at 30% porosity, which is outside the applicability limits of the Maxwell–Eucken model.
Radial temperature profiles in the porous fuel (not including solid cladding materials in this graph) with various total porosity ratio (in percent).

Comparison of COMSOL simulated fuel maximum (centerline) temperature and those simulated with the Maxwell–Eucken formula as a function of total porosity fraction.

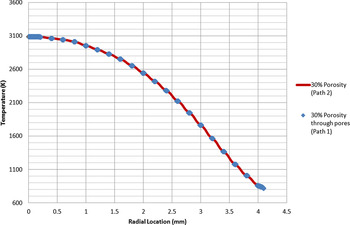
Figure 7 shows the comparison of radial temperature profiles through Path 2 (represented by the solid line) and through Path 1 (represented by the data symbols) for the case of 30% total porosity. This plot is a confirmation that the line (Path 2) without passing through the pores represents the ones through pores (such as Path 1) on the high porosity end as well as on the lower porosity end (represented by Fig. 4).
Comparison of radial temperature profiles through Path 2 (solid line) and through Path 1 (data symbol) for the case of 30% total porosity.

B. The effect of the pore size at fixed total porosity
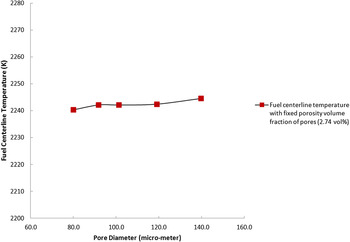
To improve the understanding of this effect, the porosity volume fraction was fixed at 2.74 vol% and the pore size and pore number density were varied such that both uniform size and spatial distributions of pores are created in the segment of the fuel pellet. The axial length of the segment was adjusted slightly when necessary to meet the requirement of uniform spatial distribution of pores. The pores range in diameter from 80 to 140 µm. The resulting fuel maximum temperature is plotted against the pore diameter in Fig. 8, showing a very weak effect (less than 3 K) of the pore size at fixed total porosity. This is consistent with the assumptions in the Maxwell–Eucken model. Furthermore, the data points of the fuel maximum temperature do not seem to follow a specific trend suggesting that the temperature variations are not necessarily systematic and may be the result of the slight spatial heterogeneity (nonuniform distribution of porosity) described above, in Sec. II.
Fuel maximum temperature (centerline temperature) variation with pore size. The porosity volume fraction is fixed at 2.74 vol% for spherical pores.

IV. CONCLUSIONS
The influence of porosity on the thermal conductivity of the oxide nuclear fuel (UO2) was evaluated using FE simulations of coupled thermal transport and oxygen diffusion. As opposite to common 1D and 2D studies, this work provides quantitative information on the role of porosity in a 3D geometry that represents a segment of the oxide fuel element. The results show that porosity leads to changes in the temperature profile, especially in the regions of large temperature gradient. The simulation results demonstrate that the centerline temperature increases with the total porosity and the increase is not linear with porosity. At low porosity levels (<15%) the simulation results are consistent with the Maxwell–Eucken model for spherical pores. At high porosity (30%), the predicted centerline temperature is slightly higher than the Maxwell–Eucken value. The results also show that the centerline temperature, at fixed total porosity, weakly depends on the pore size distribution. The dependence does not appear to follow a specific trend and may be due to the slight nonuniformity in the pore location along the heat transport paths, which suggests that a 3D treatment of nonuniform porosity is necessary to further improve the understanding of the effect of porosity on thermal transport in nuclear fuels.
ACKNOWLEDGMENT
This work was supported by the US Department of Energy, Office of Science under Contract No. DE-AC02-06CH11357.