


Introduction
The ice in temperate glaciers is at the pressure-melting point, and there are inclusions of unfrozen water within the ice. Reference Fountain and WalderFountain and Walder (1998) hypothesize that the englacial hydrology is dominated by a network of crevasses joined by horizontal conduits. They also hypothesize that these conduits have cylindrical bases, shaped by flowing water. Based on numerous borehole-video and geophysical observations, Reference Harper, Bradford, Humphrey and MeierbachtolHarper and others (2010) conclude that a system of highly transmissive basal crevasses form an important component of the glacier hydrology system on Bench Glacier, Alaska, USA. Further, they conclude that the majority of radar scatterers result from basal crevasses that extend upward into the ice mass. The scatterers are most prominent below a radar-transparent zone, which extends from the surface to 20 m deep on average (Reference Brown, Harper and BradfordBrown and others, 2009). As noted by Reference Brown, Harper and BradfordBrown and others (2009), such a distribution of scatterers is a relatively common observation on temperate glaciers.
Electromagnetic (EM) and seismic velocities can be used with an appropriate mixing formula to estimate liquid water content in temperate glacier ice. For example, Reference Murray, Stuart, Fry, Gamble and CrabtreeMurray and others (2000) surveyed Falljökull, Iceland, with both surface and borehole radar and found that diffractions within the glacier are a result of water-filled voids, and the varying concentration of those voids within the glacier can be mapped using ground-penetrating radar (GPR). Reference Bradford and HarperBradford and Harper (2005) used migration velocity analysis of single-offset GPR data acquired on a temperate glacier to obtain spatially continuous estimates of velocity and liquid water content. Reference Bradford, Nichols, Mikesell and HarperBradford and others (2009) collected continuous multi-offset GPR data, then used reflection tomography to estimate velocity and liquid water content on Bench Glacier. Reference Barrett, Murray and ClarkBarrett and others (2007) and Reference Murray, Booth and RippinMurray and others (2007) consider how errors in the GPR velocity model affect the water content estimates, and methods to reduce these errors. Reference Endres, Murray, Booth and WestEndres and others (2009) use effective medium theory and integrated analysis of radar and seismic velocities to estimate water content. Critically, they show that the geometry of the water inclusions plays an important role in determining the elastic and radar velocities.
None of the studies noted above consider azimuthal anisotropy in the attempt to estimate water content from velocity measurements. However, anisotropic characteristics of scattering events in a polythermal glacier were measured with polarimetric GPR (Reference Barrett, Murray, Clark and MatsuokaBarrett and others, 2008). Based on these measurements, Reference Barrett, Murray, Clark and MatsuokaBarrett and others (2008) determined that the scatterers were lying in steeply dipping planes associated with a previous high-pressure water system. Their study shows that understanding azimuthal anisotropy can be key to understanding the englacial system.
The above literature review suggests that the orientation of basal crevasses may have significant implications for studies using GPR or seismic surveys to estimate water content. As noted by Reference Endres, Murray, Booth and WestEndres and others (2009), radar velocity measurements have long been used to infer englacial water content via isotropic mixing rules. However, when the water is present in a fracture system with preferred orientation, failure to account for the resultant anisotropy can result in serious over- or underestimation of the volumetric water content. Anisotropy associated with ice fabric is a well-known effect from ice-sheet studies (e.g. Reference Matsuoka, Wilen, Hurley and RaymondMatsuoka and others, 2009 and references therein) and has the potential to complicate the analysis. We have conducted a series of experiments designed to investigate azimuthal elastic and EM velocity anisotropy associated with a preferentially aligned fracture system on a temperate valley glacier in south-central Alaska. For both seismic and EM analysis, we assume that the velocity anisotropy is dominated by vertical, water-filled fractures, but base this assumption on data-driven observations. Specifically, we conducted a three-dimensional (3-D) compressional wave (P-wave) seismic reflection survey with the primary objective of identifying azimuthal anisotropy in the velocity structure which would then determine the preferred orientation of the fracture system. To investigate anisotropy of the dielectric permittivity we conducted a multi-azimuth, multi-offset, polarimetric GPR reflection experiment.
Fracture-Induced Anisotropy
Seismic P-waves
It is well known that waves propagating through a system with preferred fracture alignment will travel with different velocities depending on the polarization of the waves and the direction of propagation relative to the fracture orientation. Because anisotropy is important in seismic exploration for hydrocarbons, there is a rich body of literature devoted to elastic anisotropy. For our purposes, the theory for horizontal transverse isotropy (HTI) summarized by Reference Bakulin, Grechka and TsvankinBakulin and others (2000) provides the basis for computing compressional (P-)wave velocity anisotropy for a surface seismic experiment over a vertically fractured medium with preferred azimuthal alignment. This model assumes that inclusions can be approximated as disks, and that both the cracks and the spacing between cracks are much smaller than the seismic wavelength. As discussed by Reference Bakulin, Grechka and TsvankinBakulin and others (2000), the P-wave seismic reflection response in an HTI medium can be described with three parameters S( v), e(v) and 7(v). In this case, the P-wave normal-moveout (NMO) velocity measured over such a medium is ellipsoidal as a function of azimuth and given by

where v0 is the velocity in the vertical or fast direction and β is the azimuth of the common-midpoint (CMP) line with respect to the axis of symmetry (normal to the fractures). The fast P-wave NMO velocity is aligned with the fracture orientation, and the minimum P-wave NMO velocity, v90, is perpendicular to the fracture direction. With a minimum of three NMO velocities measured along azimuths separated by 45°, we can find an ellipse that satisfies Eqn (1), which in turn provides an estimate of v0, v90 and fracture direction. With estimates of v0 and v90 it is possible to estimate δ(v) from

The parameter δ(v) does not fully describe the properties of the system, but Reference Bakulin, Grechka and TsvankinBakulin and others (2000) show that it is related to fracture density, e, by

where fracture density defined as the number of fractures per unit volume and g=(VS/VP)2 for the host material, which is ice in our case. The volume fraction of the fractures is simply ξ=eV f, where V f is the average volume of the individual fractures. It is therefore possible to estimate the characteristic fracture length with estimates of δ(v ), volumetric water fraction, fracture aperture and an assumed fracture geometry. Note that if the fractures deviate from vertical, or there is more than one axis of symmetry, the simple analysis above breaks down and a more complex characterization and analysis scheme is required (Reference Mavko, Mukerji and DvorkinMavko and others, 2009).
Electromagnetic waves
For EM waves, Reference TaylorTaylor (1965) gives the equations to compute the dielectric permittivity of a medium with needle-shaped or disk-shaped inclusions that are aligned along a single direction. From Taylor’s theory it is clear that the apparent velocity is heavily dependent on not only the concentration but also the shape and orientation of the inclusions. With inclusions aligned along a single direction, the medium is said to be transversely isotropic. In this case, the medium can only support transverse waves (either EM or elastic shear or S) that are polarized parallel or perpendicular to the axis of symmetry. In the case of a fractured medium with a single fracture orientation, we can observe either a fast or slow velocity. For EM waves and water-filled fractures, the fast velocity is observed when the field is perpendicular to the fractures and the slow velocity is observed when the polarization is parallel to the fractures.
A more general equation to determine the effective permittivity tensor that includes both the shape and the degree of order of the inclusions is given by Reference GiordanoGiordano (2005). Giordano’s model approximates the inclusions as ellipsoids of rotation that can vary from spherical to needle-shaped or disk-shaped and accounts for the state of order, or how well the axes of rotation are aligned. Assuming that the inclusions can be approximated as disks, or penny-shaped cracks, Giordano’s formulation gives


where Eqns (4) and (5) give the permittivity measured with the field polarization aligned parallel and perpendicular to the fracture orientation respectively. 1 is the host permittivity (ice) and ε2 is the permittivity of the inclusions (water). ξ is the volume fraction of the inclusions. The parameter S is the depolarization factor and depends on the distribution of fracture orientations. If the fractures are perfectly aligned, S= 1, and for perfect disorder, or random orientation, S=0. In these extremes, Giordano’s formulation reduces to Reference TaylorTaylor’s (1965) equations. If the fracture probability distribution is available, then Scan be determined by computing the integral (Reference GiordanoGiordano, 2005)

where f(’) is the azimuthal probability density. If we consider water-filled fractures as inclusions in the ice, we find that the slow velocity is strongly sensitive to even small percentages of volumetric water content (Fig. 1) even for imperfect alignment of the fractures. For a random distribution of fractures, there is no azimuthal variation of velocity, but the velocity approaches that of pure water much more rapidly than is predicted by the more commonly used isotropic mixing formulae such as the Reference LooyengaLooyenga (1965) equation.
Comparing the anisotropic formulation of Reference GiordanoGiordani (2005) to the commonly used Looyenga equation, we see that the presence of water-filled, preferentially aligned cracks can dramatically alter the velocity we measure, depending on the polarization of the antennas. Note that S is a measure of the disorder of the inclusions. S = 1 is perfect order and S = 0 is perfect disorder. S = 0.91 was computed based on borehole observations on Bench Glacier. The filled circles show velocities measured in this study; size of the circles indicates water fraction uncertainty.

Field Study
Site description
Bench Glacier is a small mountain glacier located in south-central Alaska (Fig. 2). It was selected for a series of hydrologic and geophysical experiments because of its simple geometry, and proximity to Valdez, Alaska. Bench Glacier is ∼1 km wide and ∼8km long. Other than an icefall that separates the accumulation zone from the ablation zone, the glacier surface has a fairly shallow slope (∼10°). The glacier thickness averages ∼180 m, and it is not thought to have significant till at the bed. For over a decade, our group conducted numerous experiments including monitoring water-pressure changes in >25 boreholes, recording outlet streamflow, measured glacier movement using GPS and seismographs, along with performing many other hydrologic and geophysical surveys (Reference Bradford and HarperBradford and Harper, 2005; Reference Harper, Humphrey, Pfeffer, Fudge and O’NeelHarper and others, 2005, Reference Harper, Bradford, Humphrey and Meierbachtol2010; Reference Fudge, Humphrey, Harper and PfefferFudge and others, 2008; Reference Meierbachtol, Harper, Humphrey, Shaha and BradfordMeierbachtol and others, 2008; Reference Brown, Harper and BradfordBrown and others, 2009; Reference Mikesell, Van Wijk, Haney, Bradford, Marshall and HarperMikesell and others, 2012). The wealth of observations led Reference Harper, Bradford, Humphrey and MeierbachtolHarper and others (2010) to conclude that basal crevassing produces an extensive fracture system and that this fracture system forms a substantial reservoir for englacial water storage and routing.
Bench Glacier bed topography and location of seismic, GPR and borehole fracture orientation surveys. Note that the glacier trough is symmetric both up- and down-glacier of the 3-D seismic and polarimetric GPR surveys, but within the survey area the trough is asymmetric, with the axis shifted toward the southwest. Polarimetric radar data were collected in 2008, seismic data in 2007, borehole fracture orientation data in 2006, and common-offset GPR lines 3 and 4 and axis line were collected in 2003. Black points in the seismic survey area show the positions of CMPs plotted in Figure 4. Coordinates are Universal Transverse Mercator (UTM).

Borehole observations
Detailed video inspection of 25 boreholes has shown that the majority of fractures do not reach the ice surface (most are confined below 50m depth), are water-filled and sub-vertical (dips >70°). Fracture apertures range from <1 cm to nearly 1 m, with an average of ∼4cm (Reference Harper, Bradford, Humphrey and MeierbachtolHarper and others, 2010). It is not possible to observe the lateral limits of the fractures with borehole video, so the fracture aspect ratios could not be determined from direct observation. Additionally, it is difficult to reliably estimate fracture density when sampling a sub-vertical fracture system with vertical boreholes. Fracture azimuths were measured in five boreholes contained in a roughly 2 0 m x 2 0 m square (Fig. 2) by mounting a compass in front of the borehole video camera. These measurements show that the preferred fracture orientation is 30 ±15° relative to the glacier flow axis (Fig. 3). Using this fracture distribution with Eqn (3), we calculate a radar depolarization factor of S= 0.91.
Histogram of vertical fracture azimuth relative to glacier flow axis measured in boreholes on Bench Glacier. While the measured distribution shows some asymmetry, the overlain normal distribution, with standard deviation of ±15°, provides a reasonable description of the variability in crack azimuth.

3-D P-wave seismic reflection
Seismic acquisition
During the summer of 2007, we acquired a 3-D P-wave survey (see Fig. 2 for location) with the following parameters:
-
300 m x 300 m survey patch
-
source: 8 kg manual jackhammer
-
40Hz vertical geophones
-
10m x 10m shot grid
-
four 5 m x 5 m receiver grids in checkerboard
-
214channels
-
2.5 m CMP bin size
-
differential GPS grid survey
The location was chosen so that the survey area included a set of five boreholes in which fracture orientation had been measured in 2006 (Fig. 2). The impacting hammer source deployed directly on the ice produced a broadband signal with usable energy from 15 to 600 Hz. After applying a bandpass filter (100-200-600-1200 Hz Ormsby zero-phase) to attenuate low-frequency noise produced by flowing meltwater on and within the glacier and applying automatic gain control with a 50 ms time gate, the bed reflection is clearly visible from 0 to the maximum offset of >400m (Fig. 4). Additional processing steps were minimal and included muting the Rayleigh wave, elevation corrections and NMO velocity analysis. Finally, pre-stack time migration produced a detailed image of the glacier bed (Fig. 5).
Azimuth-averaged CMP supergathers, from three different locations in the 3-D seismic survey (see Fig. 2 for locations). The bed reflection arrives at ∼90ms at near offsets.

Depth slice through the depth-converted 3-D pre-stack time migrated volume of seismic data showing a detailed image of the bed. Apparent englacial coherent events above the slice depth are migration edge artifacts.

Anisotropic velocity analysis
To analyze azimuthal variation in P-wave velocity we subdivided each CMP bin into three source-receiver azimuth bins. The aperture of each bin was ±15° and the bins were centered at 0°, 45° and 90° (90° is aligned with the glacier flow direction). CMP/azimuth supergathers were formed by combining the data within a 3 x 3 bin area. We used CMPs only from the region where the bed is relatively flat (dip <3°); the velocity error caused by a 3° dip is 0.14%. We used only azimuth bins that contained a minimum of ten traces. This procedure resulted in 33 bins with adequate coverage in each azimuth. The average offset apertures at 0°, 45° and 90° were 184 ± 49 m, 118± 66 m and 111 ± 45 m respectively, and average folds were 107 ± 4 9 , 53 ± 2 9 and 72 ± 4 5 respectively. For velocity analysis, we utilized commercial velocity analysis software in which we use standard semblance plots to form a guide function, then adjust the stacking velocity to ensure that the peak of the first quarter-cycle of the wavelet is flattened. This procedure minimizes systematic bias in the velocity function that results from directly picking the semblance peak associated with the central peak of the wavelet (Reference Booth, Clark and MurrayBooth and others, 2010). The site-averaged velocities are 3722 ± 3 1 , 3765±21 and 3660±14ms–1 for the directions parallel, 458 oblique, and perpendicular to flow respectively (Fig. 6). Allowing for a travel-time bias of as much as quarter-period at the dominant frequency of the filtered wavelet (200 Hz) yields a velocity error of 0.6% which is on the same order as the variability observed within the individual azimuth bins, and this uncertainty is included in the calculations noted below. As expected for HTI anisotropy, the zero offset times were independent of azimuth. We then fit an ellipse to both the site-averaged survey velocities noted above and the individual velocity triplets found in each CMP bin (Fig. 7).
Measured stacking velocities relative to glacier flow. These survey averaged velocities show azimuthal variation of 3.2%. Error bars show the standard deviation over all CMPs for each azimuth. Angles are azimuth relative to flow direction.

The color image shows bed topography interpreted from the 3-D seismic volume. The overlain vectors indicate the strength and direction of NMO velocity anisotropy for individual CMP supergather bins; maximum anisotropy for a single CMP is ∼4%. Anisotropy vectors vary smoothly and appear to change as a function of local bed topography.

Results
The velocity analysis procedure described above yielded survey averaged velocities of 3765 and 3630 ms–1 in the fast and slow directions respectively. The fast P-wave direction is parallel to the fractures, and the best-fit ellipse over all CMP velocities gives a fracture orientation that is 308 oblique to glacier flow in a north-trending direction. Breaking the data into individual CMPs, we can map variation in fracture alignment within the 3-D survey area (Fig. 7). The velocities are roughly averaged over a spread length, in line, and laterally over a Fresnel volume, so the alignment vectors in Figure 7 indicate a running average of fracture orientation. Even with this caveat, a systematic variation in the fracture direction is evident, with fractures in the up-glacier direction sub-parallel to flow, then a gradual rotation to oblique orientation in the down-glacier direction (Fig. 7). This systematic variation appears to be a function of bed topography where the trough that forms a choke point in the up-glacier direction broadens asymmetrically in the down-glacier direction (Fig. 7). Note that the systematic velocity error that could be introduced in velocity analysis by incorrectly aligning the central peak of the wavelet rather than the first arrival will not alter the direction of anisotropy since both fast and slow velocities will be biased in the same direction even if there is a shift in the absolute values.
Polarimetric radar
Data acquisition
Polarimetric radar data were collected during summer 2008 in a part of the glacier where the bed reflection had been observed to be strongly attenuated in a common-offset axis profile with antennas polarized perpendicular to the flow direction. For the polarimetric survey, we acquired expanding spread gathers in a wagon-wheel geometry along five different azimuths about a CMP (Fig. 8). The survey parameters are
-
25MHz linear dipole antennas
-
2m offset intervals
-
200m maximum offset
-
expanding spread gathers with CMP along five orientations: -48, 268, 528, 768, 908 – glacier flow direction is 0 (Fig. 8)
-
coincident end-on (xx) and broadside (yy) antenna polarizations
Geometry for the polarimetric GPR CMP gathers as azimuth relative to glacier flow axis. Solid lines show the orientation and length of CMP spreads; maximum offset was 200m about the common central point.

The survey was repeated three times for each of three polarizations: antennas parallel to each other and perpendicular to the spread direction (broadside or yy), antennas parallel to each other and parallel to the spread direction (end-on or xx) and source perpendicular to spread direction with receiver parallel to spread direction (cross-polarized or yx). While it is possible to sample all polarizations relative to the glacier with the antennas fixed in xx or yy configuration, this would require rotating the axis of the spread direction. With the axis of the spread direction rotating, each CMP is sampling a different volume of ice, which is undesirable if the system is not uniformly anisotropic. Conversely, the geometry we used ensures that for each spread direction the same volume of ice is being sampled by parallel, perpendicular and cross-polarization configurations. The signal-to-noise ratio for the bed reflection in the cross-polarized data was too low to reliably estimate the velocity and these data will not be discussed further.
Data processing was minimal and consisted only of a time-zero correction and bandpass filter. Due to high scattering attenuation, we used the low end of the spectrum for this analysis (1–2–6–12 MHz, zero phase, Ormsby filter) which enabled clear identification of the bed reflection (Fig. 9). The survey was conducted where the bed is approximately flat (dip <38) so that dip moveout was insignificant: as noted earlier, the velocity error caused by a 38 dip is 0.14%.
Low-pass (1–2–6–12 MHz) filtered CMP gathers from three azimuths and two polarizations show a clear bed reflection. The NMO equation was fit to the picks shown with a red dashed line. Inset shows pick locations on a portion of the data with a very mild filter (1–2–50–100 MHz) showing that the picks fall on the leading edge of the propagating wavelet.

Velocity analysis
We picked reflection travel-time curves manually for each polarization and survey azimuth (Fig. 9). Picks were made at the first zero crossing after the first half-cycle of the filtered data. Synthetic tests with the low-pass filter applied to a 25 Hz wavelet show that it produces a zero crossing that is <10 ns (quarter-period at 25 Hz) from the leading edge of the unfiltered wavelets, and this relationship also holds for our field data (Fig. 9). Therefore our picking strategy ensures that our velocity estimates do not include the systematic bias that occurs when the later time central peak is used for the travel time (Reference Booth, Clark and MurrayBooth and others, 2010). We then used linear regression of the squared travel-time vs squared offset curves to estimate the NMO velocities and associated uncertainties. Mean uncertainty in the estimated velocity fit was ∼0.5%, which is well below the observed azimuthal velocity variation (Fig. 10). We estimate uncertainty caused by an error in picking the correct wavelet phase by applying a static shift of ±10ns to the travel-time curve, then calculating the NMO velocity of the shifted curve. This results in an additional 0.25% uncertainty in the velocity estimates.
Azimuthal variation in the GPR velocity is distinct and varies with polarization. Error bars show standard deviation in the velocity estimate from NMO analysis. Azimuthal variation is well above the estimated uncertainty of the velocity fit. The slow velocities of 0.156mns–1 between 268 and 528 are measured with the antenna polarization aligned with fracture orientation measured in boreholes and estimated from seismic velocities.

Results
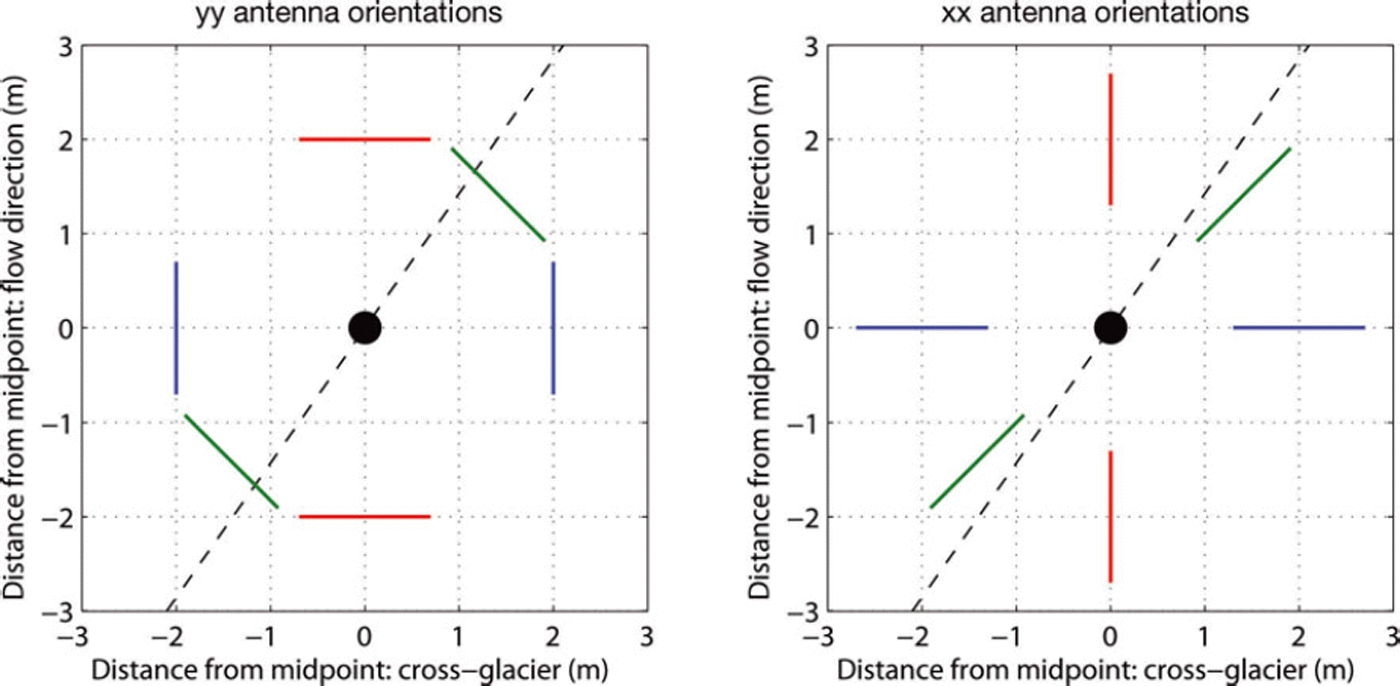
Velocities show a bimodal distribution, as expected for a system of vertical fractures with preferential azimuthal orientation. With the antennas’ polarization aligned between 26° and 52° we observe velocities of ∼0.156 m ns–1, indicating that no fast mode is present in this orientation (Fig. 10). For all other orientations we find velocities of ∼0.162-0.166 m ns–1, indicating that the fast mode is present and is the first arrival from the bed. No slow mode is observed in the broadside data at any of our survey azimuths. This is explained by plotting the antenna orientations for our survey relative to the estimated fracture direction (Fig. 11): we see that in broadside (yy) mode the antennas are never aligned with the fracture direction whereas the xx mode reaches sub-parallel orientation at CMP directions that are oblique to glacier flow.
Schematic that illustrates the GPR antenna polarizations at 08, 458 and 908 relative to the flow direction for the yy and xx polarizations, along with the estimated fracture direction. In yy polarization, the antennas are never aligned with the fracture direction, so the fast mode is always the first arrival observed from the bed.
Using Eqns (4) and (5) we can compute the volumetric water fraction using the azimuthally variable GPR velocity. The mean fast velocity of 0.164mns- 1 gives a relative permittivity of 3.35, while the mean slow velocity (0.156 m ns–1) yields a value of 3.70. We calculated volumetric water content by least-squares optimization with Eqns (4) and (5). We estimated uncertainty by first computing the total velocity uncertainty as
 with cf it (0.0009 m ns–1) giving the uncertainty in the fit, σshift (0.0004m ns–1) giving the uncertainty potentially caused by a systematic shift in picking the wavelet phase, and σavg (0.0013 m ns–1) giving the standard deviation of the mean of measured fast or slow velocities. We then propagate v± tot
through the water content calculations to arrive at a bulk volumetric water content estimate of 0.73 ± 0.11% (Fig. 1).
Discussion
Direct observation of fracture orientation in boreholes, 3-D seismic analysis and multiple GPR surveys indicates that in the central area of the ablation zone on Bench Glacier, the dominant orientation of basal crevasses is roughly 30-458 from the direction of glacier flow along the axis (Fig. 12). Surprisingly, this result is independent of the cross-glacier position, and is not consistent with observation of surface fracture patterns. Further these observations have been made in different years (spring 2006: borehole; summer 2007: seismic; summer 2008: GPR). The orientation of fractures is determined by the time/space averaged stress field, and while the instantaneous stress field might change over short timescales, we do not expect the orientation of stresses dictating fracture alignment to change substantially seasonally or annually. Acceleration in the spring may result in more fractures being open at that time, or in the average fracture aperture being larger. All of our anisotropy measurements have been made in a part of the glacier where the bed trough shifts from symmetric to asymmetric geometry: the glacier trough is shifted toward the southwest (Fig. 2). We suspect that this shift disrupts the local stress field at the bed where the basal crevasses are forming, which leads to consistent alignment of the basal crevasses that differs from the surface fracture pattern.
Combined borehole-video (blue), seismic (black outline) and GPR estimates of crack azimuthal distribution (red dash). Angles are relative to the glacier flow direction. All three measurements are consistent and show a preferred orientation of basal crevasses that is oblique to the flow direction at ∼30-458.

Substituting our estimated high and low velocities into Eqn (2) gives (v) = -0.035. While (v) is related to fracture density and fracture aperture (Reference Shen, Zhu and ToksözShen and others, 2002), it cannot, alone, provide further information about the characteristics of the fracture system. However, estimating fracture density from Eqn (3), using the estimate of 0.73% water content from GPR analysis, and an average fracture aperture of 0.04 m (Reference Meierbachtol, Harper, Humphrey, Shaha and BradfordMeierbachtol and others, 2008), we calculate an effective fracture diameter of 2. 7 - 0.5 , +1.0 m. Uncertainties are estimated using the same approach as described above for GPR water-content estimation. A characteristic diameter of 2.7 m suggests that most fractures in this area are stranded, closed-off crevasses. However, this value must be viewed with caution given the uncertainty associated with assumptions of purely vertical fractures, a single fracture azimuth and disk-shaped fractures. Additional estimates of the parameters (v) and (v) would provide the basis for complete characterization of the system, and in concept can be estimated from a dipping event and the azimuthal variation in P-wave AVO gradient respectively (Reference Bakulin, Grechka and TsvankinBakulin and others, 2000). However, we have not been able to extract these parameters from our dataset with confidence.
Analysis of the polarimetric GPR data provides both the fracture orientation and an estimate of liquid water content. Now consider the result had we not accounted for the anisotropy. For example, let us assume isotropy and use the Looyenga mixing formula to estimate liquid water content. This analysis would incorrectly yield two widely varying estimates of water content: if we happened to measure velocity with polarization parallel to the fracture system the water content estimate would be 2.7%, whereas polarization orthogonal to the fracture system would give 0.8%. The situation quickly becomes even more severe (e.g. if the true anisotropic water content were ∼2.5%, the assumption of isotropy and use of the slow velocity would yield a strikingly high water content of >10%). In other words, application of an isotropic mixing formula in an anisotropic system has little meaning. From the literature, water-content estimates in temperate glacier ice range from 0 to 9% (Reference Pettersson, Jansson and BlatterPettersson and others, 2004). While most water-content estimates on a single glacier varied by <2% total volume, some estimates of the water content ranged from 0.5% to 7.6% for one glacier (Reference Pettersson, Jansson and BlatterPettersson and others, 2004). While the orientation and order of the voids is not known for those cases, one can argue that a large component of the uncertainty may be due to azimuthal anisotropy and that the true variation in water content may not be as high as reported.
There are two problems with our analysis to this point. First, we have ignored anisotropy that may be due to ice crystal fabric and have assumed that fractures dominate the anisotropy of the system. Indeed, ice crystal fabric is clearly observed on the exposed surface ice, and in the location of our wagon-wheel GPR survey it is oriented along the glacier axis. Therefore, it should be possible to observe EM velocity anisotropy associated with this fabric by measuring the direct wave velocity from the broadside GPR data from the wagon-wheel survey which has polarizations both perpendicular and parallel to the fabric. The direct wave velocity perpendicular to the fabric is 0.1706±0.0002 mns-1 and parallel is 0.1702 ±0.0004: the difference is not significant and we conclude that GPR velocity estimates from the surface wave show no measurable azimuthal anisotropy. While certainly the ice fabric at the surface produces anisotropy, it is below the accuracy of our field measurements. Measurements at the surface are not a conclusive indicator that there are not more significant fabric-induced effects at greater depth; however, this observation gives a level of confidence that our assumption of fracture-dominated anisotropy is reasonable.
The second problem is perhaps the more difficult. We measured a substantial decrease in radar velocity with antenna polarization oriented 30–458 oblique to the glacier flow direction. Yet careful observation of Figure 9 reveals no significant azimuthal variation in travel-time difference in the near-offset reflection from the bed. The measured velocity difference would predict a nearly 100 ns increase in near-offset travel time when the antennas are polarized in the slow direction. Additionally, at near offset, both the phase and amplitude are consistent over all azimuths. This observation holds for both the xx and yy polarizations (although independently as there is a phase difference between xx and yy polarizations). How can we explain the apparent inconsistency? The observations indicate that there is no azimuthal anisotropy at near offset in this location. However, the near offset samples only a very limited volume of the glacier. There is clear and significant evidence for anisotropy when the full offset range of 200 m is considered, and the anisotropy orientation is completely consistent with other independent observations (seismic and borehole). The most likely explanation is that there is lateral variability in fracture density at a scale that is less than a spread length (200 m). Examination of large-scale common-offset GPR profiles provides further evidence of the fracture variability. Up-glacier of the polarimetric survey by 150 m, the tie points of two orthogonal profiles with orthogonal polarizations show no travel-time difference (line 3, Fig. 13). However, down-glacier of the polarimetric survey, the orthogonal profiles show a mis-tie of >50ns (line 4, Fig. 13). It is trivial to show that, for a common sampling location, vs/vf = t f/t s, where vis velocity, t is travel time and the subscripts f and s indicate fast and slow respectively. The 50 ns mis-tie then indicates a 3% difference in the fast and slow velocities. Additionally, at the line 4 tie point, the slow direction is with the polarization aligned in the direction of glacier flow. These two observations indicate that both the fracture orientation and density are altered from the polarimetric survey location. This may be explained by noting that at the line 4 tie point, the trough of the glacier is shifting back toward a symmetric geometry (Fig. 2) and likely altering the local stress field.
Axis profile near the glacier center line, with two cross-glacier profiles. The three profiles were acquired in broadside (yy-polarization) configuration with an offset of 4 m. The bed reflection at the crossing point arrives at the same time for the orthogonal polarizations at line 3. At line 4 the bed reflection arrives 50 ns later, with antennas polarized parallel to the glacier flow direction. This latter observation indicates both a change in the fracture orientation and shift of fracture density along the glacier axis relative to the polarimetric CMP survey. Note that there is no correction for topography in this figure: measurements are relative to the glacier surface.

Conclusions
From the results of this study, we conclude that both P-wave seismic and polarimetric GPR velocity analyses are sensitive indicators of fracture-induced anisotropy in glaciers. Seismic measurements have the advantage that hundreds of channels can be deployed simultaneously, making it much easier to obtain continuous azimuthal and offset coverage over large areas. However, active source seismic methods require substantially more labor, equipment and logistical preparation than GPR methods. P-wave seismic velocity measurements alone can indicate fracture orientation but cannot fully characterize the system. Acquisition with three-component geophones and a source that generates both S- and P-waves would allow for full characterization of the system, but would require an increase in the number of recording channels by a factor of three.
Borehole, seismic velocity and GPR velocity measurements indicate a fracture orientation that on average is consistent over several hundred meters. However, both radar and seismic data analyses suggest that there are local variations, at a scale of less than a spread length (200–300 m), that may be related to bed-localized perturbations in the stress field. We currently lack the spatial coverage and density of measurements required to fully understand this variability.
For a vertically oriented fracture system, polarimetric GPR velocity measurements provide a convenient means of finding both the fracture orientation and liquid water content. However, multi-offset measurements at a single CMP cannot resolve variation that occurs at a spatial scale that is less than a spread length. While not tested as part of this study, it is trivial to configure a modern multichannel GPR system to simultaneously acquire common-offset GPR data with multiple azimuthal orientations. Conceptually, with such a system one could rapidly acquire high-density, common-offset data over large areas. Then from the polarization-dependent, bed-reflection travel times one could obtain high-resolution estimates of fracture orientation and relative velocity variation. Absolute velocity estimates would still require other measurements such as multi-offset acquisition or borehole calibration.
Meaningful estimates of water content in temperate glacier ice based on EM velocity measurements require collecting data such that the presence of anisotropy can be evaluated and an anisotropic analysis employed when necessary. Our combined borehole and geophysical observations suggest that the majority of water-filled voids within Bench Glacier have a planar geometry. In general then, in the absence of other information, it is most reasonable to assume a crack-like geometry for the voids and to use an appropriate mixing formula such as that of Reference GiordanoGiordano (2005). If no azimuthal velocity variations are present, then the mixing formula for randomly oriented cracks (e.g. S= 0) is appropriate. In this case, the radar velocity decreases more rapidly with increasing water content than with an isotropic assumption such as the Looyenga equation. Estimates based on the assumption of spheroidal voids likely overestimate the water content, but may be useful as an end-member estimate in the absence of other information.
Acknowledgements
This work was funded by US National Science Foundation grant ARC0454717. Boise State University (BSU) acknowledges support of this research by Landmark Graphics Corporation via the Landmark University Grant Program. We thank former BSU students Dylan Mikesell, Tabish Raza and Vijaya Raghavendra for assistance with acquisition of field geophysical data.



