I. INTRODUCTION
Photoelectric transformation efficiency of solar cells can be improved by spectral modification, which reduces the energy losses that limit the efficiency related to spectral mismatch.Reference Richards1 There are two ways to adapt the solar spectrum before it is absorbed by the solar cells. One is known as upconversion (UC), whereby two lower-energy photons are absorbed to give out one higher-energy photon. It is a nonlinear process depending on the incident power and is especially useful for solar cells with a large band gap where transmission losses dominate. The other is to cut one higher-energy photon into two lower-energy photons, known as downconversion (DC). This is a linear process and is most beneficial for solar cells with a smaller band gap where thermalization losses are the major loss factor. Using nonconcentrated sunlight as light source, DC has the capability to get high conversion efficiency.
For DC spectral modification method by rare earth (RE) doping, a RE ion pair is usually needed. One ion acts as a sensitizer to absorb higher-energy photons and the other as luminescence center to output lower-energy photons. To consider the practical application on solar cells, Ce3+ is chosen as sensitizer, which shows broadband absorption due to the f–d transition in high-energy region. For c-Si solar cell, the spectral response is gradually increased from the ultraviolet (UV) region to the near-infrared (NIR) region with the maximum value at around 1100 nm, which is in agreement with the band gap of Si (1.1 eV). Many investigations have been carried out on DC of UV or visible photons to NIR photons choosing Yb3+ as the luminescence centerReference Zhang, Yang and Jiang2–Reference Chen, Yu, Lin, Huang, Shan and Wang6 because the energy level difference of Yb3+:2F5/2 and 2F7/2 is a little larger than the band gap of Si. Making the couple of Ce3+ and Yb3+ as an ion pair has been reported before; however, the practical quantum efficiency is much lower than the theoretical quantum efficiency.Reference Uedaa and Tanabe7 In this paper, we investigate whether we can get more efficient NIR emission with Ce3+–Nd3+ couple compared with Ce3+–Yb3+ couple in YAG. Since Nd3+ energy level transitions have a NIR emission similar to Yb3+ for application in Si solar cell and the first-order energy transfer (ET) with an intermediate level (ET between Ce3+ and Nd3+), they may be more efficient than the second-order cooperative energy transfer process (ET between Ce3+ and Yb3+).
II. EXPERIMENTAL
YAG powder samples with different doping concentrations of Ce3+ and Nd3+/Yb3+ [Y3−x−yCex(Nd/Yb)yAl5O12] (x = 0, 0.12; y = 0, 0.024, 0.06, 0.12, 0.24, 0.36) were prepared with a sol-gel route using citric acid and ethylene glycol (EG) as the chelating agents.Reference Pan, Wu and Su8 The obtained powders comprise single-phase YAG (JCPDS No. 33-0040), which was identified with x-ray diffraction (XRD). Excitation, emission spectra, and decay curves were recorded with a FLS920 fluorescence spectrophotometer under ambient atmosphere. All the measurements were carried out at room temperature.
III. RESULTS AND DISCUSSION
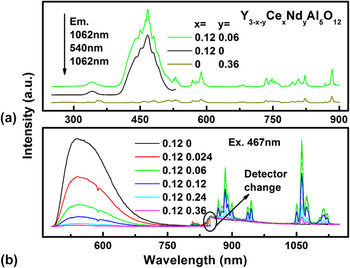
Figure 1 shows the excitation and emission spectra of Y3−x−yCexNdyAl5O12 (x = 0, 0.12; y = 0, 0.024, 0.06, 0.12, 0.24, 0.36). From the excitation spectrum of Y2.82Ce0.12Nd0.06Al5O12 monitored at 1062 nm, the hybridized peaks in long wavelength from 450 to 900 nm are ascribed to Nd3+:4I9/2 → 4G11/2, 4G3/2, 4G9/2, 2G9/2, 2G7/2, 4G5/2, 4F9/2, 4S3/2, 4F7/2, 2H3/2, 4F5/2, 4F3/2 transitions, which could also be identified from the excitation spectrum of Y2.64Nd0.36Al5O12. Also, the broad bands (325–360 and 400–520 nm) of Y2.82Ce0.12Nd0.06Al5O12 in excitation spectrum monitored at 1062 nm, which are ascribed to Ce3+:4f → 5d (2B1g, 2A1g) transition, are in good accordance with that of Y2.88Ce0.12Al5O12 excitation spectrum monitored at 540 nm. This can be an evidence of the energy transfer from Ce3+ to Nd3+. In Fig. 1(b), the emission intensity changes with various Nd3+ concentration (y = 0, 0.024, 0.06, 0.12, 0.24, 0.36) and a fixed Ce3+ concentration (x = 0.12) in visible and near-infrared region under excitation at 467 nm. The intensity of broad emission bands of Ce3+:5d → 4f transition (500–750 nm) decreases monotonously with increasing y from 0 to 0.36. Also the concaves in the luminescence curves at 588 nm are ascribed to the fluorescence reabsorption of Nd3+:4I9/2 → 4G5/2 transition. Meanwhile, the NIR luminescence intensities of Nd3+ show a maximum when y is equal to 0.06. Also, the remarkable decrease of the NIR luminescence intensity is due to concentration quenching, when y further increases.
Excitation and emission spectra of Y3−x−yCexNdyAl5O12 (x = 0, 0.12; y = 0, 0.024, 0.06, 0.12, 0.24, 0.36). (a) Excitation spectra of Nd3+ emission monitored at 1062 nm and Ce3+ emission spectra excited at 540 nm. (b) Emission intensity changes with Nd3+ concentrations in visible and near-infrared region under excitation at 467 nm.

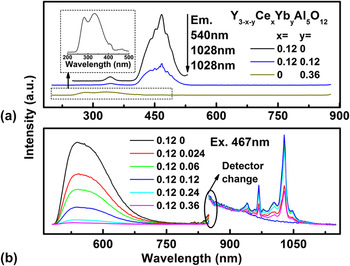
Figure 2 shows the excitation and emission spectra of Y3−x−yCexYbyAl5O12 (x = 0, 0.12; y = 0, 0.024, 0.06, 0.12, 0.24, 0.36) as that of Y3−x−yCexNdyAl5O12 (x = 0, 0.12; y = 0, 0.024, 0.06, 0.12, 0.24, 0.36) shown in Fig. 1. The energy transfer from Ce3+ to Yb3+ is also proved through the excitation spectra, and the strongest near-infrared emission at 1028 nm is observed when x and y are equal to 0.12. The inset is the enlarged view of the excitation spectrum of Y2.64Yb0.36Al5O12 from 200 to 500 nm, which is monitored at 1028 nm. There are four peaks located at 275, 340, 405, and 470 nm, which correspond to the transitions from stark split 2F7/2 level of the Yb3+ ion in the garnet to the charge transfer state.Reference Kamenskikh, Dujardin, Garnier, Guerassimova, Ledoux, Mikhailin, Pedrini, Petrosyan and Vasil’ev9
Excitation and emission spectra of Y3−x−yCexYbyAl5O12 (x = 0, 0.12; y = 0, 0.024, 0.06, 0.12, 0.24, 0.36). (a) Excitation spectra of Ce3+ emission monitored at 540 nm and Yb3+ emission monitored at 1028 nm. Inset is the enlarged view of the excitation spectrum of Y2.64Yb0.36Al5O12 from 200 to 500 nm. (b) Emission intensity changes with Yb3+ concentrations in visible and near-infrared region under excitation at 467 nm.

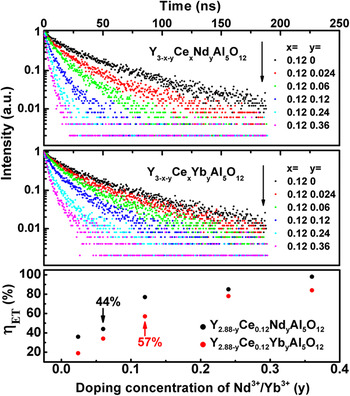
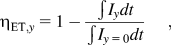
The decay curves of Ce3+:5d → 4f transition of Y3−x−yCex(Nd/Yb)yAl5O12 (x = 0.12; y = 0, 0.024, 0.06, 0.12, 0.24, 0.36), are depicted in Fig. 3. The decay time decreases when y increases from 0 to 0.36 both in Y2.88-yCe0.12NdyAl5O12 and Y2.88-yCe0.12YbyAl5O12, implying the introduction of extra decay path, i.e., energy transfer from Ce3+ to Nd3+/Yb3+. From these decay curves, the energy transfer efficiency (ηET) of Y2.88-yCe0.12NdyAl5O12 and Y2.88-yCe0.12YbyAl5O12 could be estimated by:Reference Vergeer, Vlugt, Kox, Den Hertog, Van der Eerden and Meijerink10
Decay curves of Ce3+:5d → 4f transition and the calculated energy transfer efficiency (ηET) with different Nd3+/Yb3+ concentration in Y3−x−yCex(Nd/Yb)yAl5O12 (x = 0.12; y = 0, 0.024, 0.06, 0.12, 0.24, 0.36).

where I stands forthe decay intensity. The obtained results plotted in Fig. 3 indicate that both ηET of Y2.88-yCe0.12NdyAl5O12 and Y2.88-yCe0.12YbyAl5O12 exhibit a monotonous increase with doping concentration of Nd3+/Yb3+ (y). Also, every ηET of Y2.88-yCe0.12NdyAl5O12 is larger than that of Y2.88-yCe0.12YbyAl5O12, when they have the same y value. However, the maximum effective ηET (the strongest NIR luminescence is obtained before concentration quenching) of Y2.88-yCe0.12NdyAl5O12 (44%, when y = 0.06) is smaller than that of Y2.88-yCe0.12YbyAl5O12 (57%, when y = 0.12).
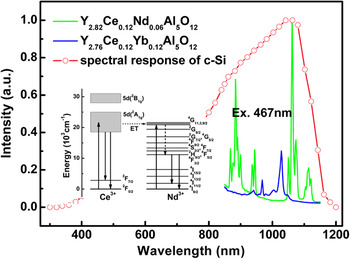
Figure 4 compares the NIR emission intensities of Y2.82Ce0.12Nd0.06Al5O12 and Y2.76Ce0.12Yb0.12Al5O12 under the same measure condition. The integrated intensity of Y2.82Ce0.12Nd0.06Al5O12 is 8 times larger than that of Y2.76Ce0.12Yb0.12Al5O12 in the region from 860 to 1150 nm, while ηET of them is equal to 44% and 57%, respectively. This may be due to the different energy transfer mechanism from Ce3+ to Nd3+ and Ce3+ to Yb3+. The inset shows the energy levels of Ce3+ and Nd3+ with transitions that may be involved in the energy transfer process. Here the nonradiative energy transfer and the radiative energy transfer are involved.Reference Meng, Li, Shi and Cheah11 And from Fig. 3, we can see that the decay time of Ce3+: 5d → 4f transition changes apparently after Nd3+ codoping. So it is notable that the nonradiative energy transfer contributes to the whole energy transfer process. In the nonradiative energy transfer process, after excitation of the Ce3+ 5d state the electrons can either relax radiatively to the 4f ground state, producing broadband luminescence in the visible range, or transfer to the Nd3 + 4G9/2 level. Also, the electrons at 4G9/2 level further relaxed through nonradiative decays to the intermediate level (4F3/2), since the emission due to 4G9/2 → 4F3/2 transition is not observed. Then the NIR emits are observed by the radiative decays from 4F3/2 level to 4I11/2 or 4I9/2 level. However, Yb3+ only has simple energy levels of 2F5/2,7/2, and the energy transfer from Ce3+ to Yb3+ is due to the second-order cooperative energy transfer process.Reference Uedaa and Tanabe7, Reference Chen, Wang, Yu, Huang and Weng12, Reference Liu, Teng, Zhuang, Xie, Qiao, Dong, Chen and Qiu13 Also, second-order cooperative energy transfer process has a lower efficiency, making it only efficient at very high Yb3+ concentrations where the Yb3+ emission is largely quenched through concentration quenching. In addition, it has been reported that the emissions of Ce3+ and Yb3+ are quenched by the process of charge transfer state (Ce4+–Yb2+) in Ce3+–Yb3+ codoped YAG.Reference Uedaa and Tanabe7 So Ce3+–Nd3+ codoped YAG is more efficient than Ce3+–Yb3+ codoped YAG for the similar spectral response of c-Si at 1062 and 1028 nm, as we observed from the large difference between the NIR emission intensities.
Spectral response of c-Si solar cell and near-infrared emission spectra of Y2.82Ce0.12Nd0.06Al5O12 and Y2.76Ce0.12Yb0.12Al5O12 under excitation at 467 nm. Inset is the energy levels of Ce3+ and Nd3+ with transitions that may be involved in the energy transfer process.

IV. CONCLUSION
In summary, we have synthesized pure-phase Ce3+ and Nd3+/Yb3+ codoped YAG by sol-gel method. When excited by visible light, efficient NIR emission at 1064 and 1028 nm were observed and the energy transfer from Ce3+ to Nd3+/Yb3+ were proved. The optimum composition of Ce3+ and Nd3+/Yb3+ codoped YAG were Y2.82Ce0.12Nd0.06Al5O12 and Y2.76Ce0.12Yb0.12Al5O12, and the corresponding energy transfer efficiencies were calculated to be 44% and 57%. The mechanisms of the ET processes between Ce3+ and Nd3+/Yb3+ were compared. The results show that it is inappropriate to codope the ion pairs that are composed of one ion that tends to be oxidized and another one that tends to be reduced through the charge transfer state, such as the ion pair of Ce3+–Yb3+. Ce3+–Nd3+ codoped YAG can obtain more effective emission in the desired near-infrared region through broadband absorption and first-order energy transfer. It shows potential application to improve the conversion efficiency of Si solar cells by realization of efficient spectral modification of solar spectrum.
ACKNOWLEDGMENTS
This work was financially supported by the National Natural Science Foundation of China (Grant No. 50872123 and 50802083), National Basic Research Program of China (Grant No. 2006CB8060007), and the Program for Changjiang Scholars and Innovative Research Team in University (Grant No. IRT0651).