Introduction
Ruminant production in many tropical regions is limited by poor-quality diets that are often deficient in nitrogen and have low digestibility. Improvement in the nutrient utilization of low-quality roughages would substantially improve ruminant productivity and milk production. In particular, roughage-based diets which are low in S are often poorly utilized (Moir, Reference Moir1975). Provision of S supplements to animals fed these diets, or as fertiliser to tropical grasses has resulted in improvements in intake, fiber digestion and rumen fungal numbers (Rees et al., Reference Rees, Minson and Smith1974; Rees and Minson, Reference Rees and Minson1978; Morrison et al., Reference Morrison, Murray and Boniface1990).
It was suggested that fungal populations could be selectively stimulated with organic sources of sulfur (e.g. 3-mercaptopropionic acid (MPA); 3-mercapto-1-propane sulfonic acid (MPS)) which may be preferentially utilized by anaerobic rumen fungi (ARF) (Gordon, Reference Gordon1985; Phillips and Gordon, Reference Phillips and Gordon1991; Onoda et al., Reference Onoda, Kobayashi and Hoshino1996). However, recent studies have demonstrated that these reduced sulfur compounds were utilized by ARF, cellulolytic bacteria and other rumen microorganisms (McSweeney and Denman, Reference McSweeney and Denman2007). In particular, supplementation of cattle with MPA resulted in an increase in microbial protein synthesis, although an equivalent response was achieved with sodium sulfate. However, there are in vitro studies which indicate that some organic forms of S have a greater stimulatory effect on microbial synthesis than inorganic S (Gil et al., Reference Gil, Shirley and Moore1973; Kahlon et al., Reference Kahlon, Meiske and Goodrich1975). We therefore decided to evaluate in cattle the other inorganic S compound (MPS), which (McSweeney and Denman, Reference McSweeney and Denman2007) demonstrated in vitro as a growth stimulant for cellulolytic rumen bacteria and fungi. In this current trial, we wanted to determine whether MPS would have a greater benefit than sodium sulfate on feed intake, microbial population dynamics, digestibility and rumen fermentation in cattle fed the low-S roughages, in order for this compound to be of practical benefit due to the relative costs of organic and inorganic S supplements. Furthermore, the study of McSweeney and Denman (Reference McSweeney and Denman2007) showed that improved ruminal fermentation of a poor quality tropical roughage which is deficient in N and S, requires supplementation with both these nutrients in a balanced manner to meet the requirements of rumen microorganisms for efficient microbial protein synthesis. Although fermentation was enhanced in that study with S supplementation, ruminal ammonia N was also below optimal levels when the N/S ratio was about 11 and therefore, efficiency of microbial protein synthesis may have increased further with additional N supplementation. In tropical feeding systems, supplementary N is typically provided in the form of urea as an inexpensive nutrient, but the levels of supplementary urea and S need to be balanced to avoid ammonia toxicity. Therefore in the current trial, we provided additional urea in the S supplemented groups to achieve a higher N/S ratio, but lower levels of urea were fed to the controls thus achieving a similar N/S ratio, thus avoiding potential ammonia toxicity.
Material and methods
Animals, experimental design and diets
Two cattle feeding trials (experiments 1 and 2) were conducted to examine the effect of MPS on feed intake, digestibility and rumen function. Experiment 1 was conducted at the CSIRO Rendel Laboratory (Rockhampton, Australia), while experiment 2 was undertaken at the National Institute of Animal Nutrition and Physiology (Bangalore, India). In experiment 1, S was supplemented in equivalent amounts as either MPS or sulfate, whereas in experiment 2 twice the amount of S was provided as MPS compared with sulfate. Higher levels of S were provided as MPS in experiment 2, because rumen sulfide levels in MPS animals were significantly lower than the sulfate-fed animals in experiment 1 when equivalent amounts of S were provided, which may indicate differences in the bioavailability of S in MPS and sulfate.
Experiment 1: Twelve rumen-fistulated steers, 333 ± 9.5 kg liveweight (mean ± s.e.) were fed a basal diet of Angleton grass (Dicanthium aristatum) (g/kg; organic matter (OM) 895, NDF 792, ADF 500, Ash 105 and mg/kg; Al 42, B 14, Ca 3242, Cu 0.5, Fe 71, K 4083, Mg 848, Mn 47, N 2670, Na 107, P 1043, S 997, Zn 14), which was deficient in S, N and P. Experiment 1 was conducted over two periods. In period 1, the animals were initially adapted to the Angleton grass for 3 weeks in pens before transferring to metabolism crates for a 9-day digestion trial. The animals were then returned to pens for period 2 of the trial, and allocated equally on feed intake to three treatment groups as follows: (1) Angleton grass (control); (2) Angleton grass plus 9.56 g/day anhydrous sodium sulfate (sulfate) and (3) Angleton grass plus 6.0 g/day anhydrous sodium MPS. Urea/phosphoric acid supplement solution (urea, 447.4 g/l; 85% w/w ortho-phosphoric acid, 98.5 g/l) was sprinkled on the feeds (48.8 ml/kg for all animals during period 1, for controls in period 2 and 68.3 ml/kg for S supplemented animals in period 2) to increase the N and P content to 1.4% and 0.345%, respectively, for control animals and 1.8% and 0.441%, respectively, for S supplemented animals on a dry weight basis. The N/S ratio in the feed for the animals was 13.7. Higher levels of urea were fed to animals supplemented with S containing compounds to ensure that there was adequate N available for optimal microbial protein synthesis. The controls were fed lower levels of urea since the deficiency in S could limit N utilization and thus result in toxicity if higher levels of urea had been fed. The S supplements (equivalent to 2.1 g S/day) were mixed with 40 g sucrose/day to ensure complete consumption and placed in a separate container beside the Angleton/urea/P feed. The controls were given an equivalent amount of sugar. After adaptation to the diets for 2 weeks, the animals were again placed in metabolism crates for digestion studies involving measurements of dry matter intake (DMI), nutrient digestibility, rumen microbial protein synthesis and microbial population analysis (period 2). In this experiment, equivalent amounts of S were provided as either MPS or sulfate.
Experiment 2: Eighteen Holstein Friesian crossbred heifers, 275 ± 9 kg liveweight were fed ad libitum a basal diet for 6 weeks consisting of rice straw (g/kg; OM 861, NDF 816, ADF 528, Ash 139), which was low in S and deficient in N (mg/kg; S 1100, N 6000) plus 250 g wheat bran (g/kg; OM 934, NDF 354, ADF 120, Ash 65.9, S 2.4, N 25.6) daily. At the end of the 6-week adaptation period, the animals were randomly distributed to three groups of six animals as follows: (1) basal diet (control); (2) basal diet plus 6.6 g/day anhydrous sodium sulfate (sulfate; 1.45 g S/day) and (3) basal diet plus 8.0 g/day anhydrous sodium MPS (Na-MPS; 2.88 g S/day). Wheat bran was supplemented with urea at the rate of 50 g/day in controls and 80 g/day in sulfate and MPS treatments to maintain equal nitrogen : sulfur ratio (10 : 1) in the control and sulfate groups. At the end of 5 weeks of supplemental feeding, a digestibility trial was carried out for assessing the effect of sulfur supplements on DMI and nutrient digestibility. Experiment 2 was conducted over one period only.
Digestibility studies and rumen analyses
Experiment 1: Feed intake, fecal output and urine production were determined for a 6-day period during each digestion trial and rumen samples were collected for 3 days at approximately 4, 8, 12 and 24 h after the start of feeding each day. Digesta samples were taken by hand from three sites within the rumen (anterior, central and posterior) and passed through a screen with a mesh size of 2×1.5 mm2. Sub-samples of rumen liquor were taken for analysis of sulfide, volatile fatty acids (VFA), ammonia and MPS. Ammonia levels were estimated by the indophenol method of Chaney and Marbach (Reference Chaney and Marbach1962) and fatty acids were determined by gas chromatography as described by McSweeney and Denman (Reference McSweeney and Denman2007).
The pooled filtrate, in excess of 200 g per sampling, which contained rumen fluid and plant particles, was then stored at −80°C until DNA was extracted for microbial population analysis. During the 6-day collection periods, samples of feed offered and any residues were taken daily, pooled for each animal and stored at −20°C. A constant daily aliquot (10% w/w) of feces from each animal was also pooled for the 6 days. Total daily urine production was collected into 100 ml of 20% (v/v) sulfuric acid to give a final pH of less than 3 and a daily proportion (0.4% v/v) of each urine collection was pooled for the 6-day period and stored at −80°C until analyzed for urinary purines.
Experiment 2: Feed intake, fecal output and urine production were determined for a 7-day period and rumen samples were collected by stomach tube before (0 h) and after (6 h) feeding. Samples of feed, residues and feces were ground and analyzed in duplicate for dry matter (DM), total ash and fiber fractions (Goering and Van Soest, Reference Goering and Van Soest1970; AOAC, 1990). Rumen ammonia nitrogen levels were estimated by mixing equal volumes of rumen liquor, saturated K2CO3 and boric acid in a Conway dish which was then titrated against 0.1 N HCl (Conway, Reference Conway1962). Total rumen VFA analysis was performed using steam distillation and the distillate was collected in a conical flask and titrated against NaOH using phenolphthalein as an indicator (Barnett et al., Reference Barnett, John and Reid1956).
Chemical preparation and analyses
Animals were supplemented with anhydrous sodium sulfate (22.5% S) and MPS sodium salt (C3H7NaO3S2; MW = 178.19, 36% S; Fluka Chemika, GmbH, Steinheim, Germany).
Rumen sulfide
Immediately after collecting rumen liquor, a sub-sample (3.5 ml) was taken for sulfide analysis with a sulfide-specific ion electrode (Model 9616 Sure-Flow Combination Silver/Sulfide Electrode; Thermo Orion, Beverly, MA, USA) connected to a specific ion meter (pH/ISE Meter Model 710A, Thermo Orion, Beverly, MA, USA) following the manufacturer’s instructions and the method of Khan et al. (Reference Khan, Morris and Hidiroglou1980). The sub-sample was stabilised by mixing with an equal volume of freshly prepared sulfide antioxidant buffer (SAOB) aqueous solution (8% NaOH, 7.16% Na2EDTA, add 3.52% ascorbic acid before use) and centrifuged (16 000 × g; 10 min) prior to analysis.
Mercaptopropane sulfonic acid
Samples of rumen fluid were taken from the MPS-treated animals for HPLC analysis of MPS, using a modification of the pre-column fluorescent labeling procedure of Mopper (Reference Mopper1984). With a minimum exposure to air, rumen fluid (800 μl) was added to an anaerobic solution (gassed with N2) of formic/mercaptoethanol solution (36 μl; 12.5% v/v formic acid: 10 mmol mercaptoethanol) and centrifuged (12 000 × g; 10 min). A sample (200 μl) was derivatised with fresh anaerobic o-phthaldialdehyde (OPA) solution (50 μl, 75 mmol OPA in methanol) and borate/ethanolamine buffer (1 ml; pH 7.6; 0.7 M K borate/9 mmol ethanolamine). MPS sample (10 μl) was separated on a Phenomenex column Luna C18(2) (100 × 4.6 mm, 3 μm particles) using a Phenomenex C18 guard column (Phenomenex Inc., Torrance, CA, USA), Waters 510 pumps and a Waters 486 fluorescence detector (Waters Corp., Mass, USA). The HPLC was performed using isocratic mobile phase conditions (0.75 ml/min at ambient temperature) as follows: 6 min at 40% A (5 mmol NaOAc, pH 5.7) and 60% B (methanol), 3 min at 100% B, and 6 min at 40% A and 60% B. MPS standards were prepared in buffer (5 mmol NaOAc/0.1 mmol Na2EDTA, pH 4) and kept under anaerobic conditions before analysis.
Urinary purines
Microbial protein flow from the rumen was estimated by the urinary purine method (Chen et al., Reference Chen, Hovell, Orskov and Brown1990; Chen and Gomes, Reference Chen and Gomes1992). Urine was collected daily for 6 days from each animal into a container with approximately 100 ml of 10% H2SO4. A sub-sample (50 ml) was taken each day and stored at −20°C. Urine was analyzed for allantoin, uric acid, xanthine and hypoxanthine to determine total purines. The urinary purines, allantoin and creatinine were separated by HPLC using a Luna Amino (NH2) column (250 × 4.6 mm; 5 μm particles) with a mobile phase A (90% acetonitrile: 10% water) for 10 min, then mobile phase B (60% acetonitrile: 40% water) for 30 min, followed by phase A for 15 min at a flow rate of 1 ml/min. Photodiode array (PDA) detection (Waters 996 Photodiode Array Detector, Waters Corp.) enabled separate integrations for creatinine and allantoin at 235 and 214 nm, respectively. Uric acid was determined by the enzymatic UV-absorbance method described by Chen and Gomes (Reference Chen and Gomes1992).
Ruminal DNA extraction and quantitative PCR analysis of rumen microorganisms
Total microbial genomic DNA was isolated from rumen sub-samples by employing the FastDNA kit and FastPrep instrument (Q-BIO gene, Quebec, Canada) as per the manufacture’s instructions. A rumen sub-sample (1.5 ml) was taken from the 200 ml rumen sample using a wide-bore pipette so as to ensure a homogeneous sample containing fluid and digesta.
Real-time PCR assays were performed on an ABI PRISM® 7900HT Sequence Detection System (Applied Biosystems, Foster City, CA, USA) for monitoring of ARF and the cellulolytic bacteria, Fibrobacter succinogenes and Ruminococcus flavefaciens as described by Denman and McSweeney (Reference Denman and McSweeney2006). The population sizes of specific bacterial groups were expressed as a percentage relative to the estimated abundance of total bacterial 16S rRNA gene. PCR primers used for each microbial group are described by Denman and McSweeney (Reference Denman and McSweeney2006). Biomass of ARF was estimated from quantitative real-time PCR results using a conversion factor of 1 mg of total rumen fungal biomass per 13 μg fungal DNA (Denman and McSweeney, Reference Denman and McSweeney2006).
Experimental design and statistical analyses
In experiment 1, the effect of diets on microbial populations, VFA, ammonia and sulfide levels were analyzed as a randomized two-factor nested design, with the first factor being increased N and the second factor being the two S compounds nested within the increased N factor. Differences among the means were determined by the method of least significant difference ranging from 5% (P < 0.05) to 0.1% (P < 0.001) using analysis of variance (ANOVA) procedures of Statistica 6.0 software (StatSoft, Inc., Tulsa, OK, USA). A similar randomized two-factor nested design was used in experiment 2, to analyze the effect of diets on DM intake, digestibility of DM, OM, ADF and rumen pH, NH3-N and total volatile fatty acid (TVFA) using the generalized linear model (GLM) procedures of the statistical package SPSS 7.5 version (SPSS Inc., Chicago, IL, USA).
The limitation of the current experimental design, in terms of its inability to estimate the interaction between S and N (i.e., S treatment only applied to individuals within the N factor), was deliberate to avoid ammonia toxicity, which may have occurred if the higher urea levels were also provided to the control animals with low-S intake.
Results
Experiment 1
DM intake and digestibility did not change significantly within each treatment group between periods 1 and 2. During period 2, DMI was not significantly different between S-supplemented animals and unsupplemented controls. Urinary purine excretion and intestinal flow of microbial N increased significantly (P ⩽ 0.01) in the sulfate and MPS supplemented animals, whereas the control group was unaffected (Table 1).
Effect of sulfur supplements on intake, digestibility and microbial protein flow from the rumen in steers fed a roughage diet (experiment 1)

MPS = 3-mercapto-1-propane sulfonic acid.
Mean values in rows which do not have a common superscript are significantly different (P ⩽ 0.01).
s.e. given in parenthesis.
*Estimated from urinary purine excretion data.
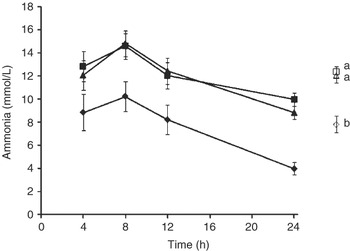
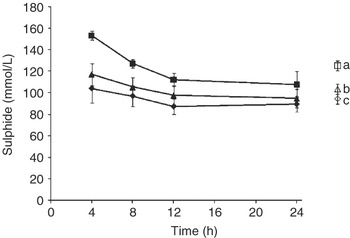
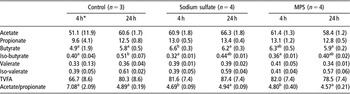
The mean N and S intakes (g/day) for the three treatments were: control (81, 5.8), sulfate (116, 8.6) and MPS (108, 8.2), respectively. Mean theoretical N/S ratios, based on intakes for the 6-day digestion period were 14.0 for controls, 13.5 for sulfate steers and 13.3 for the MPS-supplemented steers. Ammonia levels at 3.5 h after feeding reflected this difference in N intakes between the treatments. The animals on the sulfate and MPS diets had significantly higher (P < 0.001) levels of ammonia compared with that of the control group (Figure 1). During the 24 h after feeding, the pattern of ammonia production and utilization was similar, and ammonia levels declined in all groups by approximately 5 mmol. Ammonia levels in the three treatments were above optimal N levels (3.3 mmol ammonia) throughout the entire day and the lowest ammonia concentration (3.9 mmol) only occurred in the control group before feeding. Rumen sulfide concentrations were significantly higher (P < 0.001) in the sulfate-supplemented animals (153 to 108 μM) compared with the MPS-treated group (117 to 95 μM) and the controls (102 to 89 μM), but the MPS group was also higher (P < 0.05) than the controls (Figure 2). The acetate to propionate ratio was significantly lower in MPS and sulfate animals 4 h after feeding, but not at 24 h, and there were no differences between the groups in short chain volatile fatty acid (SCVFA) to branched chain volatile fatty acid (BCVFA) ratio at either of these times except for the sulfate-treated cattle, which were higher than the controls just after feeding (Table 2).
Ruminal ammonia levels in response to S supplementation. Data points are the mean (±s.e.) of three or four animals over three sampling periods: Control, three animals (⧫); sulfate, four animals (▪) and MPS, four animals (▴). Pooled means (open symbols) and standard error bars for each treatment are presented and values that do not share common letters indicate significant differences (P < 0.001).

Ruminal sulfide levels in response to S supplementation. Data points are the mean (±s.e.) of three or four animals over three sampling periods: Control, three animals (⧫); sulfate, four animals (▪) and MPS, four animals (▴). Pooled means (open symbols) and standard error bars for each treatment are presented and values that do not share common letters indicate significant differences (P < 0.05).

Effect of sulfur supplements on ruminal volatile fatty acids (mmol/l) in steers fed a roughage diet (experiment 1)

MPS = 3-mercapto-1-propane sulfonic acid; TVFA = total volatile fatty acid.
Values in rows with different superscripts vary significantly at the respective time (P < 0.05).
s.e. given in parenthesis.
*4 and 24 h after feeding.
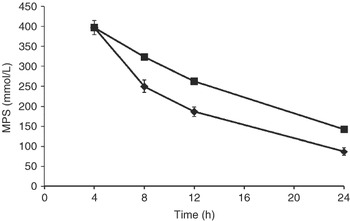
The levels of MPS within the rumen of the MPS supplemented animals decreased more rapidly than the calculated loss from a ruminal fluid turnover rate of 4.40%/h for cattle fed Angleton grass (Figure 3; see McSweeney and Denman, Reference McSweeney and Denman2007).
Levels of MPS detected within the rumen. Data points are the mean (±s.e.) of four animals over three sampling periods. MPS (⧫) and 4.4% rumen turnover (▪).

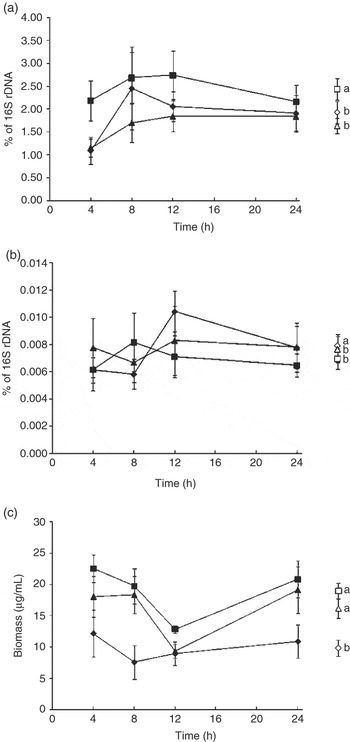
Data generated from real-time PCR assays for fibrolytic bacteria are expressed as a percentage of total rumen bacterial 16S ribosomal gene abundance, whereas total fungal populations are quantified as biomass (Figure 4). Analyzed data showed a significant effect (P < 0.01) for diet but there was no significant (P > 0.10) diet–sampling day interaction and therefore, the data presented here was pooled from the three consecutive sampling days for each diet. The S supplements had contrasting effects on the abundance of fibrolytic bacteria populations and total anaerobic fungi. The population of F. succinogenes for sulfate supplemented animals was significantly higher at all sampling times compared to the MPS (P < 0.001) supplemented and control (P < 0.05) diets (Figure 4a). There were no significant differences in abundance of the R. flavefaciens population between treatments (Figure 4b). The ARF biomass was approximately two-fold higher (P < 0.001) in both MPS and sulfate-supplemented animals compared to that with the controls (Figure 4c).
qPCR data representing specific bacterial targets with respect to percentage of total bacterial 16S rDNA: (a) Fibrobacter succinogenes, (b) Ruminococcus flavefaciens and (c) biomass of anaerobic fungi. Data points are the mean (±s.e.) of three or four animals over three sampling periods: Control, three animals (⧫); sulfate, four animals (▪) and MPS, four animals (▴). Pooled means (open symbols) and standard error bars for each treatment are presented and values that do not share common letters indicate significant differences (P < 0.05).

Experiment 2
DM intake and digestibility was not significantly different between treatment groups (Table 3). The mean N and S intakes (g/day) for the three treatments were: control (65, 7.2), sulfate (78, 8.6) and MPS (78, 9.9), respectively. Mean theoretical N/S ratios, based on intakes for the 7-day digestion period were 9.0 for controls, 9.1 for sulfate heifers and 7.9 for the MPS supplemented heifers. The rumen liquor samples did not show any significant differences in pH, whereas ammonia N was significantly lower at pre-feeding (P < 0.05) and 6 h post feeding (P < 0.01) in the MPS group compared with the other two treatments (Table 4). The total VFA concentration at 6 h after feeding was significantly higher (P < 0.05) in MPS animals compared with the other groups.
Effect of sulfur supplements on intake and digestibility in heifers fed rice straw (experiment 2)

MPS = 3-mercapto-1-propane sulfonic acid.
s.e. given in parenthesis.
Effect of sulfur supplements on ruminal fermentation characteristics in heifers fed rice straw (experiment 2)

MPS = 3-mercapto-1-propane sulfonic acid; TVFA = total volatile fatty acid.
Values in rows with different superscripts vary significantly within the respective sampling time.
s.e. given in parenthesis.
*P < 0.05, **P < 0.01.
Discussion
Earlier research has demonstrated that inorganic S is mainly dissimilated to sulfide in the rumen before utilization for microbial protein synthesis, whereas organic forms of S can be incorporated directly into microbial protein without entering the ruminal sulfide pool (McMeniman et al., Reference McMeniman, Ben-Ghedalia and Elliott1976; Kennedy and Milligan, Reference Kennedy and Milligan1978; Kandylis, Reference Kandylis1981). Organic forms of S may also have a greater stimulatory effect on microbial synthesis than inorganic S (Gil et al., Reference Gil, Shirley and Moore1973; Kahlon et al., Reference Kahlon, Meiske and Goodrich1975). However, there have been few in vivo studies undertaken to compare the relative productivity benefits when ruminants are fed equivalent amounts of S in an inorganic or organic form (Bull and Vandersall, Reference Bull and Vandersall1973; Champredon et al., Reference Champredon, Pion and Basson1976; McMeniman et al., Reference McMeniman, Ben-Ghedalia and Elliott1976). A recent study showed that cattle supplemented with either sodium sulfate or the organic sulfur compound, MPA, stimulated different rumen microbial populations, but this translated into a similar increase in rumen microbial protein flow from the rumen for both groups, although MPA also increased VFA concentration (McSweeney and Denman, Reference McSweeney and Denman2007). Similar results were observed in the current experiments when the organic sulfur compound, MPS, was compared with sodium sulfate. The forage (Angleton grass) used in this study had a S : N ratio of 0.373, which is above the recommended ratio of 0.07 for cattle (AOAC, 1990). However, the diets needed to be supplemented with both S and N due to the low concentration of both S (997 mg/kg) and N (2670 mg/kg) in the forage (AOAC, 1990). Supplementation of Angleton grass with either sulfate or MPS in experiment 1 resulted in an increased excretion of urinary purines, which presumably reflected an apparent increase in flow of rumen microbial protein from the rumen. Sulfur supplementation did not significantly change whole-tract DM digestibility or DMI even though it was associated with an increase in the relative abundance of the fibrolytic bacteria, F. succinogenes, and the ARF.
It would appear that both forms of supplemental S, in conjunction with additional urea N, resulted in an increased efficiency of microbial protein synthesis in the rumen in experiment 1. Even though the controls received two-thirds the amount of urea compared with the S supplemented groups, the rumen ammonia N concentrations in all treatments were above the optimal levels of 4.3 to 5.7 mmol (60 to 80 mg N/l) for microbial growth (Pisulewski et al., Reference Pisulewski, Okorie, Buttery, Haresign and Lewis1981). The levels of sulfide in the controls and MPS supplemented animals were below the concentration of 120 μM (3.8 mg/l), which Kandylis (Reference Kandylis1981) indicated, was required for maximal microbial growth. However, the sulfate-supplemented animals had optimal sulfide levels compared with the MPS animals, which indicates that the bioavailability of the two S atoms in MPS may limit sulfide production, or the MPS molecule may be metabolized and incorporated into microbial protein without first being converted to sulfide. Earlier in vitro studies demonstrated that ARF and cellulolytic ruminal bacteria probably incorporate S from MPS into microbial protein via an assimilatory pathway, rather than through sulfide production via the dissimilatory sulfate-reducing pathway (McSweeney and Denman, Reference McSweeney and Denman2007). Therefore, we concluded from experiment 1 that efficiency of microbial protein synthesis may have been increased further with higher levels of MPS, which was tested in experiment 2 by feeding twice the amount of S as MPS compared with sulfate.
In experiment 2, there was an increase in concentration of TVFA and ammonia utilization when higher levels of S were provided as MPS, even though S and N were above requirements for growing cattle in both S treated groups (AAC, 1990). Similarly, the organic S compound, MPA, also increased ruminal TVFA compared with sulfate supplementation in an earlier study (McSweeney and Denman, Reference McSweeney and Denman2007). These responses in rumen fermentation may indicate higher ruminal digestibility with the MPS and MPA supplementation compared with the inorganic S treatments, although this occurred without a change in feed intake or total tract fiber digestibility. It is possible that an increase in fiber digestibility in the rumen, with MPS, resulted in a decrease in digestibility post ruminally without a change in total tract digestion. Losses of MPS from the rumen were greater than that of the 4.40 (±0.41)%/h mean rumen fluid-turnover rates for six steers fed Angleton grass supplemented with urea/sulfur (McSweeney and Denman, Reference McSweeney and Denman2007), thus indicating utilization of MPS within the rumen. The beneficial effects of higher levels of MPS on rumen fermentation may indicate that different microbial populations are incorporating S either directly or via the dissimilatory route as sulfide.
In conclusion, supplementation of a S-deficient low-quality roughage diet, with either MPS or sodium sulfate in conjunction with compensatory N, improved rumen fermentation through an apparent increase in microbial protein synthesis. However, it should be noted that this is a preliminary observation based on urinary purine analysis, which is only a predictor of microbial protein flow to the duodenum, and that absolute values should be confirmed by direct measurements of duodenal microbial protein as demonstrated by Firkins et al. (Reference Firkins, Hristov, Hall, Varga and St-Pierre2006). Nevertheless, MPS appeared to have a greater effect on stimulating VFA production and ammonia utilization when provided at higher concentrations than sulfate, even though S was above the recommended levels in both treatments. Similar effects on rumen fermentation have been reported with MPA. Thus, the metabolism of organic S compounds by rumen microorganisms needs to be investigated further in comparison with inorganic forms of S, because it may prove to be more effective in stimulating fermentation of roughage diets.
Acknowledgment
This work was partially supported by the Australian Centre for International Agricultural Research.