Introduction
The adsorption of molecules into solid surfaces is a subject of interest in a wide range of scientific disciplines that include topics from catalysis up to the origins of life (Varma Reference Varma2002; Ferris Reference Ferris2006; Nagendrappa Reference Nagendrappa2011). Specifically, the phenomenon of selective adsorption–desorption of organic compounds is important for heterogeneous catalysis studies and in pharmacology for drug design. New data about possible routes to form molecules that are important to prebiotic synthesis are obtained through the self-assembly of organics by increasing their local concentration in specific places of the inorganic surface. This process should be fundamental to promote the complication of matter towards higher structures and functions (Hazen Reference Hazen2005). It has been largely demonstrated that many biochemical compounds that are essential for life can be synthesized from simpler molecules (Plankensteiner et al. Reference Plankensteiner, Reiner, Schranz and Rode2004; Saladino et al. Reference Saladino, Crestini, Costanzo, Dimauro and Walde2005) whose composition and structure are sufficient and versatile enough to enable the formation of new molecules with higher complexity (Anumukonda et al. Reference Anumukonda, Young, Lynn, Buckley, Warrayat, Graves, Bean and Hud2011; Li et al. Reference Li, Hernandez, Grover, Hud and Lynn2011; Cafferty et al. Reference Cafferty, Gállego, Chen, Farley, Eritja and Hud2013). This assumption is supported by the finding of small organics in extraterrestrial bodies (Ehrenfreund & Charnley Reference Ehrenfreund and Charnley2000; Botta & Bada Reference Botta and Bada2002) and in interstellar dust; for example, dust grains function as nucleators, and they accrete molecules, forming sheets.
A key molecule for prebiotic synthesis is hydrogen cyanide (HCN); this molecule or its derivatives has been detected widely in different places in the solar system, such as in the atmosphere of planets or their satellites (Vuitton et al. Reference Vuitton, Yelle and Anicich2006). Other organics such as nitrile-containing compounds have been detected in circumstellar envelopes (Matthews & Sears Reference Matthews and Sears1986) and dark clouds (Johansson et al. Reference Johansson, Andersson, Ellder, Friberg, Hjalmarson, Hoglund, Irvine, Olofsson and Rydbeck1984). Indeed, HCN has also been discovered in the atmospheres of some stars, in various satellites, and in the tails of comets (Ip et al. Reference Ip, Balsiger, Geiss, Goldstein, Kettmann, Lazarus, Meier, Rosenbauer and Shelley1990; Magee-Sauer et al. Reference Magee-Sauer, Mumma, Disanti, Russo and Rettig1999). HCN has also been observed in volcanic emissions (Mukhin Reference Mukhin1974); in simulated experiments, HCN is readily formed (Oró Reference Oró1961), and it could have also been produced by impact-shock synthesis (Sugita & Schultz Reference Sugita and Schultz2009). Such empirical data suggest that HCN was existent in the primitive Earth (Abelson Reference Abelson1966), making this generalization the main reason to use this molecule in current experiments. For instance, since the classical experiments of Miller (Reference Miller1955, Reference Miller1957) and Oró (Reference Oró1961), this molecule has been proposed as an important precursor for the synthesis of biological building blocks such as amino acids, amides and simple nuclear bases (Ferris & Hagan Reference Ferris and Hagan1984; Jung & Choe Reference Jung and Choe2013) because HCN easily volatilizes and, as a consequence, the local concentration of HCN molecules might have been a critical factor for prebiotic polymerization reactions to take place. Particularly, calculations of the hydrolysis and production rates of HCN estimated that at 100 °C and pH 7, its concentration was only 4×10⁻¹² mol l−1 (Stribling & Miller Reference Stribling and Miller1987; Miyakawa et al. Reference Miyakawa, James Cleaves and Miller2002) whereas at lower temperatures (0 °C), the estimated concentration was 2×10⁻⁵ mol l−1. For these reasons, a concentrating mechanism should have been necessary to enable the chemical reaction of molecules. In the case of HCN, freezing (Miyakawa et al. Reference Miyakawa, James Cleaves and Miller2002) and the formation of ferrocyanide [Fe(CN)6]4− (Navarro-González et al. Reference Navarro-González, Negrón-Mendoza, Aguirre-Calderón and Ponnamperuma1989; Arrhenius et al. Reference Arrhenius, Arrhenius and Paplawsky1994) are proposed as the molecule-concentration mechanism. In addition, mineral surfaces might exhibit local functional groups (Rimola et al. Reference Rimola, Costa, Sodupe, Lambert and Ugliengo2013) that promoted the increase of local molecular concentrations (Coyne Reference Coyne1985; Schwartz Reference Schwartz1996; Pontes-Buarque et al. Reference Pontes-Buarque, Tessi, Bonapace, Monte, de Souza-Barros and Vieyra2000; Sodupe et al. Reference Sodupe, Rimola and Ugliengo2011), thus the mineral structure and its composition are of main importance in understanding the complexation of organics. The adsorption of different biomolecules such as amino acids (Zaia Reference Zaia2004; López-Esquivel Kranksith et al. Reference López-Esquivel Kranksith, Negrón-Mendoza, Mosqueira and Ramos-Bernal2010) or nucleobases (Sowerby et al. Reference Sowerby, Cohn, Heckl and Holm2001; Guzmán et al. Reference Guzmán, Negrón-Mendoza and Ramos-Bernal2002) on different surfaces has been explored to give an insight into the chemical evolution and self-organization of organics in mineral surfaces (Cafferty et al. Reference Cafferty, Gállego, Chen, Farley, Eritja and Hud2013). Here, we present an experimental and theoretical approach (a molecular simulation) to explain, at the molecular level, the affinity of the HCN to the surface of the crystalline sodium montmorillonite and explore its potential implications for chemical evolution.
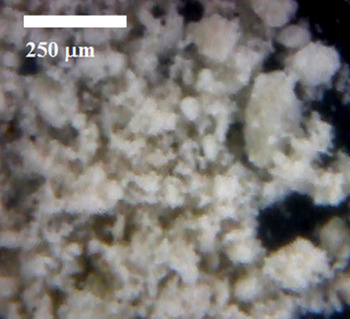
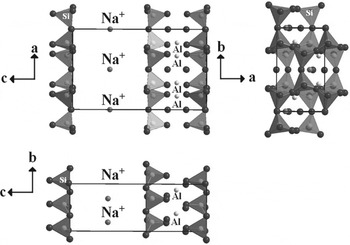
Montmorillonite (Fig. 1) is a smectite clay consisting of stacks of negatively charged aluminosilicate layers separated by charge-balancing cations in the interlayer region (Gournis et al. Reference Gournis, Lappas, Karakassides, Többens and Moukarika2008). In sodium montmorillonite (Fig. 2), layers are formed by an octahedral sheet combined with two tetrahedral ones (2 : 1 clay). The layers are stacked in parallel but are separated by interlamellar channels, which house diverse cations (Na+, K+, Ca2+). The main forces holding the layers together are electrostatic forces and van der Waals interactions. As a consequence, the adsorption of organic molecules on clays can occur in two places: at the edges of the crystal structure or in the interlamellar channel.
Sodium montmorillonite as seen by light microscopy. The small particle-size determines a high surface area.

Unit cell of montmorillonite. Oxygen (tetrahedra corners), octahedral layer (black arrows), silicon (center of tetrahedra) and exchangeable cations (gray arrow). The distinctive structural features are the basal planes (gray arrow heads).

Materials and methods
Preparation of aqueous solution samples
HCN solution (0.1 mol l−1) was produced in situ by the reaction between KCN and H2SO4 (Sigma-Aldrich). HCN gas was dissolved into pure, triple-distilled water. The concentration was determined by titration with AgNO3 aqueous solution (0.02 mol l−1 Sigma-Aldrich).
To test the adsorption of the organic molecules, natural sodium montmorillonite (a=5.17, b=8.94, c=9.95, Z=1; beta=99.9°, V=453.04, S.G.C 2/m) from Crook County (Wyoming, USA) was selected (standard batch SWY-1 (OH)4Si8(Al3.34Mg0.66O20) (Ross & Hendricks Reference Ross and Hendricks1945). Its cation-exchange capacity (defined as the maximum quantity of total cations that the clay is capable of holding) was determined experimentally (101 meq Na+/100 g) at Instituto Mexicano del Petróleo (Mexico).
Adsorption experiments
The HCN solutions (5 ml) were mixed with 1 g of the mineral and kept on agitation for 15, 30, 60 and 120 min. To know the effect of pH in the system, other experiments were conducted by the addition of diluted HCl (1 : 50 v : v) up to pH 2 with continuous stirring.
Additionally, to the experiments with acid pH, a complementary test was done with solutions at alkaline pH values. For this purpose, a solution of KCN with a concentration of 0.1 mol l−1 was prepared, and adsorption experiments were done as previously described.
After agitation, all samples were centrifuged at 15 000 rpm for 15 min. The pH of the samples before and after agitation was measured. The percentage of adsorption was determined in the supernatant by gas chromatography (Varian instrument aerograph, Series 2400 with a flame ionization detector). A stainless-steel column (4 ft long., 1/8 in i.d.) packed with Chromosorb-102 was used. The temperature regime was from 60 °C up to 250 °C with a heating rate of 6 °C min−1.
Determination of the site of molecular adsorption
To elucidate the adsorption site of HCN on sodium montmorillonite, an aliquot of the solution was treated with modified clay prepared from hexadecyltrimethylammonium (HDTMA) bromide salt with clay. HDTMA mainly enters into the interlamellar channel due to clay swelling in water, the alkylammonium ions block the cation exchange sites of the clay (Perezgasga et al. Reference Perezgasga, Serrato-Díaz, Negrón-Mendoza, Galán and Mosqueira2005). For this purpose, 5.84 g of HDTMA were diluted in 50 ml of ethanol and 20 g of clay (sodium montmorillonite) was added to the solutions. The mixture was stirred for 3 h at 150 rpm, after which it was centrifuged for 15 min at 15 000 rpm. The supernatant was discarded, and the clay was treated again with ethanol to remove the possible excess of HDTMA. The sample was stirred again for 20 min and centrifuged for 15 min; after this, the clay was dried and ground in an agate mortar.
Edge-blocked clay was prepared with a 0.01 mol l−1 solution (100 ml) of tripolyphosphate pentasodium salt (Na5P3O10·6H2O), that bids selectively to this site (Perezgasga et al. Reference Perezgasga, Serrato-Díaz, Negrón-Mendoza, Galán and Mosqueira2005), and 20 g of the clay; the mixture was stirred at 150 rpm for 1 h. Afterwards, the clay was washed with distilled water for 1 h (100 ml of distilled water agitating at 150 rpm), and the clay was then centrifuged for 30 min at 15 000 rpm. The montmorillonite clay was dried and ground in an agate mortar. Once the blocked clay was prepared (in the channel or at the edges), adsorption experiments similar to those experiments previously described were performed.
Analysis
X-ray diffraction
Samples were prepared as oriented samples following standard X-ray diffraction (XRD) procedures (Brindley & Brown Reference Brindley and Brown1980; Moore & Reynolds Jr. Reference Moore and Reynolds1997). The <2 μm fraction was separated by gravity settling, concentrated by centrifugation and prepared for XRD by sedimentation onto round glass slides. The concentration of the suspension was controlled to ensure that the weight of clay on the dried slide exceeded 2.5 mg cm−2. Measurements were performed in a Shimadzu XRD-6000 diffractometer operating with an accelerating voltage of 40 kV and a filament current of 30 mA, using CuKα radiation and graphite monochromator. All clay samples were examined by XRD in the air-dried form and saturated with ethylene glycol (EG). All the preparations were measured over a 2θ angle range of 2–70° (air-dried) and 2–20° (glycolated) with integrated time of 10 s and a step of 0.02 (2θ).
The peak position (2θ), the interplanar distance (d), the full-width at half-maximum and the integrated intensity of peaks were determined from oriented air-dried preparations using simple peak-weighting factors. For these estimations, we used Fityk (Wojdyr Reference Wojdyr2010), a program for data processing and non-linear curve fitting, simple background subtraction, and easy placement of peaks and changing of peak parameters.
Attenuated Total Reflectance Fourier Transform Infrared Spectroscopy (ATR-FTIR)
Vibrational spectroscopy yields important molecular structural information about the mineral interaction of water and surfactants and conformational changes of interlayer cations in montmorillonite (Katti & Katti Reference Katti and Katti2005). For silicates, specific information can be obtained from the S0i–O bonds, thus making feasible a structural characterization of the conditions of the silicon tetrahedra vibrations after functionalization or the interactions with organic molecules.
The FTIR spectra were obtained by using a single-reflectance accessory (PerkinElmer spectrum 400, USA) in a spectrometer (PerkinElmer spectrum 400, USA). The spectra were recorded at the absorbance from 4000 to 500 cm−1 at a resolution of 4 cm−1 over 128 scans per specimen. To determine the precise frequencies of the different chemical groups that were produced in the experiments, a cross-referencing was performed against previously reported group-specific frequencies.
Modelling
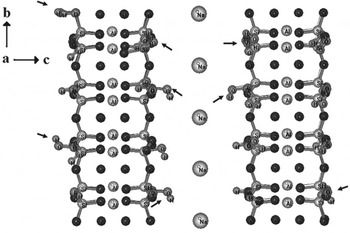
Molecular modelling was performed using molecular mechanics and molecular dynamics (the MM+method) implemented in the HyperChem program Version 7.1 (HyperCube, Canada). Geometry optimizations were performed to find the coordinates of molecular structures that represent the minimum potential energy (MM+force field, the Polak–Ribiere conjugate-gradient algorithm and a root-mean-square (RMS) gradient of 0.0001 kcal Å−1 mol−1). Molecular dynamics relaxation of the optimized structures was employed to obtain the possible local minimum (step size of 0.001 and 2 ps constant-simulation temperature of 300 K). One HCN molecule was optimized and then put in a modelled water box geometrically optimized (ca. 2600 water molecules each) with 2×2×2 unit cells of montmorillonite (cell parameters: C 1 2/m 1 (12) – monoclinic a=5.1750 Å, b=8.8960 Å, c=12.4500 Å, β=99.6900°, V=564.98 Å (ATOMS for Windows V6.4, Shape Software, USA) (Gournis et al. Reference Gournis, Lappas, Karakassides, Többens and Moukarika2008) with no HCN, with HCN and with HCN together with hydronium ions (H3O+) and further inclusion of ten ‘OH’ groups in the mineral structure (Fig. 3) to simulate the acid activation of the mineral at pH 2. In the mineral structure, calcium ions (Ca2+) were substituted by Na+. The most stable conformation (MM+method) was determined. Molecular dynamics is convenient to simulate global parameters; it simulates the evolution of a system over time, producing a trajectory of atomic positions and velocities. These calculations are used for statistically meaningful results. We saved the calculated trajectory as snapshots in the Hyperchem menu as suggested in the HyperCube manual for RMS deviations (Dx, equation (1)) of the kinetic energy, potential energy, total energy and temperature (EKIN, EPOT, ETOT and TEMP). The RMS procedure has been discussed for different molecular structures and accuracies evaluating the spatial difference between two static structures (equation (2)) (Knapp et al. Reference Knapp, Frantal, Cibena, Schreiner and Bauer2011):
 $$Dx = \sqrt {(x^2 ) - (x)^2}, $$
 $$x^2 = \left( {\displaystyle{1 \over n}\sum\limits_{i = 1}^n {x_i^2}} \right)\quad {\rm and}\quad {\rm (}x{\rm )}^2 = \left( {\displaystyle{1 \over n}\sum\limits_{i = 1}^n {x_i}} \right)^2, $$
where x i is the value of EKIN, EPOT, ETOT and TEMP; N denotes the number of atoms; and i the current pair of atoms (the target and the reference structure). For all the models, the mineral structure was deselected aiming to keep the crystallographic parameters (‘freezing’).
Representation of the (2×2×2) unit cells of montmorillonite, simulating the acid functionalization (putting OH groups). Black arrows show the modelled ‘OH’ groups.

Results and discussion
HCN adsorption experiments
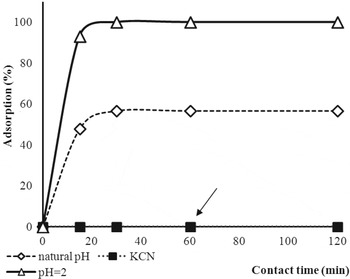
Indeed, HCN strongly interacts with sodium montmorillonite at low pH values. In the case of solutions at pH 6 (HCN 0.01 mol l−1 solution), the maximum adsorption (58%) is reached after 30 min of stirring; even if agitation continues, the adsorption presents no changes (Fig. 4). The effect of the pH in the adsorption was tested by putting the Na-montmorillonite in contact with the KCN solutions at pH=12 and further acidifying the media (pH=2). For the KCN solutions, adsorption was null even after 120 min of dipping the mineral in the solvent (arrows in Fig. 4). However, the adsorption of solutions at pH 2 showed an increase in the adsorption, reaching 100%. In general, in the case of adsorption of the HCN, the maximum occurs at acid pH. In our results we show that there is an effective adsorption of HCN on the sodium montmorillonite that might be dependent upon the physicochemical conditions.
Adsorption curves of HCN as a function of pH. The arrow shows that no adsorption is observed in the case of KCN.

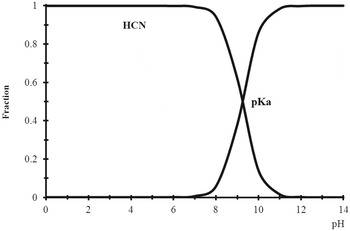
Sodium-related clays dissociate and release the cations that react with OH−, yielding the consecutive sodium hydroxide, making the medium more alkaline and giving rise to higher values of pH, close to 9, as seen in our results (Fig. 4). In this reaction, ion dissociation might be incomplete, and, close to pH 8, the hybrid clay–HCN system could be formed. This may explain the partial adsorption of HCN in the clay and the rise in the pH value. In the case of KCN, a molecule completely dissociated in water, no adsorption is seen. However, the change in the rate of adsorption changed remarkably when the pH value was adjusted to 2. In order to explain the differences, we constructed a species-distribution curve for HCN (Fig. 5). The curve shows that below and close to pH=7, HCN is present in the molecular form, while above this value the ion CN− is the predominant species. The anion CN− is negatively charged, and it should not be able to enter into the oxygen-rich channel of the clay that typically hosts positive ions (i.e. Na+), but its small size increased the possibility of getting into the negatively charged interlamellar channels. The same can occur with the non-dissociated HCN molecules. Although at neutral or acidic pH HCN is not dissociated and therefore has no net charge, it might be a small enough size to possibly enter into the channels. It is noticeable that HCN at pH 2 is protonated according to their pKa species distribution (Fig. 5), and for this reason the extent of adsorption is the largest within the negatively charged interlamellar spacing. However, differences in pKa cannot fully explain differences in the amount of adsorption. Other factors are important in determining the degree of adsorption on the clay, such as van der Waals forces, the ionic force of the solution, size, shape, co-adsorption phenomena and steric hindering of the molecules. At pH 6, most of the species are neutral or negatively charged and are not adsorbed into the negatively charged interlamellar spacing, but, there is still some adsorption. At pH 10, the species are negatively charged and do not show a clear adsorption of molecules.
Species-distribution diagram for HCN as a function of pH. The curve shows that beneath and around pH=7, HCN is in its molecular form, while above this value, the predominant species is the –CN. This could explain why HCN is differentially adsorbed at diverse pH values.

Site of molecular adsorption
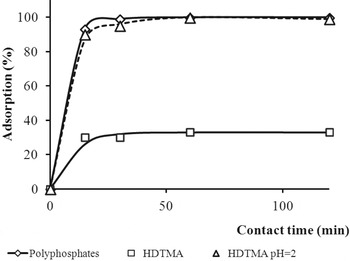
In 2 : 1 clays such as montmorillonite, adsorption can occur into two specific sites: the interlamellar channel or the edges of the clay. In the channel, there are cations that counteract the unbalanced charges of the clay structure and can be blocked with protonated amines that are also positively charged. In this study, channel blocking was performed with HDTMA, and in this series, montmorilonite adsorbs HCN molecules only up to 33% of the organic molecule after 120 min of contact. This suggests that the remainder is adsorbed in the edges of the clay. Experiments with selectively blocked clays were performed similar to those previously explained. When the medium is acidified, all the HCN is adsorbed by the clay (100%), and HDTMA is released. In this case, the change of pH causes the output of the amine, which is displaced, leaving free the space to be occupied again by HCN molecule. The adsorption in this system is similar to the HDTMA–clay (Fig. 6). Furthermore, blocking of mineral edges with polyphosphates produces an adsorption close to 100%, substantiating that the adsorption of HCN in the montmorillonite occurs in the interlamellar channel. Although the mechanism of adsorption is not clear, it is believed to be chemisorption because the montmorillonite in contact with the HCN solution typically changes its yellowish colour to bluish-green, probably by the reaction between cyanide ion and iron (Fe3+) that results in the formation of blue complexes. It is well known that the cyano group is a very reactive nucleophile and that it can easily react with transition metals to form stable compounds.
Adsorption of HCN in blocked sodium montmorillonite. Interlamellar channel blocked (HDTMA at different pH values) and edge-blocked clay (polyphosphates).

Powder XRD
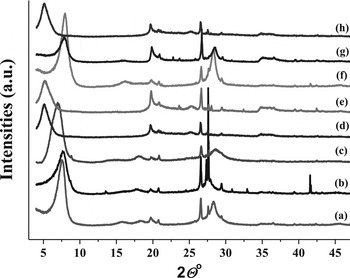
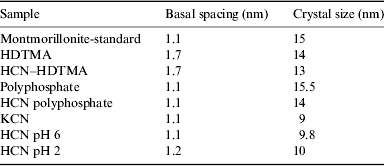
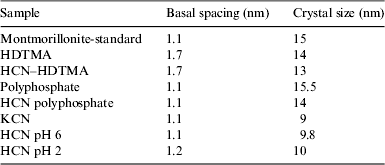
X-rays showed that the crystallite size changed throughout within the different pH values (Fig. 7 and Table 1).
X-ray diffractogram of the Na-montmorillonite with different treatments. (a) Montmorillonite, (b) montmorillonite–KCN, (c) montmorillonite–HCN, (d) montmorillonite–HDTMA–HCN, (e) montmorillonite–HDTMA, (f) montmorillonite–polyphosphates, (g) montmorillonite–polyphosphates–HCN, (h) montmorillonite–HCN–pH 2.

Sodium montmorillonite structural parameters after different treatments compared to the untreated sample

From the diffraction peaks, we observe an increase in some samples originated from the inclusion of the HCN in the crystalline structure. More specifically, the bigger sizes in the peak intensities in the samples of HCN at pH 6.0 and 2.0 confirm the adsorption onto the mineral surfaces. A more detailed exploration of the nanostructures substantiate that the modifications occur at the atomic-layer scale (Table 1) in the basal spacing. The basal spacing of the clay is defined as the distance from one layer to the corresponding parallel layer of the crystal and, thus, includes the features of the unit cell and any material present between the layers (Blanton et al. Reference Blanton, Majumdar and Melpolder1998). The basal spacing in the HDTMA-related samples is expanded up to 1.7 nm as the maximum of the spacing (Fig. 7). The change in the size of the basal spacing with no alteration of the crystallography of the Na-montmorrillonite is a clear-cut example of the dynamic environmental behaviour of this mineral, especially regarding organics. The sample containing KCN presents a Bragg peak at 27.6 of 2Θ° showing a new crystalline phase, probably from the (112) plane of the KCN. This result might suggest the potential specificity of montmorillonite for the molecular confinement of CNˉ-related molecules at specific pH values, as seen at pH 2.
Infrared spectroscopy
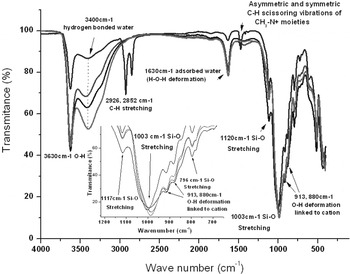
The infrared spectroscopy of the sodium montmorillonite with the different treatments may be divided into sections according to the functional groups found (Fig. 8). Table 2 lists the bands from the mineral and the organics. An intense relatively sharp band is observed at 3630 cm−1. This band is the –OH stretching from the mineral and seems unaffected by treatments but shows a decrease in size by the presence of the HTDMA. The region in the 3000–3500 cm−1 changes significantly with the treatments and corresponds to hydrogen-bonded water, more specifically, the water in contact with the cation in the montmorillonite interlayer. The next set of bands is attributed to CH-stretching modes of alkyl chains. Following the organics, we see two bands from the HDTMA at 1487 and 1473, according to Xi et al. (Reference Xi, Ding, He and Frost2005).
Infrared spectra of the treated and control samples of the montomorillonite. Main vibrational bands are reported. The expansion of the basal spacing in the sodium montmorillonite is observed.

Band assignment for montmorillonite samples

Since all the possible bands for the HDTMA are not present, it seems that significant changes in the organic matter (deformation) are produced in the sodium-montmorillonite–HDTMA interaction, which agrees with other experimental observations (Xi et al. Reference Xi, Ding, He and Frost2005). From the FTIR, we can see a shift in the 1003 cm−1 band that constitutes a consistent trend of increasing water content in the crystalline layers of the montmorillonite (Stevens et al. Reference Stevens, Anderson and Boyd1996). An additional observation of the 1003 (Si–O) band shows a shift in the wave number. At the molecular scale, the effect of the solvent might affect and cause a small downward shift of the stretching frequencies (Zecchina et al. Reference Zecchina, Bordiga, Spoto, Marchese, Petrini, Leofanti and Padovan1992). Our observations uphold the expansion up to 0.17 nm of the basal spacing in the sodium montmorillonite.
Molecular modelling
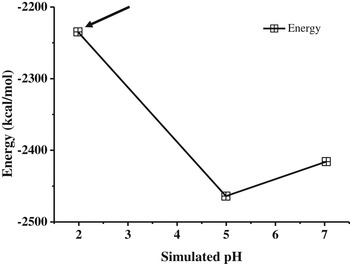
To achieve insight into the molecular behaviour of the HCN at different pH values, we performed molecular modelling. Molecular dynamics simulations were used to investigate the influence of alterations in the molecular environment at the nanoscale. Many configurations of the unit cells were obtained, and a simulation of acid activation was performed (Rimola et al. Reference Rimola, Costa, Sodupe, Lambert and Ugliengo2013). The OH− groups were randomly put in the unit cell (Fig. 3) to perform the modelling of the acid activity. The energies of lower configuration (maximum stability) are obtained and correlated against the simulated pH values and plotted (Fig. 9). A minimum-energy configuration is reached (arrow in Fig. 9).
Effect of pH in the changes of configuration. The geometry-optimization simulation shows that the most stable conformation is at pH 5, whereas the most dynamic contribution is at pH 2 (black arrow).

Through the different pH values, the geometry-optimization simulation changed to different energies, the most stable conformation being the one at pH 5 (black arrow in Fig. 9). At this pH there is a high stability of the system (low energy), whereas at pH 2 the lowest stability (highest energy value) verifies the physicochemical potential producing the expansion of the mineral. In other words, the pH 2 might act as the driving force for activation of the mineral surface.
Another observation in the different simulations is the fact that the HCN molecule points out towards the Na+ rich sites having an average distance HCN to the Na-montmorilonite of ca. 0.3 nm. In the solvent generally, the water molecules move in the direction close to the Na-montmorillonite, producing more structured water molecules, probably decreasing the temperature of the system (Martin Reference Martin1960). The HCN molecule presents a closer interaction to the hydronium ion; both lead to interaction with the Na+ in the interlamellar channels. The low stability in the pH 2 system may be due to activity of the hydronium ion or other acid species resulting in greater reactivity of the system (HCN adsorption), confirming the experimental results.
Relevance to prebiotic processes
Concentration of organics on primitive Earth should not be high (Stribling & Miller Reference Stribling and Miller1987; Miller & Cleaves Reference Miller, Cleaves, Rigoutsos and Stephanopoulos2006); molecules were probably found diluted in water bodies such as lakes, oceans or even ponds. However, organics were not isolated on those solutions; they were probably interacting with solid surfaces. In this scenario, minerals, especially clays, could have been fundamental to increase the concentration of organics because clays strongly interact with them. A likely candidate is Na montmorillonite because it is widespread in nature, and its geological formation is a common phenomenon. It can be easily formed on Earth by different mechanisms, including weathering, sedimentation and diagenesis (Harder Reference Harder, Cairns-Smith and Hartman1988). In addition, these types of smectite clays have been detected in different places in the solar system, such as Mars (Poulet et al. Reference Poulet, Bibring, Mustard, Gendrin, Mangold, Langevin, Arvidson, Gondet and Gomez2005), carbonaceous chondrites, such as the Orgueil meteorite (Bass Reference Bass1971), and comets, and all of these might have existed in primitive environments on early Earth. For those reasons, in this study, montmorillonite was chosen as mineral surface. HCN is a key molecule that has been suggested had low concentration on primitive Earth (Stribling & Miller Reference Stribling and Miller1987); for this reason a concentration mechanism has been necessary. In the results here presented, sodium montmorillonite interacts with HCN, enabling the concentration of the molecule. According to the experiments, if the physicochemical milieu changes, the percentage of adsorption – and hence local concentration of HCN – also is modified. The molecular simulations presented and analysed here revealed that thermodynamically the concentration of HCN in the interlamellar channel is favoured by clay in acid pH. These changes are not so drastic and could be reached in natural environments of primitive Earth (Russell & Hall Reference Russell and Hall1997), increasing the possibility of forming more complex molecules.
Conclusions
The role that heterogeneous environments played in the primitive Earth, when prebiotic reactions took place, should be fundamental for complex chemical synthesis. Noteworthy, the role that solids might have had in concentrating organics in early Earth and elsewhere in the solar system is substantiated here, and theoretical data are given. This paper provides experimental evidences supporting the role of clays in concentrationg simple organics. Certainly, the interaction of solids with different molecules can be studied from different approaches. In this regard, clays such as sodium montmorillonite were postulated as important for chemical evolution due to its chemical properties, its occurrence in primitive environments and wide distribution. To extend the knowledge of the role of clays in the prebiotic time, the adsorption of HCN in sodium montmorillonite was studied. The complexation of molecules to form more complex ones was a critical step, and clays could have helped this process. Although the precise mechanisms are not well understood, the direct interaction of small organics with clay surfaces, or even specific ions and exchangeable cations, might have been a source of fundamental complexation and molecular assembly. Alternatively, if clays acted as important nucleation sites, then proto-biological synthetic reactions had to proceed much more rapidly than deleterious decomposition reactions to avoid the long-term effects of hydrolysis within clays and in plain seawater.
The concentration of organics in micro environments such as mineral surfaces is of prime importance on primitive Earth for the reason that these compounds might not have been abundant. Molecules were probably found diluted in water bodies such as lakes, oceans or even ponds. In this scenario, minerals and especially clays might have been fundamental to increase the concentration of organics because clays strongly interact with them. Certainly, the interaction of solids with different molecules can be studied from various perspectives, but processes that occur when a solid interacts with complex molecules are not fully understood.
To extend the knowledge of the role of clays in the prebiotic times, we studied the adsorption of bioorganic compounds in sodium montmorillonite. The complication of molecules, progressing from simple structures towards more complex ones, was a critical step, and clays could have helped in this process. The exact adsorbtion mechanisms are not well known, but the distribution of the chemical groups might be important to understand the mineral–organic interaction. For instance, it could have taken place either through direct interaction with surface atoms or with the exchangeable cations in the interlamellar space. These mechanisms of anchoring that depend on geometry and electrostatic interactions might explain the specific selectivity of biomolecules in minerals (Hazen et al. Reference Hazen, Filley and Goodfriend2001). More in detail, the adsorption of organic compounds possibly could have been present on the primitive Earth (such as nucleic bases and their derivatives, amino acids and precursors such as HCN) and could have interacted or assembled in the complex mineral surfaces in specific structural or chemical integrant parts. In our future research, we will focus on a more detailed molecular study as a necessity to understand these possible structural and physicochemical mineral parameters, linking the primitive and simple organic compounds to the complex living systems.
Acknowledgements
This work was partially supported by a PAPIIT grant IN 10513-RR10513 and CONACYT grant no. 168579/11. The authors would express their gratitude to M. Sc. Benjamin Leal, Phys. Francisco García, Chem. Maricela Gutiérrez Franco, and Chem. Claudia Camargo for their important technical assistance. The authors acknowledge the comments of the anonymous reviewers for improving the manuscript.