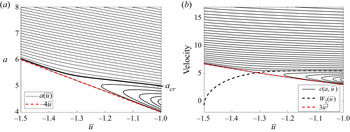
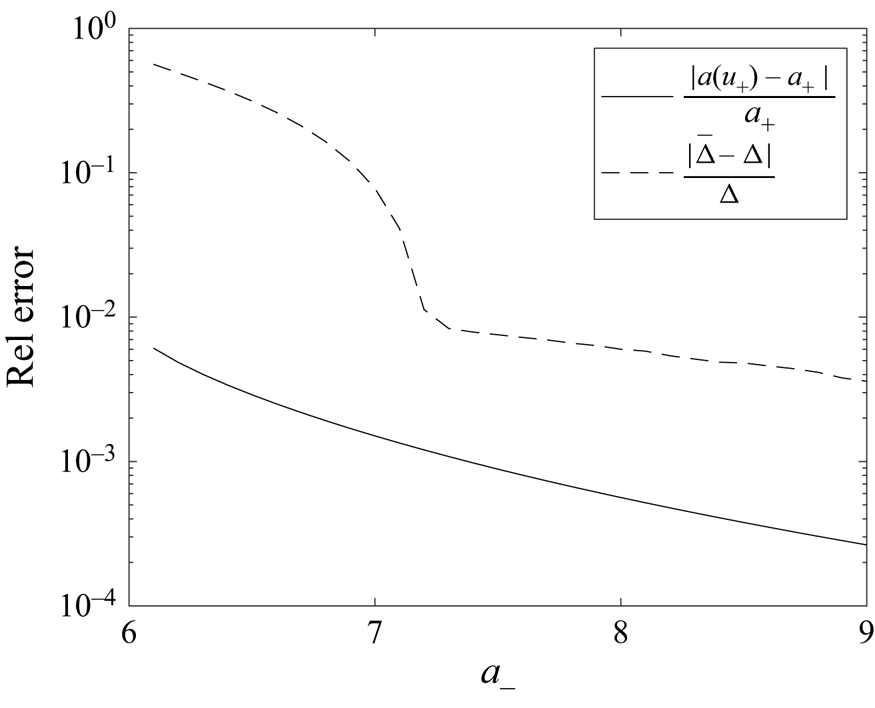
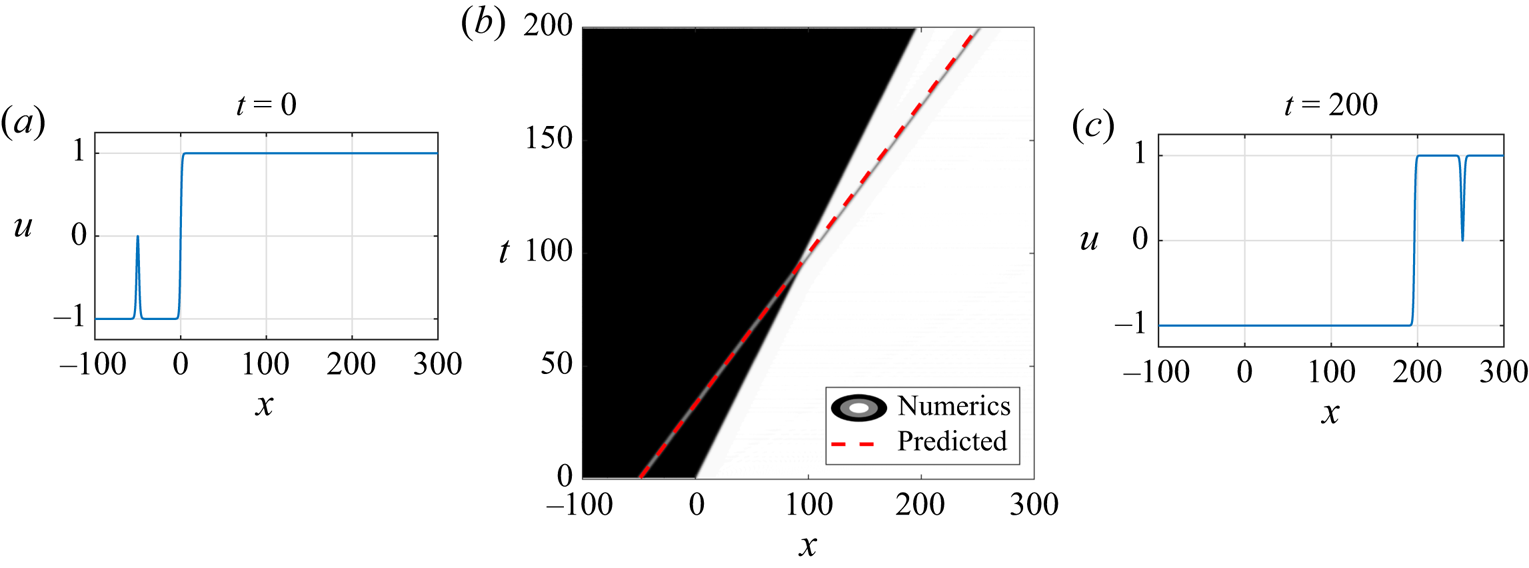
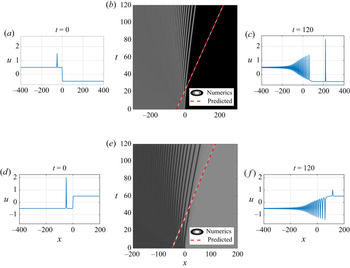
1. Introduction
The interaction of dispersive waves with slowly varying mean flows is a fundamental and canonical problem of fluid mechanics with important applications in geophysical fluid dynamics (see, e.g. Pedlosky (Reference Pedlosky2003), Mei, Stiassnie & Yue (Reference Mei, Stiassnie and Yue2005), Bühler (Reference Bühler2009) and references therein). This multiscale problem is relevant for linear or weakly nonlinear wavepackets and large amplitude solitons – in this work, we do not distinguish between solitary waves and solitons. Traditionally, the mean flow involved in the interaction is either prescribed externally, e.g. an external current, or is induced by amplitude modulations of a nonlinear wave. A different class of wave–mean flow interactions has recently been identified in Maiden et al. (Reference Maiden, Anderson, Franco, El and Hoefer2018), where both the dynamic mean flow and the propagating localised soliton are described by the same dispersive hydrodynamic equation, a canonical example being the Korteweg–de Vries (KdV) equation. However, the evolution of the field  $u(x,t)$ occurs on two well-separated spatio-temporal scales, allowing for the distinct identification of waves and mean flows. A prototypical configuration of this (figure 1) is the propagation of a soliton through a dynamically evolving macroscopic flow, characterised by different asymptotic states
 $u \to u_{\pm }$ as
 $x \to \pm \infty$. We refer to such nonlinear wave interactions as soliton–mean flow interactions. The simplest mean flows are initiated by a monotone transition or step between
 $u_-$ and
 $u_+$, which asymptotically develops into either a rarefaction wave (RW) or a highly oscillatory dispersive shock wave (DSW) (Gurevich & Pitaevskii Reference Gurevich and Pitaevskii1974; El & Hoefer Reference El and Hoefer2016). While the former is slowly varying, the use of the expression ‘mean flow’ for the latter implies some averaging over rapid oscillations. We shall refer to the step problem for dispersive hydrodynamics as a dispersive Riemann problem. Solitons, RWs and DSWs (also known as undular bores) are ubiquitous and fundamental nonlinear wave structures occurring in a variety of geophysical fluid contexts including internal waves in lakes or oceans (Boegman, Ivey & Imberger Reference Boegman, Ivey and Imberger2005; Helfrich & Melville Reference Helfrich and Melville2006; Madsen, Fuhrman & Schäffer Reference Madsen, Fuhrman and Schäffer2008; Jamshidi & Johnson Reference Jamshidi and Johnson2020) and surface water waves (Chanson Reference Chanson2010; Chassagne et al. Reference Chassagne, Filippini, Ricchiuto and Bonneton2019) as well as magma and glacier flows (Scott & Stevenson Reference Scott and Stevenson1984; Stubblefield, Spiegelman & Creyts Reference Stubblefield, Spiegelman and Creyts2020), so the problem of their interaction is of considerable interest for fluid dynamics applications. Depending upon its initial position and amplitude, the soliton may transmit or ‘tunnel’ through the large scale, expanding mean flow; otherwise, it remains trapped within the mean flow. Recent work has investigated the interaction between solitons and mean flows resulting from the evolution of an initial step. Both fluid conduit experiments and the theory for a rather general, single dispersive hydrodynamic conservation law were described in Maiden et al. (Reference Maiden, Anderson, Franco, El and Hoefer2018). A generalisation of soliton–mean flow interaction to the bidirectional case for a pair of conservation laws described by the defocusing nonlinear Schrödinger equation (NLS) equation was explored in Sprenger, Hoefer & El (Reference Sprenger, Hoefer and El2018). Soliton–mean flow interaction in the focusing NLS equation was investigated in Biondini & Lottes (Reference Biondini and Lottes2019). A similar problem involving the interaction of linear wavepackets with shallow-water wave mean flows modelled by the KdV equation was studied using an analogous modulation theory framework in Congy, El & Hoefer (Reference Congy, El and Hoefer2019). Aside from the focusing NLS case, for which mean flow evolution is described by an elliptic system of equations, and the present work, the models previously investigated in the context of soliton–mean flow interaction were limited to dispersive conservation laws with hyperbolic, convex flux.
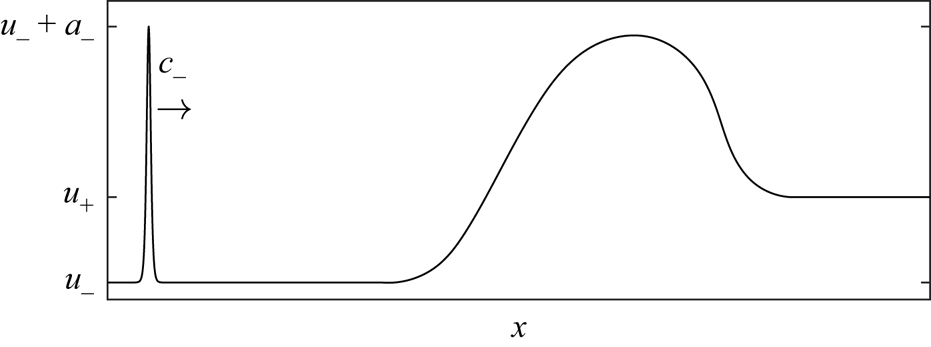
Representative initial configuration for soliton–mean flow interaction. The narrow soliton with amplitude  $a_-$ on the uniform mean flow
 $\overline {u}_-$ transmits through the broad hydrodynamic flow if it reaches the uniform mean flow
 $\overline {u}_+$, surpassing all initial mean-generated oscillations. Otherwise, it experiences trapping inside the mean flow. The mean flow generally exhibits expansion and compression waves.

The focus of this work is the study of soliton–mean flow interaction when the governing dispersive hydrodynamics exhibits a non-convex hydrodynamic flux. As we show, the presence of non-convex flux, e.g. the cubic flux in the modified KdV (mKdV) equation or related Gardner equation, introduces significant modifications to the transmission and trapping scenarios realised in the KdV case. First of all, due to the non-convex flux, the mKdV equation supports a much broader family of solitons and mean flow solutions than the KdV equation, including localised solutions in the form of exponentially decaying solitons of both polarities and, depending on the dispersion sign, kinks and algebraic solitons. The mKdV non-convex mean flow features include undercompressive DSWs (an alternative interpretation of kinks), contact DSWs (CDSWs) and compound two-wave structures (Kamchatnov et al. Reference Kamchatnov, Kuo, Lin, Horng, Gou, Clift, El and Grimshaw2012, Reference Kamchatnov, Kuo, Lin, Horng, Gou, Clift, El and Grimshaw2013; El, Hoefer & Shearer Reference El, Hoefer and Shearer2017). Here, we investigate how the solution features that arise due to non-convex flux affect soliton–mean flow interactions. In particular, we show that soliton transmission for the defocusing mKdV equation can be accompanied by a soliton polarity change. In the focusing case, there is a soliton–mean flow interaction in which an exponential soliton is asymptotically transformed into a trapped algebraic soliton. These are just two examples of the rich catalogue of soliton–mean flow interactions we describe in this paper.
Key to the study of soliton–mean flow interaction is scale separation, whereby the characteristic length and time scales of the propagating soliton are much shorter than those of the mean flow. The rapidly oscillating structure of dispersive hydrodynamic flows motivates the use of multiscale asymptotic methods. Here, we will make extensive use of one such method known as Whitham modulation theory (Whitham Reference Whitham1974), which is based on a projection of the scalar dispersive hydrodynamics onto a three-parameter family of slowly varying periodic travelling wave solutions to the governing equation. The projection is achieved, equivalently, by averaging conservation laws, an averaged variational principle, or multiple scale perturbation methods. The dispersive hydrodynamics is then approximately described by a system of three first-order quasilinear partial differential equations (PDEs) – the Whitham modulation equations – for the periodic travelling wave's parameters such as the wave amplitude, the wavenumber and the period mean. Within the framework of Whitham modulation theory, the original dispersive Riemann problem is posed as a special Riemann problem, sometimes called the Gurevich–Pitaevskii (GP) problem (Gurevich & Pitaevskii Reference Gurevich and Pitaevskii1974), for the modulation equations subject to piecewise constant initial data with a single discontinuity at the origin. Continuous, self-similar solutions of the GP problem describe RW and DSW mean flow modulations.
Classical DSW modulation theory has been developed for the KdV equation (Gurevich & Pitaevskii Reference Gurevich and Pitaevskii1974) and other ‘KdV-like’ equations, both integrable and non-integrable (El Reference El2005; El & Hoefer Reference El and Hoefer2016). It is useful to identify this class of KdV-type equations, or classical, convex dispersive hydrodynamic equations, as those equations for which the associated Whitham modulation equations are strictly hyperbolic and genuinely nonlinear. In this case, the generic solution of the GP problem is either a DSW or a RW. More broadly, even non-convex equations such as mKdV can exhibit convex dispersive hydrodynamics for a restricted subset of modulation parameters in which the Whitham modulation equations remain strictly hyperbolic and genuinely nonlinear. Therefore, we shall call the DSWs generated within the framework of convex dispersive hydrodynamics convex DSWs.
It was shown in Maiden et al. (Reference Maiden, Anderson, Franco, El and Hoefer2018) that the interaction of a soliton with a RW is described by an exact, soliton limit reduction of the Whitham modulation system, which we call the solitonic modulation system. Two integrals or adiabatic invariants of the solitonic modulation system were identified that determine the amplitude and phase shift of the soliton when transmitted through the variable mean flow. The non-existence of a transmitted soliton (zero or negative transmitted amplitude) signifies soliton trapping within the mean flow. The soliton–DSW transmission/trapping conditions were shown to be equivalent to those for the soliton–RW interaction by the fundamental property of hydrodynamic reciprocity of the modulation solution, which is related to time reversibility of the original dispersive hydrodynamics.
In this paper, we investigate the effects of a flux's non-convexity on the transmission and phase conditions. One of the main, general outcomes of our work is the identification of the condition for soliton trapping with the coalescence of characteristics of the solitonic modulation system, a signature of non-strict hyperbolicity. Analysis of the solitonic modulation system for the mKdV equation shows that, in contrast to the convex case, the characteristic coalescence and, consequently, soliton trapping can occur even for non-zero soliton amplitude. This new type of soliton trapping is accompanied by the asymptotic transformation of a conventional, exponentially decaying soliton into an algebraic soliton of the mKdV equation. Another notable effect is the dynamic reversal of soliton polarity upon its transmission through a kink mean flow, which resembles but is different from the well-known soliton polarity reversal due to KdV soliton propagation in a variable medium caused, for example, by internal wave propagation through variable fluid stratification and/or variable depth. Upon passage through a critical point where the coefficient for the quadratic flux vanishes, non-convex mKdV/Gardner dynamics emerges (Shroyer, Moum & Nash Reference Shroyer, Moum and Nash2009; Li, Wang & Grimshaw Reference Li, Wang and Grimshaw2015). Modulation theory predicts a zero – or more accurately, vanishing in the zero dispersion limit – phase shift of soliton transmission through a non-convex mean flow such as a kink or CDSW. Although all concrete calculations and numerical simulations are performed for the mKdV equation, the developed solitonic modulation system framework for the analysis of non-convex soliton–mean flow interactions is general and can be applied to other dispersive hydrodynamic equations with non-convex flux, both integrable and non-integrable.
It is important to stress the fundamental difference between the present soliton–mean interaction setting and the more traditional, well-understood fluid dynamics problem consisting of finding the nonlinear  ${O}(a^{2})$ mean flow response to
 ${O}(a)$ waves with small amplitude
 $a$ (Pedlosky Reference Pedlosky2003; Bühler Reference Bühler2009). In contrast, due to scale separation, the interaction between a soliton and a large-scale mean flow with amplitude
 ${O}(1)$ is primarily a one-way nonlinear process – the mean flow exhibits a small phase shift due to soliton interaction – that can be viewed as ‘soliton steering’ by the dynamically evolving mean flow. This distinct type of dynamic wave–mean interaction is also realised for linearised shallow-water wave packets propagating over large-scale nonlinear dispersive mean flows (Congy et al. Reference Congy, El and Hoefer2019). However, non-convexity and positive dispersion supports an inherently two-way process: the kink imparts a polarity reversal to DSWs and RWs while the mean changes the amplitude and speed of the kink.
Perhaps the most prominent application of the present work is to internal waves in lakes, the ocean or atmosphere where solitons are known to arise and may interact with large-scale mean flows such as expansion waves, undular bores, or non-oscillatory fronts/kinks (also called solibores Henyey & Hoering Reference Henyey and Hoering1997) resulting from, e.g. tidal–topographic interaction (Helfrich & Melville Reference Helfrich and Melville2006) or surges/plumes (Horn et al. Reference Horn, Imberger, Ivey and Redekopp2002; Nash & Moum Reference Nash and Moum2005) that can be modelled by the unidirectional mKdV and Gardner equations (Kakutani & Yamasaki Reference Kakutani and Yamasaki1978; Holloway, Pelinovsky & Talipova Reference Holloway, Pelinovsky and Talipova1999; Horn et al. Reference Horn, Imberger, Ivey and Redekopp2002; Helfrich & Melville Reference Helfrich and Melville2006; Apel et al. Reference Apel, Ostrovsky, Stepanyants and Lynch2007). The mKdV equation also models potential vorticity fronts in quasi-geostrophic eddies using the method of contour dynamics (Pratt & Stern Reference Pratt and Stern1986; Gruzinov Reference Gruzinov1992; Nycander, Dritschel & Sutyrin Reference Nycander, Dritschel and Sutyrin1993). A more sophisticated non-convex model describing the potential vorticity dynamics of coastal fronts was recently introduced by Jamshidi & Johnson (Reference Jamshidi and Johnson2020). Fully nonlinear, bidirectional internal waves are described by non-convex dispersive models such as the Miyata–Camassa–Choi system (Miyata Reference Miyata1985; Choi & Camassa Reference Choi and Camassa1999). Non-convex dispersive hydrodynamics modelled by the mKdV and Gardner equations also occurs in the physics of multicomponent superfluids (Ivanov et al. Reference Ivanov, Kamchatnov, Congy and Pavloff2017) and collisionless plasma (Chanteur & Raadu Reference Chanteur and Raadu1987; Ruderman, Talipova & Pelinovsky Reference Ruderman, Talipova and Pelinovsky2008).
The structure of this paper is as follows. In § 2, we introduce the notion and nomenclature of dispersive hydrodynamics, and provide a review of the effects of non-convex hydrodynamic flux on mKdV solutions. In § 3, we detail the general modulation theory framework for soliton–mean flow interaction problems, originally introduced in Maiden et al. (Reference Maiden, Anderson, Franco, El and Hoefer2018), and extend it to the case of non-convex flux. Then, in § 4, we narrow our focus to the modulation description of mKdV dispersive hydrodynamics and in § 5 to the classification of mean flows realised in the mKdV regularisation of Riemann step data. In the next § 6, we formulate the soliton–mean flow problem for mKdV and determine admissibility conditions for soliton transmission (tunnelling) through the mean flow. We then partition our classification of mKdV soliton–mean flow interaction into soliton–convex mean flow interactions (§ 7), soliton–non-convex mean flow interactions (§ 8) and the special case of kink–mean flow interactions (§ 9). Finally, we generalise our analysis from convex mean flows generated by the GP problem to a much broader class of convex mean flows generated from slowly varying initial conditions. Throughout this paper, we confirm the predictions of our asymptotic analysis using numerical experiments with a spectral integrating factor Fourier method in space and fourth-order Runge–Kutta time integration (described in appendix B of El et al. Reference El, Hoefer and Shearer2017). Discussion, conclusions and future outlooks are given in § 11 followed by two appendices with mathematical details to make the presentation self-contained.
2. Non-convex dispersive hydrodynamics
Dispersive hydrodynamics is modelled by hyperbolic conservation laws modified by dispersive terms (El & Hoefer Reference El and Hoefer2016). We express a single one-dimensional dispersive hydrodynamic conservation law in the general form
 \begin{equation} u_t + f(u)_x = D[u]_x, \end{equation}
where  $f(u) \in C^{2}(\mathbb {R})$ is the hydrodynamic (or hyperbolic) flux function. The term
 $D[u]$ is a differential or integro-differential operator acting on
 $u(x,t)$ that gives rise to a real-valued linear dispersion relation
 \begin{equation} \omega_0(k,\bar{u}) = f'(\bar{u})k + \varOmega(k,\bar{u}),\quad k \in \mathbb{R} \end{equation}
for vanishingly small amplitude travelling wave solutions  $\propto \exp ({\textrm {i}(kx-\omega _0 t)})$ of the PDE (2.1) linearised about the constant solution
 $u(x,t) = \bar {u} \in \mathbb {R}$. We assume that
 $\varOmega (k,\bar {u}) = o(k)$ as
 $k \to 0$ and
 $\varOmega _{kk}(k,\bar {u})$ is not identically zero in order to separate the long-wave hydrodynamic flux from short-wave dispersive effects. The field of dispersive hydrodynamics encompasses multiscale nonlinear wave solutions of initial and boundary value problems for (2.1) (possibly with perturbations) in which at least two length and time scales play a prominent role: the oscillatory scale (e.g. the width of a soliton or the wavelength/period of a periodic travelling wave) and a longer, hydrodynamic scale (e.g. the slowly varying oscillatory amplitude of a wavepacket or DSW). One canonical dispersive hydrodynamic problem for (2.1) is the so-called GP problem (Gurevich & Pitaevskii Reference Gurevich and Pitaevskii1974) in which
 $u(x,0)$ for
 $x \in \mathbb {R}$ exhibits a sharp, monotone transition between two distinct far-field boundary conditions. The solution of the GP problem then describes the long-time asymptotic behaviour for more general initial data with distinct far-field equilibrium states.
When  $f''(u)$ in (2.1) is sign definite, we say that the hydrodynamic flux – or just ‘flux’ for short – is convex, not distinguishing between convex and concave associated with different signs. Similarly, when
 $\varOmega _{kk}(k,\bar {u})$ in (2.2) is sign definite for
 $k > 0$, we say that the dispersion is convex. A necessary condition for (2.1) to be a classical, convex dispersive hydrodynamic equation is the convexity of both the flux and the dispersion (El & Hoefer Reference El and Hoefer2016). Consequently, when
 $f''$ or
 $\varOmega _{kk}$ are sign indefinite, the dispersive hydrodynamics is non-convex. In this paper, we focus on the non-convex flux case and assume convex dispersion throughout.
Non-convexity is known to introduce new types of dispersive hydrodynamic solutions. The simplest generic model of dispersive hydrodynamics with non-convex flux is the mKdV equation
 \begin{equation} u_t + (u^{3})_x = \mu u_{xxx} . \end{equation}
The mKdV equation with  $\mu > 0$ is often referred to as defocusing and with
 $\mu <0$ as focusing. The review (El et al. Reference El, Hoefer and Shearer2017) presents a full classification of mKdV solutions to the GP problem associated with the Riemann initial data
 \begin{equation} u(x,0) =\begin{cases}
u_- & x < 0 \\[2pt] u_+ & x > 0 \end{cases}
\end{equation}
for both signs of  $\mu$. Due to its cubic flux, the mKdV Riemann problem exhibits non-classical solutions that were first studied in Chanteur & Raadu (Reference Chanteur and Raadu1987), Kamchatnov, Spire & Konotop (Reference Kamchatnov, Spire and Konotop2004), Marchant (Reference Marchant2008), Leach (Reference Leach2012) and Leach (Reference Leach2013). The full classification was carried out in Kamchatnov et al. (Reference Kamchatnov, Kuo, Lin, Horng, Gou, Clift, El and Grimshaw2012) and Kamchatnov et al. (Reference Kamchatnov, Kuo, Lin, Horng, Gou, Clift, El and Grimshaw2013) within the framework of the Gardner equation that combines the quadratic and cubic fluxes of the KdV and mKdV equations, respectively. The classification is presented in § 5; see figure 3.
The properties of the mKdV equation for  $\mu >0$ and
 $\mu <0$ are very different with respect to the evolution of Riemann data (2.4). In addition to convex DSWs and RWs exhibited by both mKdV incarnations, there are new types of non-classical, non-convex solutions that do not exist for convex dispersive hydrodynamic equations and depend on the sign of
 $\mu$. These features occur for initial steps satisfying
 $u_- u_+<0$, i.e. when the initial data include the inflection point
 $u = 0$ of the cubic flux
 $f(u) = u^{3}$. The case
 $\mu > 0$ is particularly relevant for stratified fluids where monotonic, heteroclinic travelling wave solutions, commonly known as kinks or solibores, were identified in Kluwick, Scheichl & Cox (Reference Kluwick, Scheichl and Cox2007) as undercompressive DSWs analogous to discontinuous, undercompressive shock wave solutions in conservation law theory that do not satisfy the Lax entropy condition (LeFloch Reference LeFloch2002). The solutions of the mKdV Riemann problem involving kinks were analysed in Chanteur & Raadu (Reference Chanteur and Raadu1987) using the inverse scattering transform and in Leach (Reference Leach2012) using matched asymptotic expansions.
When  $\mu < 0$, a family of CDSWs exist whose modulation solution coincides with a non-strictly hyperbolic double characteristic of the Whitham modulation system. The CDSWs are analogous to contact discontinuities in conservation law theory that propagate with characteristic velocity (Dafermos Reference Dafermos2016). The CDSWs were first described in Marchant (Reference Marchant2008) as sinusoidal undular bores, then later as trigonometric bores which were studied in Leach (Reference Leach2013) using matched asymptotic expansions.
While convex DSWs are a continuous, two-parameter family of solutions to the GP problem depending on both  $(u_-,u_+)$, undercompressive and contact DSWs are a continuous, one-parameter family of solutions. For mKdV (2.3), the undercompressive and CDSWs exhibit the additional restriction
 $u_+ = -u_-$. As a result, undercompressive and CDSWs resulting from the GP problem are typically accompanied by a convex RW or DSW in the form of a double wave structure. Representative numerical simulations for each type of solution to the mKdV GP problem are shown in figure 3. In the context of soliton interaction with dispersive hydrodynamic structures, we shall refer to solutions of the GP problem generally as mean flows. The DSW modulations in this context are further specified as DSW mean flows.
3. Modulation theory for soliton–mean interaction
We now review the general approach to the mathematical study of soliton–mean interaction via Whitham modulation theory (Whitham Reference Whitham1974). This approach, termed solitonic dispersive hydrodynamics, was introduced in Maiden et al. (Reference Maiden, Anderson, Franco, El and Hoefer2018). We shall first follow the general description introduced in Maiden et al. (Reference Maiden, Anderson, Franco, El and Hoefer2018) for convex systems and then consider the implications of a non-convex flux, not explored previously.
3.1. Solitonic modulation system
The analytical description of solitonic dispersive hydrodynamics is based on considering the soliton reduction of the Whitham modulation equations. Having the mKdV equation in mind, we present the general theory for the unidirectional, scalar case.
For a periodic travelling wave solution parametrised by three independent constants (as in the case of KdV or mKdV equations, third-order PDEs), the modulation equations can be written in terms of the physical wave parameters: the mean flow  $\bar {u}$, the amplitude
 $a$ and the wavenumber
 $k$. Allowing
 $\bar {u}$,
 $a$,
 $k$ to be slow functions of
 $x,t$, the requirement for the modulated periodic wave to be an asymptotic solution to the dispersive hydrodynamic equation (2.1) results in the quasilinear modulation system,
 \begin{equation} \boldsymbol{u}_t + \mathrm{A} (\boldsymbol{u}) \boldsymbol{u}_x =0, \end{equation}
where  $\boldsymbol {u}= ( \bar {u}, a, k)^\textrm {T}$ and
 $\mathrm {A}( \boldsymbol {u})$ is a
 $3 \times 3$ modulation matrix. We call the dispersive hydrodynamics convex if the associated Whitham modulation system (3.1) is strictly hyperbolic and genuinely nonlinear. If at least one of these conditions is violated, the system is non-convex. Strict hyperbolicity requires that the eigenvalues
 $v_i (\boldsymbol {u}),\ i=1,2,3$ of the matrix
 $\mathrm {A}( \boldsymbol {u})$ are real and distinct,
 $v_1 < v_2 < v_3$, for all
 ${\boldsymbol{u}}$ in the admissible set
 \begin{equation} \boldsymbol{u} \in\mathcal{A} = \left\{ (\bar{u},a,k)^\textrm{T} \,|\, \bar{u} \in \mathbb{R},\ a > 0,\ k > 0\right\}. \end{equation}
The genuine nonlinearity condition then reads  $\boldsymbol {\nabla }_{\boldsymbol {u}} v_i \boldsymbol {\cdot } \boldsymbol {r}_i \ne 0,\ i=1,2,3$ for all
 $\boldsymbol {u} \in \mathcal {A}$, where
 $\boldsymbol {r}_i(\boldsymbol {u})$ is the right eigenvector corresponding to the eigenvalue
 $v_i$ (Lax Reference Lax1973). If the system is non-strictly hyperbolic (the eigenvectors
 $\boldsymbol {r}_i$ span
 $\mathbb {R}^{3}$ but multiple eigenvalues are admissible), then it is not genuinely nonlinear either (Dafermos Reference Dafermos2016). The converse is generally not true. Nevertheless, a non-convex system can exhibit convex properties in a restricted domain
 $\mathcal {D} \subset \mathcal {A}$.
The KdV–Whitham modulation system (3.1) is strictly hyperbolic and genuinely nonlinear for all admissible  $\boldsymbol {u} \in \mathcal {A}$ (Levermore Reference Levermore1988), while for the mKdV equation, the properties of strict hyperbolicity and genuine nonlinearity depend on the sign of
 $\mu$ and on
 $\boldsymbol {u}$ (El et al. Reference El, Hoefer and Shearer2017).
An important ingredient for modulation theory is the equation for  $k$ in (3.1)
 \begin{equation} k_t+ [\omega(\bar{u}, k, a)]_x=0, \end{equation}
known as the conservation of waves, where  $\omega (\bar {u}, k, a)$ is the travelling wave frequency.
Soliton–mean interaction theory is based on the fundamental property of Whitham modulation systems that we postulate here in a general form and later explicitly justify for mKdV: in the  $k \to 0$ soliton limit, the modulation system (3.1) admits the following exact reduction (Gurevich, Krylov & El Reference Gurevich, Krylov and El1990):
 \begin{equation} \begin{bmatrix} \bar{u}\\ a \end{bmatrix}_t+ \begin{bmatrix} f'(\bar{u}) & 0 \\ g(a,\bar{u}) & c(a,\bar{u}) \end{bmatrix} \begin{bmatrix} \bar{u}\\ a \end{bmatrix}_x = \begin{bmatrix} 0 \\ 0 \end{bmatrix}, \end{equation}
where  $c(a,\bar {u})= \lim _{k \to 0} (\omega /k)$ is the soliton amplitude–speed relation for propagation on the background
 $\bar {u}$ and
 $g(a,\bar {u})$ is a coupling function that is system dependent. Equation (3.4) is called the solitonic modulation system.
The third modulation equation (3.3) is identically satisfied for  $k=0$ while for
 $0 < k \ll 1$, it assumes at leading order the form
 \begin{equation} k_t + [c(a,\bar{u})k]_x = 0. \end{equation}
Equation (3.5) can be added to the solitonic modulation system (3.4) to give an approximate modulation system for a train of non-interacting solitons propagating on a variable mean flow. Equation (3.5) then signifies the conservation of the number of solitons in the train. We shall refer to the combined system (3.4) and (3.5) as the augmented solitonic modulation system. Note that a particular case of this system was derived in Grimshaw (Reference Grimshaw1979) for slowly varying soliton solutions of the variable coefficient KdV equation.
The soliton train interpretation of the modulation system (3.4) is instrumental for a solitonic dispersive hydrodynamics as it enables the description of a single modulated soliton by treating the soliton amplitude  $a(x,t)$ as a spatio-temporal field, in contrast to standard soliton perturbation theory where the soliton's parameters evolve temporally along its trajectory in the
 $x,t$-plane; see, e.g. Kivshar & Malomed (Reference Kivshar and Malomed1989). Additionally, as we will show, the introduction of the fictitious wavenumber field
 $k(x,t)$ for a single soliton enables the determination of the soliton phase shift due to interaction with the mean flow.
The characteristic velocities of the system (3.4) are  $f'(\bar {u})$ and
 $c(a,\bar {u})$. The right eigenvectors
 $\boldsymbol {r}_{1,2}$ of the Jacobian matrix in (3.4) for each characteristic velocity are
 $$\begin{gather} v_1 = f'(\bar{u}),\quad \boldsymbol{r}_1 = \begin{bmatrix} f'- c \\ g \end{bmatrix}, \end{gather}$$
 $$\begin{gather}v_2 = c(a,\bar{u}),\quad \boldsymbol{r}_2 = \begin{bmatrix} 0 \\ 1 \end{bmatrix}. \end{gather}$$
Thus, the system (3.4) is strictly hyperbolic if  $f' \ne c$ for all
 $(\bar {u},a)\in \mathcal {A}_0$, where
 \begin{equation} \mathcal{A}_0 = \mathbb{R} \times (0,\infty) \end{equation}
is the set of admissible states. The system (3.4) is genuinely nonlinear in the  $j$th characteristic field if
 $\boldsymbol {\nabla } v_j \boldsymbol {\cdot } \boldsymbol {r}_j \ne 0$ for all
 $(\bar {u},a)\in \mathcal {A}_0$. For the first characteristic field,
 \begin{equation} \boldsymbol{\nabla} f'(\bar{u}) \boldsymbol{\cdot} \boldsymbol{r}_1 \ne 0 \implies f''(\bar{u})(f'(\bar{u})-c(a,\bar{u})) \ne 0, \end{equation}
which holds, provided the characteristic velocities are distinct (strict hyperbolicity) and the flux  $f$ of the original scalar evolution equation (2.1) is convex. Thus, when two characteristic velocities merge (non-strict hyperbolicity), the corresponding characteristic field is not genuinely nonlinear.
The genuine nonlinearity of the second characteristic field requires
 \begin{equation} \boldsymbol{\nabla} c(a,\bar{u}) \boldsymbol{\cdot} \boldsymbol{r}_2 \ne 0 \implies c_{a}(a,\bar{u}) \ne 0. \end{equation}
To summarise, the quasi-linear system (3.4) is strictly hyperbolic when  $f'(\bar {u}) \neq c(a,\bar {u})$ and is genuinely nonlinear when additionally
 $f''(\bar {u})\neq 0$ and
 $c_a(a,\bar {u})\neq 0$ for all
 $(\bar {u},a) \in \mathbb {R} \times (0,\infty )$. Negation of any of these three conditions gives rise to a non-convex solitonic dispersive hydrodynamics.
Since the exact soliton reduction (3.4) is a  $2\times 2$ quasi-linear hyperbolic system, it can be reduced to Riemann invariant form. We refer to the mean flow
 $\bar {u}$ as the ‘hydrodynamic’ Riemann invariant and the other is found by integrating the differential form
 $g\,\mathrm {d}\bar {u} + (c - f')\,\mathrm {d}a$ provided
 $c \ne f'$ (Whitham Reference Whitham1974). Denoting the second, solitonic Riemann invariant as
 $q = q(a,\bar {u})$, the diagonalised system can be written as
 \begin{equation} \begin{bmatrix} \bar{u}\\ q \end{bmatrix}_t+ \begin{bmatrix} f'(\bar{u}) & 0 \\ 0 & C(q,\bar{u}) \end{bmatrix} \begin{bmatrix} \bar{u}\\ q \end{bmatrix}_x = \begin{bmatrix} 0 \\ 0 \end{bmatrix}, \end{equation}
where  $C (q(a,\bar {u}),\bar {u} ) \equiv c(a,\bar {u})$. In terms of the diagonal system (3.11), the condition of strict hyperbolicity reads
 $f'(\bar {u}) \ne C(q,\bar {u})$ and the conditions of genuine nonlinearity of the first and second characteristic fields are written respectively as
 \begin{equation} f''(\bar{u}) \ne 0, \quad \hbox{and} \quad C_q \ne 0. \end{equation}
It is important to stress that the existence of the solitonic Riemann invariant  $q$ is not reliant on the diagonalisability of the full quasi-linear system (3.1) in Riemann invariants. In fact, as was shown in El (Reference El2005), this Riemann invariant can be obtained directly, as the integral
 $q=Q(\tilde k, \bar {u}) = const$ on
 $\mathrm {d}\kern0.06em x/\mathrm {d}t=C$, of the following characteristic ordinary differential equation (ODE)
 \begin{equation} \frac{\mathrm{d} \tilde k}{{\textrm{d}} \bar{u}} = \frac{\partial _{\bar{u}} \tilde \omega_0}{f'(\bar{u}) - \partial_{\tilde k} \tilde \omega_0}, \end{equation}
where  $\tilde k$ and
 $\tilde \omega _0$ are called the conjugate wavenumber and conjugate frequency, respectively. They are defined in terms of the soliton amplitude–speed relation
 $c(a, \bar {u})$ and the linear dispersion relation (2.2)
 $\omega _0(k, \bar {u})$ by
 \begin{equation} \tilde \omega_0 (\tilde k, \bar{u}) ={-}\textrm{i}\omega_0 (\textrm{i} \tilde k, \bar{u} );\quad c(a, \bar{u}) = \frac{\tilde \omega_0}{\tilde k}. \end{equation}
We note that the Riemann invariant  $q=Q(\tilde k, \bar {u})$ is not defined uniquely, as any smooth function of a Riemann invariant is also a Riemann invariant. In the case of convex systems, a convenient normalisation is suggested by the requirement to maintain strict hyperbolicity of the solitonic system in the limit of vanishing amplitude where the long-wave speed
 $f'(\bar {u})$ and soliton speed
 $c(a, \bar {u})$ must coincide. The variable
 $\tilde k$ can be identified as an amplitude-type variable (El Reference El2005), so that
 $\tilde k =0 \Longleftrightarrow a =0$, and requires that the hydrodynamic and solitonic Riemann invariants coincide when
 $\tilde k \to 0$, i.e.
 $Q(0, \bar {u})=\bar {u}$. As a result, the system (3.11) reduces to a single hyperbolic equation
 $\bar {u}_t + f'(\bar {u})\bar {u}_x=0$. The situation is different for non-convex systems, where two or more distinct Riemann invariants associated with the same characteristic speed may exist. For example, for cubic flux
 $f(\bar {u})=\bar {u}^{3}$, the mean flow equation
 $\bar {u}_t +3 \bar {u}^{2} \bar {u}_x=0$ is invariant with respect to the transformation
 $\bar {u} \to - \bar {u}$ so another possible normalisation is
 $Q(0, \bar {u})=-\bar {u}$. To avoid ambiguity, we will be using the normalisation
 \begin{equation} Q(0, \bar{u})=\bar{u}, \end{equation}
for the initial configuration. For the case of a general non-convex flux, we assumed, without loss of generality, that it satisfies  $f''(0)=0$. Then, if the solution curve crosses
 $\bar {u}=0$, the normalisation of the Riemann invariant should be changed to
 $Q(0, \bar {u})=-\bar {u}$ across this point to maintain smoothness of
 $Q$.
The two Riemann invariants  $\bar {u}$ and
 $q$ for the
 $2\times 2$ system (3.11) are also Riemann invariants for the
 $3 \times 3$ augmented solitonic modulation system (3.11) and (3.5). But the latter quasi-linear system is not hyperbolic because its corresponding Jacobian matrix is deficient, with just two eigenvalues and two linearly independent eigenvectors. Nevertheless, it has another hyperbolic subsystem, in addition to (3.11), which is obtained by setting
 $q \equiv q_0$ constant, as will be the case for the soliton–mean flow interaction problems we consider. Then the remaining simple wave equation
 $\bar u_t + f(\bar u)_x=0$, together with the approximate equation (3.5), where we replace
 $c(a, \bar u)$ with
 $C(q_0, \bar u)$, form a hyperbolic subsystem. Equation (3.5) is diagonalised by the quantity
 $kp(q_0,\bar {u})$, where
 \begin{equation} p(q_0,\bar{u}) = \exp\left(-\int_{\bar{u}_0}^{\bar{u}} \frac{C_u(q_0,u)}{f'(u)-C(q_0,u)}\mathrm{d}u\right),\quad \bar{u}_0\in \mathbb{R}. \end{equation}
In other words, if  $q=q_0$ is constant, we can use
 \begin{equation} (kp)_t + C(q_0,\bar{u})(kp)_x = 0 \end{equation}
instead of (3.5). The quantities  $q$ and
 $kp$ have been identified in Maiden et al. (Reference Maiden, Anderson, Franco, El and Hoefer2018) as adiabatic invariants of soliton–mean flow interaction.
3.2. Soliton–mean interaction
Solutions to the solitonic modulation system can now be sought subject to an initial mean flow  $\bar {u}(x,0)=\bar {u}_0(x)$ and an initial soliton with amplitude
 $a_0$ located at
 $x=x_0$. However, we need an initial amplitude and wavenumber field
 $a(x,0)$,
 $k(x,0)$ defined for all
 $x$. This is obtained by invoking the soliton train description and asserting that the required solution of the augmented solitonic system (3.4), (3.5) is a simple wave (to be justified), meaning all but one Riemann invariant are constant. The non-constant Riemann invariant is
 $\bar {u}$, in order to satisfy the initial condition. Then
 $a(x,0)$ is selected to maintain constant
 $q$
 \begin{equation} q (a(x,0),\bar{u}_0(x)) = q_0 \equiv q (a_0,\bar{u}_0(x_0)) . \end{equation}
Since  $q$ constant is a solution, this reduces the augmented solitonic modulation system to the hyperbolic subsystem consisting of two diagonalised equations for
 $\bar u$ and
 $kp(q_0, \bar u)$. In order to define the initial wavenumber field
 $k(x,0)$, we set the latter Riemann invariant to also be constant
 \begin{equation} k(x,0) = k_0 \frac{p_0}{p (q_0,\bar{u}_0(x))}, \end{equation}
where  $p_0 \equiv p ( q_0 , \bar {u}_0(x_0) )$ and
 $k_0 \equiv k(x_0,0) \ll 1$ is a small, positive quantity whose particular value is not important for our consideration since we assume the limit
 $k_0 \to 0$ in the soliton number conservation equation (3.5), and, therefore in (3.17).
The soliton–mean interaction problem can now be formulated and solved. Given the initial mean flow profile  $\bar {u}(x,0) = \bar {u}_0(x)$, the soliton amplitude
 $a_0$ and location
 $x_0$,
 $\bar {u}(x,t)$ is the simple wave solution
 \begin{equation} x - f'(\bar{u}) t = H(\bar{u}), \quad H = u_0^{{-}1} \end{equation}
and the soliton amplitude and wavenumber fields satisfy
 \begin{equation} q(a,\bar{u}) = q_0, \quad k = k_0 \frac{p_0}{p(q_0,\bar{u})} . \end{equation}
We will focus our analysis on a generalised GP problem, in which initial conditions for the mean flow are given as in the original Riemann problem (2.4)
 \begin{equation} \bar{u}(x,0) = \left\{
\begin{array}{@{}ll} u_-, & x<0, \\[2pt] u_+, & x> 0,
\end{array}\right.\end{equation}
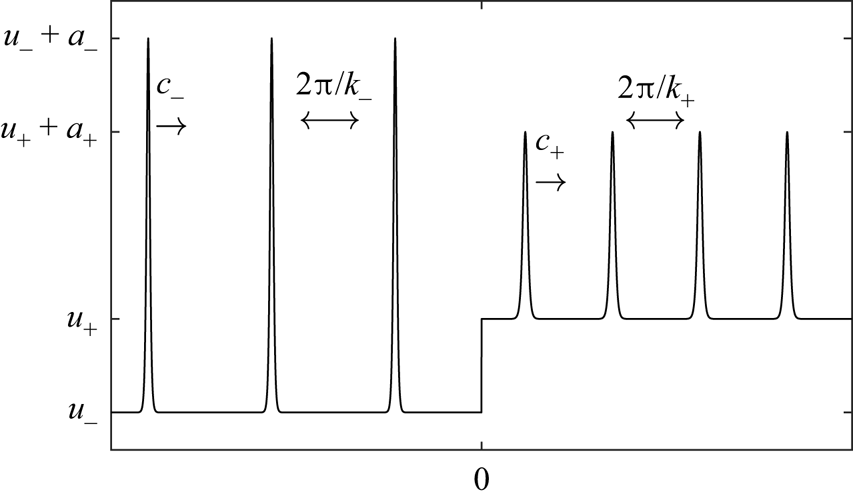
and the amplitude and wavenumber fields exhibit step variations
 \begin{equation} a(x,0) = \begin{cases} a_- & x < 0 \\[2pt] a_+ & x > 0 \end{cases},\quad k(x,0) = \begin{cases} k_- & x < 0 \\[2pt] k_+ & x > 0. \end{cases} \end{equation}
A sketch illustrating the generalised GP problem is shown in figure 2.
Sketch of the generalised GP problem.

Depending on the initial location  $x_0$ of the soliton relative to the mean flow discontinuity at
 $x=0$, either the left
 $(a_-, k_-)$ or right
 $(a_+, k_+)$ part of the initial wave field
 $a(x,0), k(x,0)$ is prescribed with the other part to be determined as described below.
Due to the scaling invariance of both the quasilinear solitonic modulation system (3.4), (3.5) and the step initial data (3.22), (3.23a,b), the soliton–mean interaction problem is solved by a simple wave solution of the Riemann problem, thus justifying the constant Riemann invariant assumption for  $q$ and
 $kp$ expressed by (3.18), (3.19). Therefore, the amplitude and wavenumber fields in the soliton–mean flow interaction must satisfy (3.21a,b), yielding the relations between admissible values of
 $a_{\pm }$ and
 $k_{\pm }$ in (3.23a,b). These are formulated as transmission and phase conditions
 $$\begin{gather} q(a_-,u_-) = q(a_+,u_+), \end{gather}$$
 $$\begin{gather}k_- p(q_0,u_-)= k_+ p(q_0,u_+), \end{gather}$$
where  $p(q, \bar {u})$ is defined by (3.16). It is important to stress that the existence of the simple wave solution leading to the conditions in (3.24) and (3.25) requires convexity (genuine nonlinearity) of the characteristic field (3.6a,b) along the integral curve so that the conditions (3.9) are not violated.
In the context of a single soliton interacting with a varying mean flow connecting two equilibrium states  $\bar {u}=u_-$ and
 $\bar {u}=u_+$, the conditions (3.24) and (3.25) should be interpreted as follows. The initial discontinuity (3.22) initiates the varying mean flow that is generally confined to the bounded, expanding region
 $s_-t < x < s_+ t$. There is an exception to this for the undercompressive DSW mean flow, which is a non-expanding travelling wave and requires a separate treatment. Then two basic scenarios of soliton–mean interaction can be realised that we describe by assuming positive polarity of the propagating soliton. The generalisation to negative polarity (dark) solitons is straightforward.
(i) Forward (left to right) transmission/trapping.
Assuming that the soliton with amplitude  $a_->0$ is initially placed at
 $x_0=x_-<0$ on the left, background mean flow state
 $\bar {u}=u_-$, then if the soliton velocity satisfies
 $c(a_-, u_-)> s_-$, soliton–mean flow interaction occurs for times
 $t>t_1=|x_-/(c(a_-, u_-)-s_-)|$. As a result, the soliton either (a) gets transmitted (tunnels) through the variable mean flow and emerges on the right state
 $\bar {u} = u_+$ with the new amplitude
 $a_+>0$ determined by the condition (3.24) or (b) gets trapped within the variable mean flow. Trapping occurs if the transmitted soliton amplitude defined by (3.24) is negative or zero,
 $a_+ \le 0$.
For this case of forward transmission, the trajectory of the soliton post interaction is given by  $x = c(a_+, u_+) t + x_+$, where generally
 $x_+ \ne x_-$. This implies that soliton–mean flow transmission is accompanied by both an amplitude change and a soliton phase shift
 $\varDelta =x_+-x_-$, which can be determined from the condition (3.25). To relate the
 $x$-intercepts
 $x_\pm$ of the soliton characteristic pre- and post-mean flow interaction we note that the conservation of the number of solitons in the fictitious modulated train of non-interacting solitons implies
 \begin{equation} k_- x_-\,{=}\, k_+ x_+ . \end{equation}
Given  $x_-$, only the ratio of
 $k_+/k_-$ is needed to determine
 $x_+$, so, by virtue of the linear relationship between
 $k_+$ and
 $k_-$, the particular value of
 $k_-$ in (3.21a,b) is irrelevant. The soliton phase shift
 $\varDelta = x_+ - x_-$ due to interaction with the mean flow is then given by
 \begin{equation} \frac{\varDelta}{x_-} = \left (\frac{k_-}{k_+} -1 \right ) = \left(\frac{p_+}{p_-} -1 \right ), \end{equation}
where we have used the shorthand notation  $p_{\pm } \equiv p(q_0,u_\pm )$.
(ii) Backward (right to left) transmission/trapping.
If the soliton with amplitude  $a_+$ is initially placed at
 $x_0=x_+>0$ on the right background
 $\bar {u}=u_+$ and
 $c(a_+, u_+) < s_+$, then soliton–mean flow interaction occurs for times
 $t > t_{2}=x_+/(s_+-c(a_+, u_+))$. If the soliton eventually emerges from mean flow interaction onto the opposite constant background
 $\bar {u}=u_-$, its amplitude
 $a_->0$ and phase shift
 $\varDelta = x_- - x_+ = x_+(p_-/p_+ -1)$ are determined by the same transmission and phase conditions (3.24), (3.25). Otherwise, if the transmitted amplitude
 $a_- \le 0$, the soliton remains trapped within the mean flow.
The generalisation to negative (dark) soliton interaction with mean flow is straightforward. For this, it is convenient to introduce a signed amplitude  $a$, which enables the representation of both bright
 $a > 0$ and dark
 $a < 0$ solitons. Assuming negative initial amplitude
 $a_\pm <0$, forward/backward transmission requires that the transmitted amplitude
 $a_\mp$ maintains the same, negative, sign. Generally, the condition
 $a_+a_->0$ is the sufficient condition for transmission in both bright and dark soliton cases. Its negation implies trapping.
In all cases of forward/backward transmission/trapping, the soliton trajectory for  $t>0$ is given by the characteristic,
 \begin{equation} \frac{\mathrm{d}\kern0.06em x}{\mathrm{d}t} = c(a(x,t),\bar{u}(x,t)),\quad x(0) = x_0, \end{equation}
where  $|x_0| \gg 1$ so that the soliton is initially well separated from the initial step in the mean flow at
 $x=0$.
In the present work, we consider the implications of a non-convex solitonic modulation system (3.4) on the above soliton transmission and trapping scenarios. As described in § 3.1, non-convexity enters when strict hyperbolicity and/or genuine nonlinearity is lost via one of the three conditions:  $f''(\bar {u})=0$,
 $f'(\bar {u})=c(a, \bar {u})$ or
 $c_a(a, \bar {u})=0$ for any
 $(\bar {u},a) \in \mathcal {A}_0$.
In Maiden et al. (Reference Maiden, Anderson, Franco, El and Hoefer2018), positivity of the transmitted amplitude (one of  $a_\pm$) was proposed as a necessary and sufficient condition for bright soliton tunnelling to occur through a mean flow for convex dispersive hydrodynamics. In fact, this condition coincides with a less restrictive definition of strict hyperbolicity for (3.4) where
 $a = 0$ is included in the set of admissible states
 $\mathcal {A}_0' = \mathbb {R}\times [0,\infty )$. Generally, the soliton speed coincides with the long-wave speed when its amplitude vanishes,
 $c(0,\bar {u}) = f'(\bar {u})$, which signifies the onset of soliton trapping. Within the context of Whitham modulation theory, states in which
 $a = 0$ or
 $k = 0$ are not considered admissible when assessing strict hyperbolicity and genuine nonlinearity of the modulation equations because they coincide with a degeneracy in which the number of modulation equations is reduced; see, e.g. Levermore (Reference Levermore1988) and Bikbaev (Reference Bikbaev1989). We will utilise the traditional definition in which
 $a = 0$ is not included in the set of admissible states (3.8).
In the more general non-convex case, we find that in order for the soliton to tunnel through the mean flow, we must require the additional condition that the modulation system (3.4) remain strictly hyperbolic along the entire soliton trajectory for all admissible states  $(\bar {u},a) \in \mathcal {A}_0$. If the characteristic speeds
 $f'(\bar {u})$ and
 $c(a,\bar {u})$ coincide for non-zero
 $a$, then strict hyperbolicity is lost and the soliton is trapped inside the mean flow. If the speeds remain separated, the soliton amplitude on the transmitted side is non-zero and the phase shift is well defined according to (3.25). In summary, the necessary and sufficient conditions for tunnelling in a non-convex solitonic modulation system (3.11) with initial data (3.22), (3.23a,b) are
 \begin{equation} q(a_-,u_-) = q(a_+,u_+),\quad a_+a_-{>} 0,\quad f'(\bar{u}(x,t)) \ne c(a(x,t),\bar{u}(x,t)), \end{equation}
where  $x = x(t)$ is the characteristic (3.28a,b) and
 $t \ge 0$.
3.3. Hydrodynamic reciprocity
So far, we have assumed that the mean flow satisfies the simple wave equation  $\bar {u}_t + f'(\bar {u})\bar {u}_x = 0$. For step initial data (3.22), the only candidate continuous solution is a RW
 \begin{equation} \bar{u}(x,t) =\begin{cases} u_- & x < f'(u_-)t, \\ (f')^{{-}1}(x/t) & f'(u_-) t < x < f'(u_+) t, \\ u_+ & f'(u_+) t < x, \end{cases} \end{equation}
so long as the admissibility criterion  $f'(u_-) < f'(u_+)$ holds, corresponding to expansive initial data. As will be shown in the next section, there is a much richer variety of dispersive mean flows generated by the mKdV GP problem when the initial data are compressive. Thus, we need soliton–mean flow modulation theory to be flexible enough to accommodate a wide class of mean flows.
The solitonic modulation equations (3.4), (3.5) directly apply for expansive mean flow initial data, yielding a description of soliton–RW interaction. For compressive initial data (3.22), rather than form a discontinuous shock solution, a DSW is formed that occupies the space–time region  $A \subset \mathbb {R} \times (0,\infty )$ where the solution is described by the full system of Whitham modulation equations for a slowly varying nonlinear periodic wave. As a result, the Riemann invariant
 $q$ and secondary invariant
 $kp$ of the augmented solitonic system (3.4), (3.5) are not conserved in
 $A$, and our arguments leading to the transmission and phase conditions (3.24), (3.25) do not apply to the soliton interaction with the DSW mean flow.
To address this, we invoke an important property of the dispersive conservation law (2.1): time reversibility. A consequence of time reversibility is the continuity of the modulation solution for all  $(x,t) \in \mathbb {R}^{2}$. For compressive data, we consider the solution for
 $t < 0$ that consists of a simple wave described by (3.30), i.e. the expansive mean flow case. Then, since
 $q$ and
 $kp$ are constant for all
 $x \in \mathbb {R}$ and
 $t < 0$, they remain constant by continuity for
 $(x,t)$ in the complement of
 $A$, outside of the oscillatory region, where the augmented solitonic system (3.4), (3.5) remains valid. Note that for the Riemann data (3.22), (3.23a,b), the solution remains continuous outside
 $\mathbb {R}^{2} \setminus \{(0,0)\}$, which is justified by taking the limit of smooth solutions. This property was called hydrodynamic reciprocity in Maiden et al. (Reference Maiden, Anderson, Franco, El and Hoefer2018) and has been used previously in the characterisation of DSWs for a single or pair of dispersive hydrodynamic conservation laws (El Reference El2005). Since the transmission and phase conditions (3.24), (3.25) hold outside the oscillatory region, hydrodynamic reciprocity allows us to predict the transmitted amplitude and phase shift
 $\varDelta$ of a soliton interacting with DSW mean flows entirely within the framework of the augmented solitonic modulation system (3.4), (3.5).
The details of the modulation dynamics for the soliton within the interior of the oscillatory region  $A$ can, in principle, be described by a degenerate two-phase solution (see Flaschka, Forest & McLaughlin (Reference Flaschka, Forest and McLaughlin1980) for multiphase modulation theory of the KdV equation). However, as we will show, this rather technical approach can be partially, approximately circumvented by replacing
 $f(\bar {u})$ in the characteristic equation (3.13) by an appropriate choice of the mean flow variation and effectively defining a new adiabatic invariant
 $q$ holding within
 $A$.
4. Modulation theory for the mKdV equation
As the simplest example of dispersive hydrodynamics with non-convex flux, we study the mKdV equation (2.3). The mean flow behaviours that arise when solving (2.3) subject to (3.22) depend on the sign of the dispersive term  $\text {sgn}(\mu )$. The mKdV hyperbolic flux
 $f(u)=u^{3}$ exhibits the inflection point
 $f''(0) = 0$ so that non-convexity affects the solutions whenever the initial data contain an open interval including the point
 $u=0$. For either sign of
 $\mu$, the mKdV equation allows for solitons of both polarities by the symmetry
 $u \to -u$. The linear dispersion relation is
 \begin{equation} \omega_0 = 3\bar{u}^{2}k + \mu k^{3} . \end{equation}
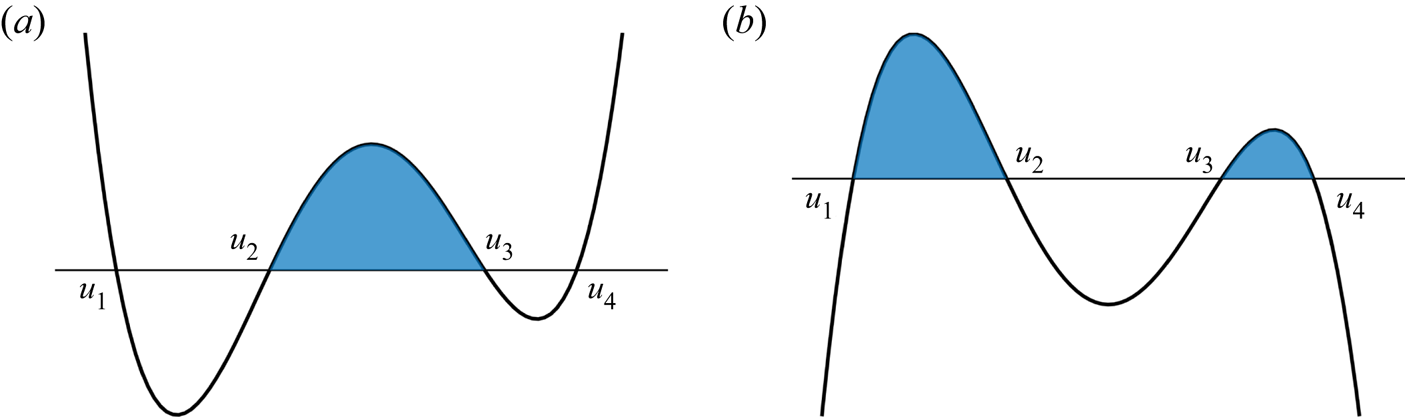
The purpose of this section is twofold: (i) to obtain the augmented solitonic modulation system (3.4), (3.5) by direct computation for the mKdV–Whitham system and (ii) to explore the implications of the mKdV's non-convex flux for the structure of the augmented solitonic modulation system. But first, we need to understand mKdV's travelling wave solutions. In order to be self-contained, Appendix A presents a compendium of the results on mKdV travelling wave solutions from El et al. (Reference El, Hoefer and Shearer2017) necessary for the development in this paper, which we briefly summarise. The mKdV equation differs from the KdV equation in that it supports solitons of both polarities for either sign of the dispersion  $\mu$. For
 $\mu >0$, bright soliton solutions occur when
 $u_1 \to u_2$ and dark soliton solutions occur when
 $u_3 \to u_4$. For
 $\mu < 0$, solitons arise when
 $u_2 \to u_3$ with bright solitons as solutions between
 $u_3$ and
 $u_4$ while dark solitons occur between
 $u_1$ and
 $u_2$. The amplitude–speed relations (A6) and (A8) for bright and dark exponential solitons, respectively, can be combined into a single relation by introducing the convention that
 $a>0$ for bright solitons and
 $a<0$ for dark solitons. Then, the general formula
 \begin{equation} c(a,\bar{u}) = \tfrac{1}{2}a^{2} + 2a\bar{u}+ 3\bar{u}^{2},\quad a \in \mathbb{R} \end{equation}
holds, covering all cases:  $\mu \lessgtr 0$, dark and bright exponential solitons. Note that this formula also includes kinks (
 $a= - 2\bar {u}, c= \bar {u}^{2}, \mu > 0$) and algebraic solitons (
 $a=-4\bar {u}, c= 3 \bar {u}^{2}, \mu < 0$). From now on, we will be assuming the generalised amplitude
 $a \in \mathbb {R}$.
The system of modulation equations for the mKdV equation (2.3) was first derived in Driscoll & O'Neil (Reference Driscoll and O'Neil1975) following Whitham's original averaging procedure (Whitham Reference Whitham1965), and reduced to diagonal form.
A derivation of the travelling wave solutions and the respective modulation equations for the Gardner equation (an extended version of mKdV), revealing the differences between various modulationally stable DSW structures arising in the  $\mu >0$ and
 $\mu < 0$ cases was performed in Kamchatnov et al. (Reference Kamchatnov, Kuo, Lin, Horng, Gou, Clift, El and Grimshaw2012) and then utilised in El et al. (Reference El, Hoefer and Shearer2017) for the analysis of modulated mKdV solutions in the zero-viscosity limit of the mKdV–Burgers equation. Following El et al. (Reference El, Hoefer and Shearer2017), the mKdV modulation system is
 \begin{equation} \frac{\partial \lambda_i}{\partial t} + W_i(\boldsymbol{\lambda}) \frac{\partial \lambda_i}{\partial x} = 0,\quad i = 1,2,3, \end{equation}
where  $\lambda _i$ are Riemann invariants related to roots of the potential function
 $Q(\bar {u})$,
 \begin{equation} \lambda_1 = \tfrac{1}{2}(u_1+u_2),\quad \lambda_2 = \tfrac{1}{2}(u_1+u_3),\quad \lambda_3=\tfrac{1}{2}(u_2+u_3). \end{equation}
The characteristic velocities  $W_i$ are given in Appendix B.
Applying the limit  $\lambda_2 \to \lambda_3$ to (4.3) and using (B5), (B6) gives the reduced diagonal system
 \begin{equation} \left.\begin{gathered} \frac{\partial \lambda_1}{\partial t} + 3\lambda_1^{2} \frac{\partial \lambda_1}{\partial x} = 0, \\ \frac{\partial \lambda_3}{\partial t} + (\lambda_1^{2}+2\lambda_3^{2}) \frac{\partial \lambda_3}{\partial x} = 0. \end{gathered}\right\} \end{equation}
Using  $\bar {u} = u_1 = \lambda _1$ and
 $a = u_3 - u_1=2 (\lambda _3 - \lambda _1)$ (see (A5)), we can now write (4.5) as
 \begin{equation} \left.\begin{gathered} \bar{u}_t + 3\bar{u}^{2} \bar{u}_x = 0, \\ a_t + \big(\tfrac{1}{2}a^{2} + 2a\bar{u} + 3\bar{u}^{2}\big)a_x + (a^{2} + 4a\bar{u})\bar{u}_x =0. \end{gathered}\right\} \end{equation}
The system (4.6) represents the mKdV realisation of the general solitonic modulation system (3.4) with the hyperbolic flux  $f(\bar {u})=\bar {u}^{3}$, the soliton amplitude–speed relation (4.2) and the coupling function
 $g(a, \bar {u}) = a^{2} + 4a\bar {u}$. Comparing the diagonal form (4.5) of the mKdV solitonic modulation system with the general representation (3.11), we identify the Riemann invariant
 $\lambda _1$ in (4.5) with
 $\bar {u}$ and
 $\lambda _3$ with
 $q=\frac {1}{2}a+\bar {u}$, and the characteristic velocity
 $W_3(\lambda _1, \lambda _3, \lambda _3)= \lambda _1^{2}+2\lambda _3^{2}$ with
 $C(q, \bar {u})=\bar {u}^{2} + 2q^{2}$.
The dark soliton limit is achieved when  $u_3 \to u_4$, which translates to
 $\lambda _2 \to -\lambda _3$, so, due to the quadratic dependence (B3) of
 $\boldsymbol {r}$ on
 $\boldsymbol \lambda$, we arrive at the same system (4.5) for
 $\lambda _1, \lambda _3$ and, equivalently, the system (4.6) for
 $\bar {u}=-\lambda _1$ and
 $q=\lambda _3 =\bar {u}+\frac 12 a$,
 $C(q, \bar {u})=\bar {u}^{2} + 2q^{2}$, where we used the extended notion of the signed amplitude,
 $a=u_2-u_3=2(\lambda _1 - \lambda _2)<0$.
The derivation for  $\mu <0$ is analogous and also results in the solitonic modulation system (4.6) for both bright and dark soliton cases with the identification of the merged Riemann invariant
 $\lambda _1=\lambda _2=\bar {u} + \frac 12 a=q$.
As described in § 3, the Riemann invariant  $q(a,\bar {u})$ can be obtained directly, bypassing the derivation of the full mKdV modulation system and the evaluation of its soliton limit. This is achieved by integrating the characteristic ODE (3.13) with the mKdV conjugate dispersion relation (3.14) given by
 $\tilde \omega _0 = 3\tilde k \bar {u}^{2} - \mu \tilde k^{3}$. The ODE then assumes the form
 $\mathrm {d}\tilde k/ \mathrm {d}\bar {u} = 2 \bar {u}/ (\mu \tilde k)$. Its integral
 $Q(\tilde k, \bar {u})=const$ is found as
 $Q= \pm \sqrt {\bar {u}^{2} - \mu \tilde k^{2}/2}$. The conjugate wavenumber
 $\tilde k$ is related to the soliton amplitude
 $a$ via equation
 $c(a, \bar {u})=\tilde \omega _0/\tilde k$ (3.14), where
 $c(a, \bar {u})$ is given by (4.2). This yields
 $\mu \tilde k^{2} =-\frac 12 a^{2} - 2 a \bar {u}$. Substituting in the expression for
 $Q$ and applying the normalisation (3.15) yields the Riemann invariant
 \begin{equation} q=\bar{u} + \tfrac 12 a, \end{equation}
in full agreement with the previous identification of the Riemann invariant of the solitonic modulation system (4.6).
Thus, for both signs of  $\mu$ and for both bright and dark solitons, the diagonalised mKdV solitonic modulation system assumes the form
 \begin{equation} \left.\begin{gathered} \bar{u}_t + 3\bar{u}^{2}\bar{u}_x = 0, \\ q_t + (\bar{u}^{2} + 2q^{2})q_x = 0. \end{gathered}\right\} \end{equation}
The system (4.8) is augmented by the approximate equation (3.5) for conservation of waves (solitons), which assumes the form
 \begin{equation} k_t + ((\bar{u}^{2} + 2q^{2})k)_x = 0. \end{equation}
Equation (4.9) can also be derived from the full modulation system (4.3) by considering the pair  $k$,
 $U$ given by (A4), (A2) expressed in terms of
 $\lambda _1, \lambda _2, \lambda _3$ for
 $\mu > 0$ as
 \begin{equation} k=\frac{{\rm \pi} \sqrt{\lambda_1^{2} -\lambda_3^{2}}}{4 K(m) \sqrt{2|\mu|}},\quad m=\frac{\lambda_1^{2} - \lambda_2 ^{2}}{\lambda_1^{2} - \lambda_3^{2}},\quad U=\lambda_1^{2} + \lambda_2^{2} + \lambda_3^{2}. \end{equation}
Expanding (4.10a–c) for  $\lambda _2 \to \lambda _3$, evaluating
 $k_t+(kU)_x=0$ at leading order and using (4.3) we obtain (4.9) with
 $q^{2}=\lambda _1^{2}$ for
 $\mu >0$. A similar analysis for
 $\mu < 0$ yields the same result with
 $q^{2}=\lambda _3^{2}$. The approximate conservation of waves equation (4.9) is subject to corrections of order
 $k\,\textrm {e}^{-\alpha k}$ where
 $\alpha = {\rm \pi}\sqrt {2(\lambda _1^{2}-\lambda _3^{2})} = {\rm \pi}\sqrt {-a(a+4\bar {u})/2}$ as
 $k\to 0$.
The solitonic modulation system (4.8) loses strict hyperbolicity when  $3 \bar {u}^{2}=\bar {u}^{2} + 2q^{2}$ – corresponding to
 $f'(\bar {u}) = c(a,\bar {u})$ in the notation of (3.4) – which yields
 $q^{2} = \bar {u}^{2}$, and implying via (4.7) either
 \begin{equation} a = 0, \quad \text{or} \quad a ={-}4\bar{u}. \end{equation}
As mentioned earlier, the  $a = 0$ case corresponds to a reduction in order of the solitonic modulation system (4.8) to the mean flow equation
 $\bar {u}_t + 3\bar {u}^{2} \bar {u}_x = 0$. Strictly speaking, it does not correspond to the loss of strict hyperbolicity as traditionally defined for Whitham modulation systems, but it is relevant for the general tunnelling conditions (3.29a–c).
Genuine nonlinearity is lost when (4.11) holds or, alternatively, if  $f''(\bar {u}) = 0$, or
 $c_a = 0$, cf (3.9), (3.10), i.e.
 \begin{equation} \bar{u} = 0 \quad \text{or}\quad a ={-}2\bar{u} \quad \Leftrightarrow\quad q = 0. \end{equation}
In all cases, the soliton speed in terms of the Riemann invariants is given by
 \begin{equation} C(q,\bar{u}) = \bar{u}^{2} + 2q^{2} > 0,\quad \text{for } a \neq 0. \end{equation}
As shown in § 3, for modulations with constant  $q$, the wave conservation equation (4.9) is diagonalised by the variable
 $kp$, where
 $p(q, \bar {u})$ is given by (3.16). Using (4.13) and
 $f'(u) = 3u^{2}$ in (3.16), we determine
 $p(q,\bar {u})$ for mKdV solitonic modulations,
 \begin{align} p(q,\bar{u}) &= \exp\left(-\int_{\bar{u}_0}^{\bar{u}}\frac{u}{u^{2}-q^{2}}{\textrm{d}}u\right) \nonumber\\ &= |q^{2} - \bar{u}^{2}|^{{-}1/2}, \quad q^{2} \neq \bar{u}^{2}, \end{align}
where we have chosen  $\bar {u}_0^{2} = q^{2} + 1$ for convenience.
5. Classification of mean flows in the mKdV GP problem
The solution to the GP problem for mKdV was classified in El et al. (Reference El, Hoefer and Shearer2017) by combining previous work on the Riemann problem for either sign of dispersion (Chanteur & Raadu Reference Chanteur and Raadu1987; Marchant Reference Marchant2008) and elaborating on the GP problem classification for the Gardner equation  $u_t + 6uu_x - 6\alpha u^{2}u_x + u_{xxx} = 0$ (Kamchatnov et al. Reference Kamchatnov, Kuo, Lin, Horng, Gou, Clift, El and Grimshaw2012). The wave behaviour that emerges from the GP problem depends on the sign of
 $\mu$ and relative sign and magnitude of
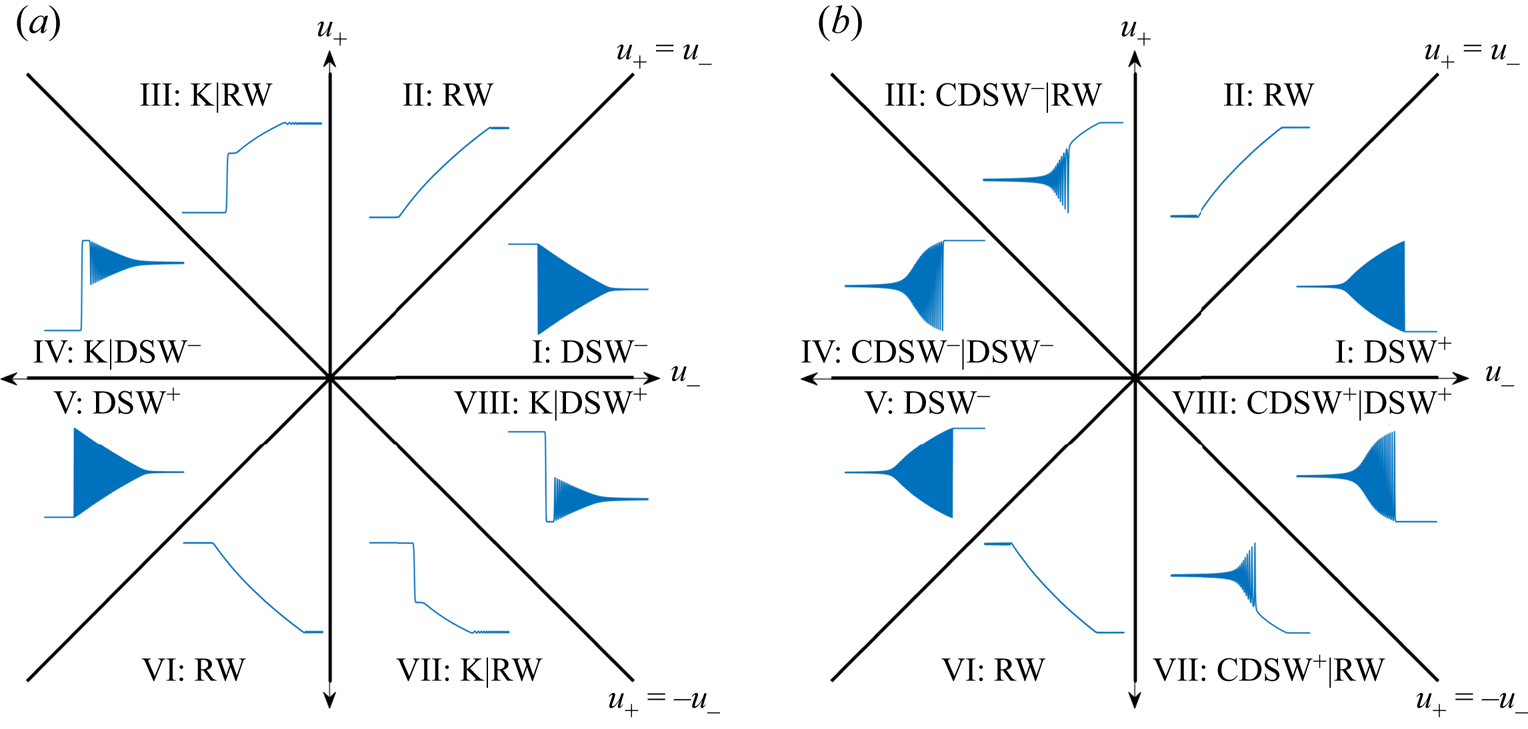
 $u_-$ and
 $u_+$, as shown in the classification diagram of figure 3. We refer to the octants in this figure as regions I to VIII, counted in a counterclockwise fashion. Owing to its universality as a model of weakly nonlinear, long dispersive waves (El et al. Reference El, Hoefer and Shearer2017), the mKdV equation provides a fundamental description of the GP problem for other PDEs with non-convex flux.
Classification of the mKdV GP problem in terms of the initial values  $u_\pm$ with representative numerical solutions, see Kamchatnov et al. (Reference Kamchatnov, Kuo, Lin, Horng, Gou, Clift, El and Grimshaw2012), El et al. (Reference El, Hoefer and Shearer2017). Legend: (RW) rarefaction wave, (DSW
 $^{+/-}$) bright/dark dispersive shock wave, (K) kink, (CDSW
 $^{+/-}$) bright/dark contact DSW; (a)
 $\mu > 0$ and (b)
 $\mu < 0$.

RWs and DSWs solve the GP problem in certain convex and non-convex cases. DSWs are classified as DSW $^{+}$ and DSW
 $^{-}$ according to the polarity of the solitary wave generated at one of the edges – leading or trailing, depending on the DSW orientation. In the non-convex case, we see the emergence of additional wave structures. These occur when the hydrodynamic flux
 $f(u) = u^{3}$ exhibits an inflection point
 $u=0$ within the range of step data (2.4) so that
 $u_+ u_-<0$. Particularly, when
 $\mu > 0$, and
 $u_- = -u_+$, the long-time asymptotic solution is a kink, which is an undercompressive shock in the limit
 $\mu \to 0^{+}$. When
 $\mu < 0$ and
 $u_- = -u_+$, the long-time asymptotic solution is a CDSW whose leading, algebraic soliton edge is a dispersionless characteristic with velocity
 $3\bar {u}^{2}$ as
 $\mu \to 0^{-}$. For other configurations with steps that pass through 0, the solution develops into a hybrid double wave structure as seen in figure 3. We stress that in the DSW case, the mean flow is interpreted as the local period average of the DSW's oscillations.
We now present explicit expressions for the basic mean flows occurring in the mKdV Riemann problem, distinguishing between convex and non-convex solutions. For brevity, we shall call them convex and non-convex mean flows, respectively.
5.1. Convex mean flows
RW mean flows (regions II and VI)
RWs that emerge from the Riemann problems in regions II and VI of figure 3 are described to leading order by
 \begin{equation} \bar{u}(x,t) =
\left\{\begin{array}{@{}ll} u_-, & x<3u_-^{2} t \\ [2pt]
\text{sgn}(u_+{-}u_-) \sqrt{\dfrac{x}{3t}}, & 3u_-^{2}t < x
< 3u_+^{2}t\\[2pt] u_+, & x>3u_+^{2} t.
\end{array}\right. \end{equation}
This is the long-time approximation of the full mKdV solution that includes dispersive regularisation of weak discontinuities at  $x = 3 u_\pm ^{2} t$.
DSW mean flows (regions I and V)
The GP modulation solution describing a DSW depends on the sign of the dispersion coefficient.
According to El et al. (Reference El, Hoefer and Shearer2017) for  $\mu >0$ a DSW
 $^{+}$ is realised as the solution to the Riemann problem with
 $u_- < u_+ < 0$, see quadrant V in figure 3(a). The relevant GP solution to the mKdV modulation equations (4.3) is a centred simple wave given by
 \begin{equation} \lambda_1 = u_-,\quad \lambda_3 = u_+,\quad W_2(u_-,\lambda_2,u_+) = \frac{x}{t}, \end{equation}
where the characteristic speed  $W_2$ is given by (B2), (B3) so
 \begin{equation} \left.\begin{gathered} W_2(u_-,\lambda_2,u_+) = u_-^{2} + u_+^{2} + \lambda_2^{2} + 2(u_-^{2}-\lambda_2^{2})\frac{(1-m)K(m)}{E(m) - (1-m)K(m)},\\ m=\frac{\lambda_2^{2} - u_-^{2} }{u_+^{2} -u_-^{2}} . \end{gathered}\right\} \end{equation}
To obtain the mean flow  $\bar {u}$ through a DSW, we average the mKdV periodic solution for
 $u$ over a period. Integrating (A3) over the period
 $2K(m)$ and writing the solution in terms of the Riemann invariants gives
 \begin{equation} \bar{u} ={-}(\lambda_1+\lambda_2+\lambda_3)+ 2\frac{(\lambda_2+\lambda_3)}{K(m)}\varPi \left(\frac{\lambda_1 - \lambda_2}{\lambda_1+\lambda_3},m\right), \end{equation}
where  $\varPi$ is the complete elliptic integral of the third kind. The dependence
 $\bar {u}(x,t)$ is obtained by inserting the modulation solution (5.2a–c), (5.3a,b) in (5.4).
For  $\mu <0$, a similar averaging over a period of (A11) gives
 \begin{equation} \bar{u} = \lambda_1 + \lambda_2 - \lambda_3 - 2\frac{(\lambda_1+\lambda_2)}{K(m)}\varPi \left(\frac{\lambda_2+\lambda_3} {\lambda_3-\lambda_1},m \right). \end{equation}
For a DSW $^{+}$ with
 $u_->u_+>0$ (quadrant I in figure 3b), the GP solution to the modulation equations is
 \begin{equation} \lambda_1 ={-}u_-, \quad \lambda_3 = u_+, \quad W_2({-}u_-,\lambda_2,u_+) = \frac{x}{t}, \end{equation}
where the characteristic speed is given by (B1), (B3) is
 \begin{equation} W_2 = u_-^{2} + u_+^{2} + \lambda_2^{2} + 2(u_+^{2} - \lambda_2^{2})\frac{(1-m)K(m)}{E(m) - (1-m)K(m)}. \end{equation}
Either (5.3a,b) or (5.7) gives a parameterisation of the DSW mean flow in terms of  $\lambda _2 \in (u_-,u_+)$, yielding
 $W_2(\bar {u})$. This behaviour is not affected by the sign of the dispersion coefficient
 $\mu$.
For solutions between the roots  $u_1$ and
 $u_2$, the DSW
 $^{-}$ mean flow can be found by applying the transformation (A16).
For application to soliton–DSW mean flow interaction, it is instructive to write down the evolution equation for the DSW mean flow  $\bar {u}(x,t)$, the simple wave equation
 \begin{equation} \bar{u}_t + W_2(\bar{u}) \bar{u}_x=0. \end{equation}
As a matter of fact,  $\bar {u}(x,t)$ given by (5.4), (5.2a–c) (or (5.5), (5.6a–c)) satisfies (5.8). The advantage of using the PDE (5.8), instead of the explicitly prescribed mean flow
 $\bar {u}(x,t)$ will become clear later, in § 7, where we shall use it instead of the original mean flow equation
 $\bar {u}_t + f'(\bar {u})\bar {u}_x=0$ as part of the solitonic modulation system (3.11).
5.2. Non-convex mean flows
As we have mentioned, non-convex mean flows are generated if the Riemann data (2.4) satisfy  $u_-u_+<0$. In contrast to two-parameter convex mean flows, non-convex mean flows are constrained, one-parameter families of mKdV solutions and, because of this, generally occur in combination with a convex mean flow – either a RW or DSW, see regions III, IV, VII, VIII in figure 3. The two classes of ‘pure’ non-convex mKdV mean flows are kinks described by kinks satisfying (A10) for
 $\mu >0$ and CDSWs when
 $\mu <0$ described by modulated trigonometric solutions (A14) that exhibit an algebraic soliton (A15) at one of its edges.
Kink mean flows ( $\mu >0$,
 $u_+=-u_-$).
Unlike other mean flows that solve the mKdV GP problem, kinks are localised, steady transitions between antisymmetric means  $\bar {u}(-\infty )=u_-$ and
 $\bar {u}(+\infty )=u_+=-u_-$ described by (A10). It has been shown in Leach (Reference Leach2012) that kinks dominate the long-time asymptotic solution of defocusing mKdV Riemann problems with antisymmetric data. Kinks are special in the sense that, in addition to considering them as mean flows, we can also treat them as localised soliton solutions that interact with convex mean flows such as RWs and DSWs.
In the limit  $\mu \to 0^{+}$, kinks are the weak discontinuous solutions
 \begin{equation} \bar{u}(x,t) =
\left\{\begin{array}{@{}ll} u_-, & x < u_-^{2}t, \\[2pt] -u_-, & x>
u_-^{2} t, \end{array}\right.\end{equation}
of the hydrodynamic modulation equation  $\bar {u}_t + (\bar {u}^{3})_x=0$ for the solitonic modulation system. The weak solution (5.9) represents an undercompressive shock (Hayes & Shearer Reference Hayes and Shearer1999; LeFloch Reference LeFloch2002) since the hydrodynamic characteristic velocity
 $c=3u_-^{2}=3u_+^{2}$ is the same on both sides of the shock.
CDSW mean flows ( $\mu <0$,
 $u_+ = - u_-$)
A CDSW is a modulated trigonometric solution (A14) connecting antisymmetric states  $u_-$ and
 $-u_+$, the negative dispersion counterpart of the kink solution. The CDSW mean flow is given by (5.5) with
 $\lambda _2=\lambda _3$ for CDSW
 $^{+}$ and
 $\lambda _3=-\lambda _2$ for CDSW
 $^{-}$.
For CDSW $^{+}$, realised when
 $u_->0$, we have
 \begin{equation} \bar{u}= \lambda_1 + 2 \sqrt{\lambda_1^{2} - \lambda_3^{2}}, \end{equation}
where the modulations of  $\lambda _1$ and
 $\lambda _3$ are given by (El et al. Reference El, Hoefer and Shearer2017)
 \begin{equation} \lambda_1 ={-}u_-,\quad W_2=W_3={-}3u_-^{2} + 6 \lambda_3^{2} =\frac{x}{t}. \end{equation}
As earlier, the mean flow variations satisfy (5.8).
6. The mKdV soliton–mean flow interaction: transmission and phase conditions
In order to obtain solutions to the soliton–mean interaction problem, we seek simple wave solutions to the augmented solitonic modulation system (4.8), (4.9) in which  $q$ and
 $kp(q,\bar {u})$ are constant while the remaining Riemann invariant, the mean flow
 $\bar {u}$, varies.
The ordering of the roots  $u_i$ leads to constraints on the background and amplitudes of the initial solitons. To simplify our analysis, we will consider initial bright solitons in the tunnelling problem. The solution for dark solitons can be obtained using the fact that the mKdV equation is invariant under the transformation (A16). For
 $\mu >0$, the initial bright soliton must satisfy (A7):
 $\bar {u} < 0$ and
 $0 < a < -2\bar {u}$. For
 $\mu < 0$, an initial bright soliton must satisfy (A13):
 $\bar {u} \in \mathbb {R}$ and
 $a > - 4\bar {u}$.
For both signs of  $\mu$, the transmission and phase conditions can be determined from (3.24), (3.25), (4.7), (4.14) as
 \begin{equation} \frac{a_+}{2} +u_+{=} \frac{a_-}{2} + u_-,\quad \frac{k_-}{k_+} = \sqrt{\frac{q_-^{2} - u_-^{2}}{q_+^{2} - u_+^{2}}} = \sqrt{\frac{\tfrac{1}{4}a_-^{2} + a_-u_-}{\tfrac{1}{4}a_+^{2}+a_+u_+}}. \end{equation}
Notably, these transmission and phase conditions are exactly the same as those for the KdV equation  $u_t + (u^{2})_x = \mu u_{xxx}$ with convex flux (Maiden et al. Reference Maiden, Anderson, Franco, El and Hoefer2018). Although, for mKdV, the conditions apply for both positive and negative soliton amplitudes.
The tunnelling condition (3.29a–c) fails when the characteristic speeds  $f'(\bar {u})$ and
 $C(q,\bar {u})$ cross, which occurs when (see (4.11))
 \begin{equation} q^{2} = \bar{u}^{2} \implies a \in \{0, -4\bar{u}\}. \end{equation}
Crossing through  $a = 0$ gives the same condition as in the convex case, where for bright solitons,
 $a > 0$ on the transmitted side implies tunnelling, and
 $a \leq 0$ means the soliton is trapped. For dark solitons, the inequalities must be reversed.
The additional tunnelling condition resulting from non-convexity when  $\bar {u} < 0$ is the constraint (A13) that the amplitude does not pass through
 $-4\bar {u}$. When
 $a \to -4\bar {u}$, we again have trapping, but with a non-zero amplitude and speed
 $3\bar {u}^{2}$. This limit corresponds to an algebraic soliton. When
 $\mu >0$, the initial amplitude will be less than
 $-4u_\pm$ since (A7) holds for valid bright solitons, and so the transmitted amplitude must also be smaller than
 $-4u_\mp$. For
 $\mu <0$, initial amplitudes must satisfy (A13), so the transmitted amplitude must also be greater than
 $-4u_\mp$.
Considering the intersection of the characteristic speeds is the most direct way to verify the admissibility criteria (3.29a–c) for the soliton to tunnel through the mean flow. However, we can also see how the phase and transmission conditions (6.1a,b) are affected. The phase shift  $\varDelta$ can be obtained from the relation (3.27), yielding for mKdV
 \begin{equation} \frac{\varDelta}{x_-}= \sqrt{\tfrac{\tfrac{1}{4}a_-^{2} + a_-u_-}{\tfrac{1}{4}a_+^{2}+a_+u_+}} -1 \end{equation}
for the forward (left to right) soliton transmission through a mean flow. If  $a_+ = -2u_+$ as when strict hyperbolicity is lost, then from (6.1a,b) we have
 ${k_-}/{k_+} \to \infty$. For the backward (right to left) transmission one simply interchanges ‘
 $+$’ and ‘
 $-$’ in (6.3).
7. Soliton–convex mean flow interaction
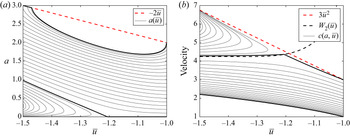
First, we consider the tunnelling problem in the classical case of convex mean flows: RWs and DSWs. However, non-convexity of the mKdV equation makes the problem novel in the sense that both bright and dark solitons exist. We see that the additional admissibility criterion of strict hyperbolicity leads to more restrictive tunnelling conditions than in the convex case. When trapping occurs in situations with soliton amplitudes  $a>0$, we find that an exponentially decaying soliton limits to an algebraic soliton when
 $a \to -4\bar {u}>0$.
7.1. Soliton tunnelling through RWs: regions II and VI
RWs that emerge from the GP problems in regions II and VI of figure 3 are described to leading order by (5.1). The RW is confined to the interval  $3u_-^{2} t < x < 3u_+^{2} t$.
To determine the admissible directionality for soliton–mean interaction, an admissible soliton's velocity must be compared with the edge velocity of the RW. For  $\mu > 0$, it is only possible for solitons to travel from right to left, implying backward soliton–mean interaction while for
 $\mu < 0$, solitons can only go from left to right. Soliton tunnelling occurs in either case if the system maintains strict hyperbolicity and
 $a \ne 0$. The tunnelling parameters are determined by the transmission conditions (6.1a,b).
For  $\mu > 0$, we focus on RWs in region VI of figure 3 because bright solitons are admissible. The case of region II with dark soliton-RW interaction can be obtained by the transformation (A16). Initialising
 $x_0 = x_+$,
 $u_+ < 0$,
 $0 < a(x_+,0) = a_+ < -2u_+$, we only need to check that
 $0 < a_- < -4u_-$ for
 $u_+ < u_- < 0$ to prove that the characteristic speeds did not cross because the RW transitions continuously and monotonically from
 $u_-$ to
 $u_+$. We use the transmission condition (6.1a,b) to express this inequality in terms of the initial soliton amplitude
 $a_+$ for a bright soliton starting on the right,
 \begin{equation} 2(u_-{-}u_+) < a_+{<} -2(u_+{+} u_-). \end{equation}
The second inequality is automatically satisfied by any valid initial soliton. Hence, the first is a sufficient condition for tunnelling,
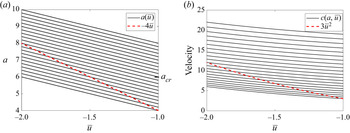
 \begin{equation} a_+{>} a_{cr} = 2(u_-{-} u_+). \end{equation}
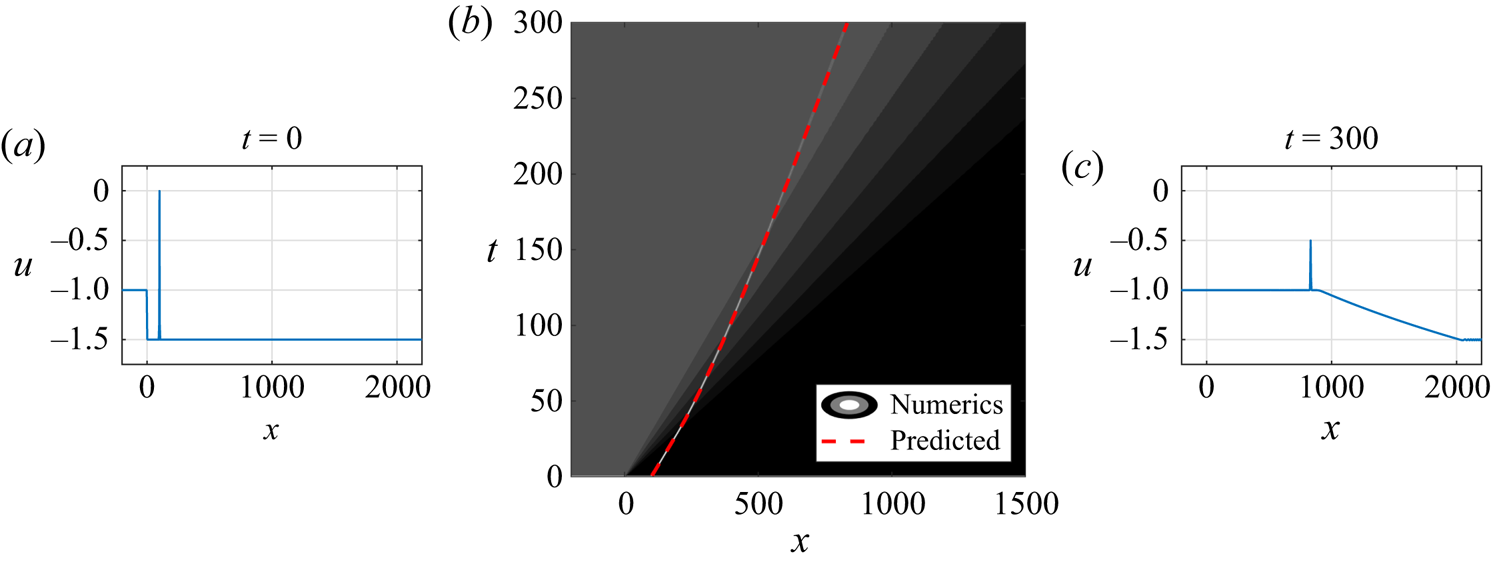
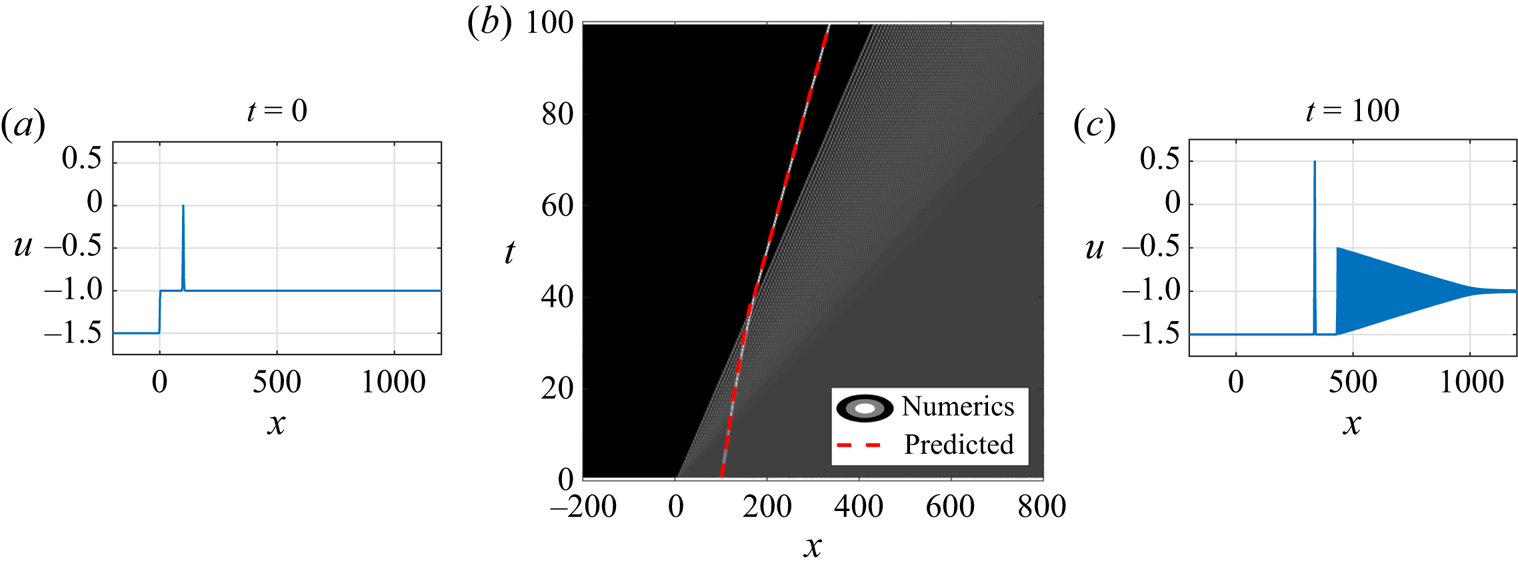
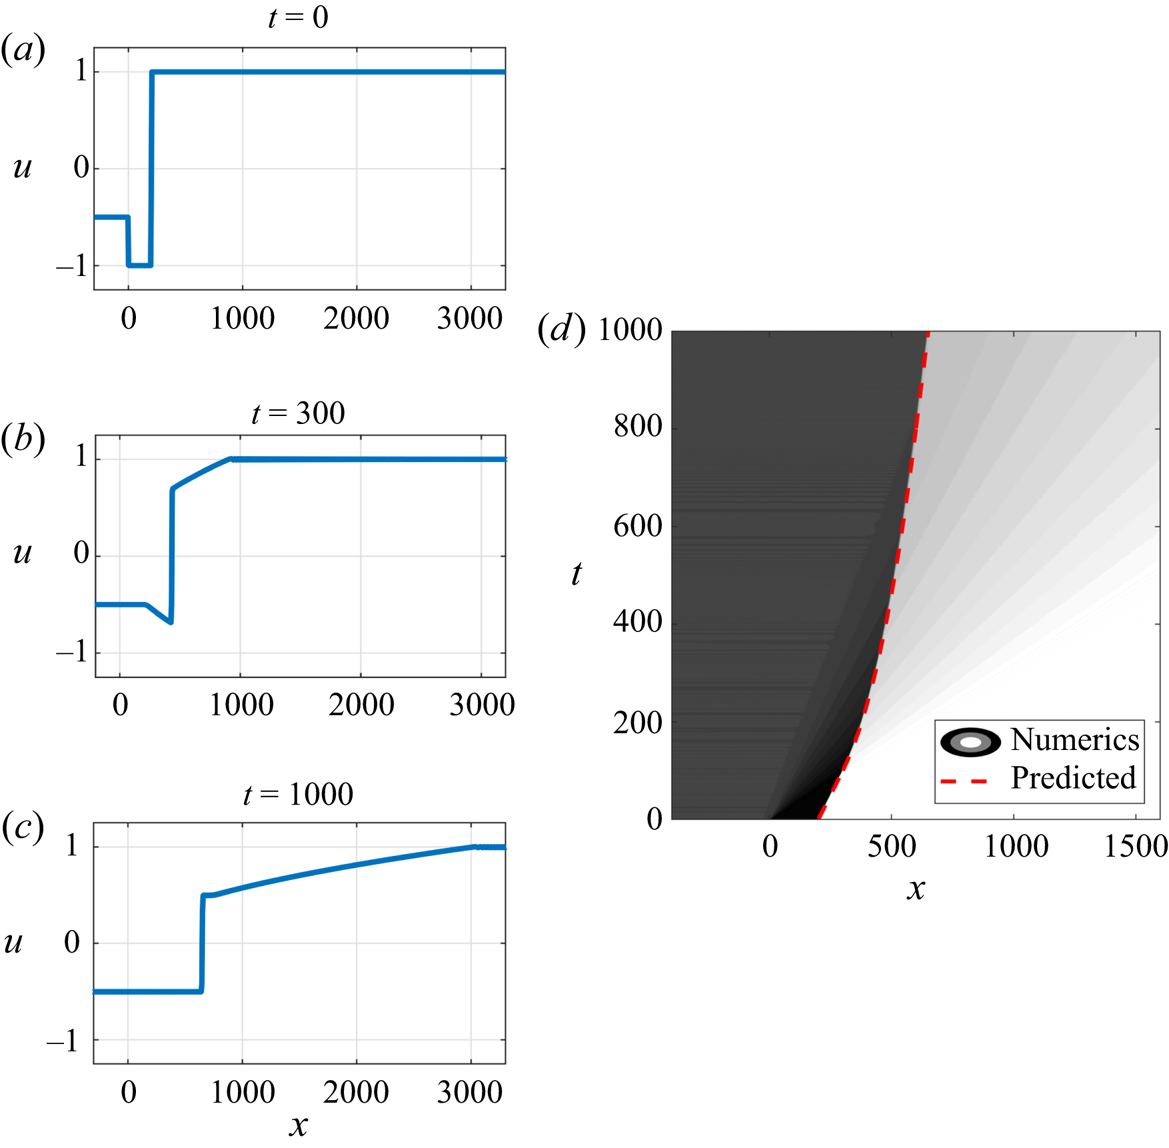
Since  $u_+ < u_- < 0$ in region VI, (7.2) gives a positive critical amplitude for transmission to occur. A numerical example of a soliton tunnelling through a RW in this case is shown in figure 4(a–c).
Soliton–RW interaction with  $\mu = 1$,
 $a_+ = 1.5$,
 $x_+ = 100$,
 $u_- = -1$,
 $u_+ =-1.5$. The soliton trajectory (light grey curve) is accurately predicted by soliton–mean theory (dashed curve). (a) Initial condition. (b) Space–time contour plot of solution with soliton characteristic (dashed). (c) Configuration at
 $t = 300$. The predicted amplitude
 $a_-$ and phase shift
 $\varDelta$ are 0.5 and 96.40, respectively. The numerical solution results in
 $a_- = 0.4981$ and
 $\varDelta = 95.02$ at
 $t = 300$.

The soliton trajectory is specified by  $\mathrm {d}\kern0.06em x/\mathrm {d}t = C(q,\bar {u})$, where
 $C(q, \bar {u})$ is given by (4.13). Integrating this equation we obtain
 \begin{equation} x(t) =
\left\{\begin{array}{@{}ll} (u_-^{2} + 2q^{2})t + E, &
x<3u_-^{2} t \\[2pt] 3q^{2}t + Dt^{1/3}, & 3u_-^{2} t < x <
3u_+^{2} t \\[2pt] (u_+^{2} + 2q^{2})t + x_+, & x>3u_+^{2} t
\end{array}\right. \end{equation}
where  $D$ and
 $E$ are obtained by continuity of
 $x(t)$
 $$\begin{gather} D = \tfrac{3}{2}x_+^{2/3}(2u_+^{2}-2q^{2})^{1/3} \end{gather}$$
 $$\begin{gather}E = x_+ \sqrt{\frac{u_+^{2}-q^{2}}{u_-^{2}-q^{2}}}. \end{gather}$$
The phase shift is  $\varDelta = E - x_+$, which matches the condition given by (6.1a,b).
A similar analysis can be carried out for each region in figure 3 to determine the tunnelling criterion. We summarise the remaining results without detailing the analysis for each case in table 1 for either sign of  $\mu$ in regions II and VI. Note that for
 $\mu < 0$ in region VI, the tunnelling criterion is different than the condition that
 $a_+ > 0$. This is because there are cases for valid initial soliton amplitudes
 $a_-$ where the amplitude crosses
 $-4\bar {u}$ during interaction with the RW, causing the soliton to become trapped. In the limit
 $t \to \infty$, the trapped soliton limits to an algebraic soliton moving with the mean flow velocity
 $3\bar {u}^{2}$.
Results for the bright soliton tunnelling problem through RWs;  $R\to L$ means that
 $x_0 = x_+$ and the soliton propagates from right (
 $R$) to left (
 $L$), otherwise
 $x_0 = x_-$ (
 $L \to R$).

Figure 5 illustrates the loss of strict hyperbolicity when  $\mu < 0$ for non-zero amplitudes by depicting the wave curves
 $a(\bar {u})$ corresponding to constant
 $q(a,\bar {u})$ and the corresponding soliton speed
 $c(a(\bar {u}),\bar {u})$. For interaction to occur in region VI, solitons are initialised on the left at
 $x_0 = x_-$ with mean flow
 $u_- < 0$ (we take
 $u_- = -1$) and amplitudes satisfying (A7). For initial amplitudes
 $-4 u_- < a_- < a_{cr} = -2(u_+ + u_-)$, solitons pass through the mean flow from
 $u_-$ to
 $u_+ < u_-$ (
 $u_+ = -2$) maintaining positive amplitude. But these wave curves eventually intersect the critical line
 $-4\bar {u}$ (shown in red). In figure 7(b), the corresponding soliton speeds are plotted. Intersection of
 $a(\bar {u})$ with
 $-4\bar {u}$ corresponds to the intersection of the soliton velocity
 $c(a,\bar {u})$ with the characteristic velocity
 $3\bar {u}^{2}$, also shown in red. As the two coincide, the soliton asymptotically limits to a trapped algebraic soliton propagating with characteristic velocity.
Simple wave curves of constant  $q(a,\bar {u})$ (solid) and curves of non-strict hyperbolicity (dashed) illustrating interaction with a RW with
 $u_- = -1$,
 $u_+ = -2$ and
 $\mu = -1$ for various initial amplitudes
 $a_-$. (a) Soliton amplitudes as a function of
 $\bar {u}$; (b) soliton speeds. When travelling from
 $u_-$ to
 $u_+$ with
 $a_-< a_{cr}$, the solid and dashed curves intersect, corresponding to loss of strict hyperbolicity.

7.2. Soliton tunnelling through DSWs: regions I and V
For  $\mu > 0$, the DSW leading and trailing edge velocities for both regions I and V of figure 3 are given by
 $s_+ = 6u_-^{2} - 3u_+^{2}$ and
 $s_- = u_-^{2} + 2u_+^{2}$ (El et al. Reference El, Hoefer and Shearer2017). Comparing the soliton's initial and edge velocities, we see that interaction occurs in region V (
 $u_-< u_+<0$) for both directions. In region I (
 $0 < u_+ < u_-$), bright solitons do not exist.
First, we consider the backward interaction in region V in which  $x_0 = x_+$. For the interaction to occur, the soliton speed
 $c(a_+,u_+)$ must be smaller than
 $s_+$, implying
 \begin{equation} 2(u_-{-} u_+) < a_+{<} -2u_+. \end{equation}
This condition is satisfied for any admissible, initial bright soliton  $a_+$. It and the transmission condition (6.1a,b) imply that
 $0 < a_- < -4u_-$ so, invoking monotonicity of the DSW mean flow, we can see that strict hyperbolicity and amplitude positivity is maintained along the soliton trajectory. The soliton will always tunnel.
Next, we consider forward interaction where  $x_0 = x_-$. In order for the soliton to overtake the DSW, we require
 $c(a_-,u_-) > s_-$, which implies that
 \begin{equation} q^{2} > u_+^{2}. \end{equation}
Then one of
 \begin{equation} a_-{>} -2(u_+{+}u_-), \quad \text{or} \quad a_-{<} 2(u_+{-} u_-) \end{equation}
holds. The first inequality in (7.8) cannot be satisfied for an admissible, initial bright soliton constrained by (A7). The second inequality in (7.8) can be satisfied by an initial bright soliton, but (6.1a,b) implies that  $a_+ < 0$ so the soliton is trapped. We can also see this by comparing the characteristic velocities
 $c(a_-,u_-)$ and
 $3u_-^{2}$ where valid initial soliton amplitudes
 $a_-$ satisfying (A7) result in
 $q^{2} < u_-^{2}$. Since
 $q^{2} > u_+^{2}$ is necessary for the interaction to occur (see (7.7)),
 $u_+^{2} > u_-^{2}$, and
 $\bar {u}$ is continuous, the velocities must intersect and therefore the soliton is trapped by the DSW.
For  $\mu < 0$, the DSW leading and trailing edge speeds are given by
 $s_+ = u_+^{2} + 2u_-^{2}$ and
 $s_- = 6u_+^{2} - 3u_-^{2}$ (El et al. Reference El, Hoefer and Shearer2017). Initial solitons with either
 $x_0 = x_+$ or
 $x_0 = x_-$ can exist in both regions I and V and the tunnelling criterion can again be determined by comparing velocities and then looking at the admissibility criterion for tunnelling. Table 2 summarises the results for bright soliton–DSW interaction.
Results for the bright soliton–DSW interaction problem.

Numerical experiments on soliton tunnelling through DSWs were conducted for both signs of  $\mu$ with results given in tables 3 and 4. Good agreement was found between the predicted amplitude and phase shift (6.1a,b), (6.3) and the numerical results, confirming that hydrodynamic reciprocity is maintained. Figure 6 shows one sample numerical solution.
Numerical tests of backward ( $R \to L$) bright soliton–DSW interaction for
 $\mu = 1$ and
 $x_+ = 100$ in region V.

Numerical tests of forward ( $L \to R$) bright soliton–DSW interaction,
 $\mu = -1$ and
 $x_- = 100$ in regions I and V.

Soliton–DSW interaction with  $\mu = 1$,
 $a_+ = 1$,
 $x_+ = 100$,
 $u_- = -1.5$ and
 $u_+ = -1$. (a) Initial condition. (b) Space–time contour plot of solution with soliton characteristic (dashed). (c) Configuration at
 $t = 100$. The predicted
 $a_-$ is 2 and the predicted
 $\varDelta$ is
 $-38.76$. At
 $t=100$, the numerical solution gives
 $a_- = 1.9960$ and
 $\varDelta = -38.33$.

For a RW, the soliton trajectory  $x(t)$ and amplitude
 $a(\bar {u})$ throughout the soliton–RW interaction is known. In contrast, the mean flow
 $\bar {u}(x,t)$ for a DSW is given by the modulation of a periodic travelling wave and is more complicated. Although the soliton amplitude and phase shift on either side of the DSW can be predicted without knowing the space–time variation of the mean flow in the DSW's interior by invoking hydrodynamic reciprocity (see § 3.3), the Riemann invariants
 $q$ and
 $kp$ of the augmented solitonic system (4.8), (4.9) are not held constant throughout the DSW. What is desired is some way to estimate the wave curve
 $a(\bar {u})$ within the DSW. Since
 $\bar {u}$ is known and now described by (5.8) rather than
 $\bar {u}_t + f'(\bar {u})\bar {u}_x=0$, we require an alternative approach to approximating the wave curve
 $a(\bar {u})$.
To obtain  $a(\bar {u})$ along the soliton trajectory
 $\mathrm {d}\kern0.06em x/\mathrm {d}t = c(a, \bar {u})$, we make an assumption that soliton–DSW interaction can be approximated by the interaction of a soliton with the DSW mean flow, and take advantage of the characteristic ODE (3.13) in which we replace the characteristic velocity
 $f'(\bar {u})$ in the RW solution with the characteristic velocity
 $W_2(\bar {u})$ of the simple wave equation (5.8) for the DSW modulation solution. The velocity
 $W_2(\bar {u})$ is specified parametrically by (5.3a,b), (5.4) (or equivalently, (5.7), (5.5)). Thus, we obtain the ODE
 \begin{equation} \frac{\mathrm{d}\tilde{k}}{\mathrm{d}\bar{u}} = \frac{\partial _{\bar{u}}\tilde{\omega}_0}{W_2(\bar{u})- \partial_{\tilde{k}} \tilde{\omega}_0},\quad \tilde{k}(u_-) = \tilde{k}_- , \end{equation}
where, as earlier,  $\tilde {\omega }_0 = -\textrm {i}\omega _0(\textrm {i}\tilde {k},\bar {u})$ and
 $\omega _0(k,\bar {u})$ is the mKdV linear dispersion relation (4.1). The relation between the conjugate wavenumber
 $\tilde k$ and the soliton amplitude
 $a$ is given by (3.14), which is
 \begin{equation} \tilde{k}^{2} ={-}\frac{1}{\mu}\left(\frac{1}{2}a^{2}+2a\bar{u}\right) , \end{equation}
so that  $\tilde {k}_-$ is (7.10) evaluated at
 $a = a_-$,
 $\bar {u} = u_-$. Substituting the expression for
 $W_2(\bar {u})$ given by (5.3a,b) or (5.7) and the dispersion relation (4.1) into (7.9a,b), we can numerically integrate for
 $\tilde {k}(\bar {u})$ and invert (7.10) to solve for the approximate wave curve
 $a(\bar {u})$. Since (7.10) is double valued, we use the existence conditions (A7) for
 $\mu > 0$ and (A13) for
 $\mu < 0$ in order to determine the correct value for
 $a$.
We now consider the implications of this mean flow approach toward understanding soliton–DSW interaction for each sign of  $\mu$ separately.
First, for  $\mu > 0$ and a backward soliton (
 $x_0 = x_+ > 0$) tunnelling through a DSW
 $^{+}$ (region V), figure 7(a) shows the wave curves
 $a(\bar {u})$ representing the soliton amplitude as it passes through the DSW mean flow with corresponding local trajectory velocity in figure 7(b). As expected from table 2, the soliton always tunnels through the DSW from right to left (
 $x_0 = x_+ >0$). For any valid initial positive amplitude satisfying
 $0 < a_+ < -2 u_+$ (A7), the soliton's amplitude neither crosses the critical line
 $-2\bar {u}$ nor decays to zero during propagation. Correspondingly, the velocities of solitons starting at
 $u_+ = -1$ and moving to
 $u_- = -1.5$ mostly remain below the DSW velocity
 $W_2(\bar {u})$, save for very small
 $a_+$. However, examining solitons travelling from left to right (
 $x_0 = x_- <0$), if the initial amplitude is below the critical value
 $a_- < a_{cr} = 2(u_+-u_-)$, the soliton is trapped and the amplitude decays to zero. The initial amplitudes below
 $a_{cr}$ in figure 7(a) correspond to the velocities in figure 7(b) that lie between
 $3\bar {u}^{2}$ and the characteristic
 $W_2(\bar {u})$, indicating that the soliton is trapped. Initial amplitudes satisfying
 $a_- > a_{cr}$ correspond to soliton velocities that never catch up to the DSW,
 $c(a_-,u_-) < W_2(u_-)$, so soliton–DSW interaction does not occur.
Solition amplitudes (a) and corresponding local velocities (b) of a soliton interacting with a DSW $^{+}$ for
 $u_- = -1.5$,
 $u_+ = -1$ and
 $\mu = 1$. When traversing curves from
 $u_+$ to
 $u_-$ with
 $a_+ < a_{cr} =$, the curves intersect the characteristics corresponding to loss of strict hyperbolicity. In this case, these amplitudes decay to zero.

We make two consistency checks in figure 8. The soliton amplitude  $a(u_-)$ computed from the wave curve
 $a(\bar {u})$ that includes the point
 $a(u_+) = a_+$ remains within 8 % of
 $a_- = a_+ + 2(u_+-u_-)$ predicted by the transmission condition (6.1a,b) when
 $u_- = -1.5$,
 $u_+ = -1$. This result holds for all initial amplitudes satisfying
 $0 < a_+ \lessapprox 1.7134$. The upper bound on admissible initial amplitudes is below the critical value
 $a_{cr} = 2$. When
 $1.7134 < a_+ < 2$, the wave curve terminates at
 $a(\bar {u}) = -2\bar {u}$ for
 $\bar {u} > u_- = -1.5$ as shown in figure 7(a). The error is shown in figure 8 as a function of initial soliton amplitude.
Relative error in the predicted transmitted soliton amplitude  $a(u_-)$ and soliton phase shift
 $\bar {\varDelta }$ for soliton–DSW
 $^{+}$ interaction using the mean flow description from right to left. Parameter values are
 $\mu = 1$,
 $x_0 = x_+ = 100$,
 $u_- = -1.5$ and
 $u_+ = -1$.

Another consistency check is the predicted phase shift
 \begin{equation} \bar{\varDelta} \equiv x_+{-} (x(t_-) - c(a(u_-),u_-) t_-),\quad \frac{\mathrm{d}\kern0.06em x}{\mathrm{d}t} = \frac{\tilde{\omega}(\tilde{k}(x,t),\bar{u}(x,t))}{\tilde{k}(x,t)},\quad x(t_+) = s_+ t_+, \end{equation}
where  $t_\pm$ are the times that the soliton's trajectory crosses the DSW's leading (
 $s_+t$) and trailing (
 $s_- t$) edges. This is compared with the phase shift
 $\varDelta$ determined by the transmission condition (6.3) in figure 8.
An interesting case where convexity is lost, but the trapped soliton amplitude does not decay to zero is for  $\mu < 0$ and a soliton interacting with a DSW
 $^{-}$ (region V). Figure 9(a) shows the soliton amplitude as it passes through the DSW and figure 9(b) shows the corresponding soliton velocity. When travelling from left to right (
 $x_0 = x_- < 0$) with
 $u_- = -1.5$, admissible solitons satisfying (A13) always have velocities faster than
 $W_2(\bar {u})$, so interaction occurs but the velocities never cross
 $W_2(\bar {u})$ so strict hyperbolicity is maintained. This can also be seen in the smooth amplitude curves from
 $u_-$ to
 $u_+$, which never intersect
 $-4\bar {u}$. However, when the soliton is slow enough to interact from right to left through the DSW from
 $u_+ = -1$ to
 $u_- = -1.5$, then the soliton becomes trapped and the velocities lie between
 $3\bar {u}^{2}$ and
 $W_2(\bar {u})$. This corresponds to amplitudes below the critical amplitude
 $a_{cr} = 2(u_+-u_-)$. For a soliton with amplitudes below this critical amplitude, the velocity crosses
 $W_2$ and limits to
 $3\bar {u}^{2}$, while the amplitude limits to
 $-4\bar {u}$, indicating that it behaves like an algebraic soliton.
Soliton interaction with a DSW $^{-}$ with
 $u_- = -1.5$,
 $u_+ = -1$ and
 $\mu = -1$ for various amplitudes. When initialised on the right at
 $u_+$ with
 $a_+< a_{cr}$, the wave curves do not reach
 $u_-$ so the soliton is trapped. (a) Soliton amplitudes and (b) soliton velocities.

When tunnelling occurs, the transmitted amplitude from numerical integration of the ODE (7.9a,b) is compared with the amplitude predicted by transmission conditions and the error is shown in figure 10. For initial amplitudes that satisfy  $a_- > 6.1$ with
 $a_{cr} = 6$ for
 $u_- = -1.5$ and
 $u_+ = -1$, the computed soliton amplitude
 $a(u_+)$ is within 1 % of the predicted amplitude. The predicted phase shift based on (7.11a–c) with subscripts
 $-$ replaced with
 $+$ is also compared with the phase shift as determined from the transmission condition (6.3) in figure 10.
Relative error in the predicted transmitted soliton amplitude  $a(u_+)$ and soliton phase shift
 $\bar {\varDelta }$ for soliton–DSW
 $^{+}$ interaction using the mean flow description from left to right. Parameter values are
 $\mu = -1$,
 $x_0 = x_- = -100$,
 $u_- = -1.5$ and
 $u_+ = -1$.

8. Soliton–non-convex mean flow interaction
In this section, we study interactions of solitons with non-convex mean flows arising from the mKdV GP problem with  $u_- u_+ <0$. We consider interactions with ‘pure’ non-convex mean flows generated for the symmetric conditions
 $u_-=-u_+$. These are kinks (
 $\mu >0$) and CDSWs (
 $\mu <0$); see § 5.2.
8.1. Soliton–kink interaction
A kink solution to the GP problem when  $\mu > 0$ is realised when
 $u_+ = -u_-$. To be definite, we assume that
 $u_-<0$. The kink velocity
 $u_-^{2}=u_+^{2}$ is slower than the soliton velocity for any amplitude so interaction happens from left to right with
 $x_0 = x_- < 0$. By the soliton existence conditions (A7), when
 $u_- < 0$, we must initialise with a bright soliton
 $(a_- > 0)$ on the left side. Since bright solitons cannot exist on the right side of the kink where
 $u_+ > 0$, we expect that the soliton polarity undergoes a switch as a result of kink interaction in order for the soliton to be a valid solution. To determine the transmitted soliton amplitude, we observe that, under the quadratic transformation (B3), the mKdV soliton–kink interaction problem in the limit
 $\mu \to 0$ is mapped onto the problem of KdV soliton train propagation on a background
 $-3\bar {u}^{2}$ described by the modulation system (cf. (4.5))
 \begin{equation} \left.\begin{gathered} \frac{\partial r_1}{\partial t} - r_1 \frac{\partial r_1}{\partial x} = 0, \\ \frac{\partial r_3}{\partial t} - \frac 13(r_1+2r_3) \frac{r_3}{\partial x} = 0, \end{gathered}\right\} \end{equation}
where  $r_1=-3\lambda _1^{2}$ and
 $r_3=-3\lambda _3^{2}$. Since
 $\lambda _1=\bar {u}$, the quadratic transformation maps the discontinuous solution (5.9) for
 $\bar {u}$ to the constant solution
 $r_1 = -3 \bar {u}^{2}= -3 u_-^{2}$ of the first equation in (8.1). The constant solution
 $r_3=const$, mapped to
 $\lambda _3 = const$, solves the second equation, implying
 $|a|=2(\lambda _3-\lambda _1)= const$ for the mKdV equation.
The transformation of the soliton amplitude in soliton–kink tunnelling can be obtained from the transmission condition (6.1a,b) by assuming that the normalisation (3.15) of the Riemann invariant  $q=Q(a, \bar {u})$ changes to
 $Q(0, \bar {u})=-\bar {u}$ when crossing the zero convexity point
 $\bar {u}=0$ at
 $x=0$, yielding the transmission condition
 $u_++\frac 12 a_+ = -(u_-+\frac 12 a_-)$. Since
 $u_-=-u_+$, we obtain
 $a_+ = - a_-$. Inserting this result into the soliton phase shift formula (6.3), we obtain
 $\varDelta =0$. To be clear, the predicted zero phase shift is an approximate result within the context of modulation theory in the limit
 $\mu \to 0$. For non-zero but small
 $\mu$, a small phase shift due to soliton–kink interaction is expected. Such an interaction for the mKdV equation can be investigated using the inverse scattering transform (IST) with non-zero boundary conditions developed for both signs of
 $\mu$ in Zhang & Yan (Reference Zhang and Yan2020). Within the IST formalism, the conservation of the absolute value of the soliton amplitude pre and post interaction is a consequence of the discrete spectrum's conservation.
Numerical experiments with results in table 5 confirm that, as the soliton propagates through the kink, it switches polarity while preserving the absolute value of the amplitude and that the phase shift is very small, as seen in figure 11. The observed small phase shift from numerical experiments is due to the non-zero value of  $\mu$ used in numerical simulations. Note that the kink itself undergoes a phase shift in the direction opposite to the soliton.
Numerical tests of bright soliton–kink interaction from left to right for  $\mu = 1$ with
 $x_- = 50$. Values for
 $a_+$ and
 ${\rm \Delta} x$ according to the transmission conditions are compared with numerical (num) results.

Soliton–kink interaction for  $\mu = 1$,
 $a_- = 1$,
 $x_- = -50$,
 $u_- = -1$ and
 $u_+ = 1$. (a) Initial condition. (b) Space–time contour plot of solution with soliton characteristic (dashed). (c) Configuration at
 $t = 200$. The predicted
 $a_+$ is –1, after flipping polarity in the interaction, and the predicted phase shift
 $\varDelta$ is 0. The numerical solution gives
 $a_+ = -1.0000$ and
 $\varDelta = 2.1484$ at
 $t = 200$.

(a–c) a soliton and CDSW $^{+}$ interaction where
 $\mu = -1$,
 $a_- = 1$,
 $x_- = -50$,
 $u_- = 0.5$ and
 $u_+ = -0.5$. (a) Initial condition. (b) Space–time contour plot of solution with soliton characteristic (dashed). (c) Configuration at
 $t = 120$. (d–f) soliton and CDSW
 $^{-}$ where
 $\mu = -1$,
 $a_- = 2.5$,
 $x_- = -50$,
 $u_- = -0.5$ and
 $u_+ = 0.5$. (d) Initial condition. (e) Space–time contour plot of solution with soliton characteristic (dashed). (f) Configuration at
 $t = 120$.

8.2. Soliton–CDSW interaction
When  $\mu < 0$ and
 $u_- = -u_+$, the resulting solution that emerges from the GP problem is a CDSW. The leading and trailing edge travel at characteristic velocity
 $s_+ = 3u_-^{2}$ and
 $s_- = -3u_-^{2}$, so that solitons can only interact with the CDSW from left to right,
 $x_0 = x_- < 0$. Tunnelling always occurs in this interaction and the transmitted amplitude is obtained from (6.1a,b) as
 \begin{equation} a_+{=}a_-{+}4u_-. \end{equation}
By the existence conditions (A13), an initial soliton satisfies  $a_- > -4u_-$. To maintain strict hyperbolicity,
 $a_+ > -4u_+$ as well. Using the transmission condition, we observe
 $$\begin{gather} a_+{>} -4u_+ \end{gather}$$
 $$\begin{gather}\implies a_-{>} 2u_+{-} 2u_-{=} -4u_-, \end{gather}$$
and this relation is always satisfied by  $a_-$ so strict hyperbolicity is maintained.
The predicted phase shift is found from (6.3) with  $u_+ = -u_-$ and
 $a_+$ given by (8.2). As with the pure kink interaction,
 $\varDelta = 0$. Numerical experiments shown in table 6 verify the conservation of
 $q$ and
 $kp$, although we do see a small phase shift, likely due to higher order effects. See figure 12 for depictions of soliton interaction with CDSWs of both polarities at the boundaries of regions VII and VIII (positive polarity) and III and IV (negative polarity). The predicted soliton trajectory (dashed) in figure 12 was generated by assuming that it was unchanged by the mean flow, rather than considering the CDSW mean flow given by (5.10) and the ODE (7.9a,b). This approximation is justified by the predicted zero phase shift and unchanged soliton velocity post CDSW interaction.
Numerical tests of bright soliton–CDSW interaction from left to right for  $\mu = -1$ and
 $x_- = -50$.

In contrast to the soliton–kink interaction, the soliton–CDSW interaction does not result in the soliton's polarity change. This is because strict hyperbolicity is maintained throughout and the existence condition (A13) for solitons with  $\mu < 0$ allow for bright solitons on either side of the mean flow.
8.3. Hybrid mean flows
Regions III, IV, VII and VIII for the Riemann problem result in hybrid mean flow dynamics involving a CDSW or kink coexisting with a RW or DSW. The analysis for RWs, DSWs and pure kinks and CDSWs serve as the building blocks for determining the soliton tunnelling criterion through these combination flows. We summarise these results for  $\mu > 0$ in table 7 and for
 $\mu < 0$ in table 8.
Results for  $\mu > 0$ with bright solitons interacting with hybrid mean flows.

Results for  $\mu < 0$ with bright solitons interacting with hybrid mean flows.

Backward kink–RW interaction with  $\mu = 1$,
 $a_+ = 2$,
 $x_+ = 200$,
 $u_- = -0.5$ and
 $u_+ = -1$. (a) Initial condition. (b) Configuration at intermediate time
 $t = 300$. (c) Configuration at
 $t = 1000$. (d) Space–time contour plot of solution with kink characteristic (dashed). The predicted
 $a_-$ is 1 and the predicted
 $\varDelta$ is 200. The numerical solution gives
 $a_- = 0.9984$ and
 $\varDelta = 199.02$ at
 $t = 1000$.

Kink–DSW interaction with  $\mu = 1$,
 $a_+ = 1$;
 $x_+ = 150$,
 $u_- = -1$ and
 $u_+ = -0.5$. (a) Initial condition. (b) Configuration at intermediate time
 $t = 50$. (c) Configuration at
 $t = 250$. (d) Space–time contour plot of solution with kink characteristic (dashed). The predicted
 $a_-$ is 2 and the predicted
 $\varDelta$ is -75. The numerical solution gives
 $a_- = 2.0022$ and
 $\varDelta = -74.56$ at
 $t = 250$.

9. Kink–mean flow interaction
So far, we have considered the case of solitons interacting with mean flows. Kinks are another localised wave structure that arise as solutions in non-convex systems, so it is natural to consider their interaction with mean flows. Unlike in soliton–mean flow tunnelling where the mean flow is essentially unchanged by the interaction, in this case, both the kink and the mean flow are significantly altered by the interaction. In addition, we find that the admissibility condition for tunnelling is always satisfied by the kink so there is no trapping.
Kinks occur when  $u_3 \to u_2 = u_1$, causing all three modulation equations in the system (4.3) to collapse into the dispersionless mean flow equation
 $\bar {u}_t + 3 \bar {u}^{2} \bar {u}_x=0$. The amplitude of the kink is
 $a = -2\bar {u}$, resulting in
 $q = 0$. Since the kink velocity is slower than the RW or DSW speed, it can only interact from right to left. The kink trajectory is given by
 \begin{equation} \frac{\mathrm{d}\kern0.06em x}{\mathrm{d}t} = \bar{u}^{2},\quad x(0) = x_+, \end{equation}
which satisfies the Rankine–Hugoniot condition. The kink propagates like a shock.
(i) Kink–RW interaction
The kink trajectory during interaction with a RW is the shock trajectory and can be solved for explicitly using (5.1) and (9.1a,b), giving
 \begin{equation} \frac{\mathrm{d}\kern0.06em x}{\mathrm{d}t} = \frac{x}{3t},\quad 3u_-^{2} t < x< 3u_+^{2} t, \end{equation}
with the initial position given by  $x_0 = x_+ > 0$. Numerical experiments verify that this is true, as seen in figure 13. As the kink travels through, the RW switches polarity.
Again for DSWs, interaction with the kink causes the DSW to switch polarity as seen in the numerical experiment of figure 14. These polarity switches are only possible due to non-convexity. The kink–DSW trajectory is given by (9.1a,b), where the DSW mean flow  $\bar {u} = \bar {u}(x/t)$ is determined by (5.4), (5.2a–c) and (5.3a,b).
Note that kink–kink interaction is not possible as multiple kinks will co-propagate.
10. Generalisation to arbitrary soliton–convex mean flows
We have described soliton tunnelling interactions specifically with mean flows that emerge from a Riemann step-type initial condition. However, the tunnelling problem can be generalised to determine the phase shift and amplitude of a soliton that tunnels through an arbitrary mean hydrodynamic flow. If tunnelling occurs, only the far-field mean flow conditions  $u_-$ and
 $u_+$ are needed to predict the transmitted soliton amplitude. The phase shift can be calculated by approximating the initial mean flow
 $\bar {u}(x,0)$ with a series of step functions and taking a limit that results in the Riemann integral
 \begin{equation} \varDelta =
\left\{\begin{array}{@{}ll} \displaystyle
\int_{x_-}^{x_0}\left(\sqrt{\dfrac{\bar{u}(x,0)^{2} -
q^{2}}{u_-^{2} -q^{2}}} -1 \right){\textrm{d}\kern0.06em x}, &
\text{assuming } R \to L \\[12pt] \displaystyle \int_{x_0}^{x_+}
\left(\sqrt{\dfrac{\bar{u}(x,0)^{2} - q^{2}}{u_+^{2}
-q^{2}}} -1\right){\textrm{d}\kern0.06em x}, & \text{assuming } L \to
R, \end{array}\right.
\end{equation}
where  $x_0$ is the initial soliton position and
 $x_-$ or
 $x_+$ is a point where the mean flow has equilibrated to the far-field constant.
This phase shift calculation holds only when the system remains strictly hyperbolic, otherwise we have  $\bar {u} \to q$ as the soliton travels through the mean flow and trapping will occur. However, this can also be predicted from the far-field mean flow conditions, as we have done throughout this work.
Figure 15 depicts a numerical example of a soliton tunnelling through a mean flow that is a combination of a Gaussian and a Riemann step. The predicted trajectory pre and post mean flow interaction shows good agreement with the numerics, as does the transmitted amplitude.
Soliton interaction with an arbitrary mean flow with  $\mu = -1$,
 $x_+ = 150$,
 $a_+ = 1$,
 $u_- = -1.5$ and
 $u_+ = -1$. (a) Initial condition. (b) Space–time contour plot of the solution with soliton characteristic (dashed). (c) Configuration post soliton-mean flow interaction at
 $t = 150$. The predicted amplitude after tunnelling is 2 and the predicted phase shift is -69.28. The numerical result is
 $a_- = 2.028$ and
 $\varDelta = -69.24$ at
 $t = 150$.

11. Conclusions and outlook
In this work, we have investigated the impact of hydrodynamic flux non-convexity on soliton–mean flow interaction. Solitons include exponential and algebraically decaying solutions and the heteroclinic kink solution whereas mean flows are RWs and (convex, undercompressive or contact) DSWs. Scale separation enables the use of asymptotic wave modulation theory, formulated in a general form, that exhibits two invariants relating soliton parameters pre- and post-mean interaction. One of the main results of our study is the general admissibility criterion for a soliton to tunnel through a mean flow, which is formulated in terms of maintenance of strict hyperbolicity (distinct characteristic speeds) of the solitonic modulation system (3.4) through the interaction. Conversely, trapping occurs when the characteristics of the solitonic system coalesce. This general theory is used to study the mKdV equation, a non-convex model of internal waves and potential vorticity fronts in stratified fluids. We predict soliton polarity reversal resulting from interaction with an undercompressive DSW (kink). Similarly, kink–DSW and kink–RW interactions result in a mean flow polarity change, accompanied by transformation of the kink. Thus, non-convex soliton–mean interaction exhibits a two-way interaction.
An important application of this analysis is to the nonlinear dynamics of internal ocean waves, where solitons of both polarities and mean flows such as RWs, DSWs (undular bores) and kinks (solibores) are often observed due, for example, to tidal flow over a sill that then slackens (Holloway, Pelinovsky & Talipova Reference Holloway, Pelinovsky and Talipova2001; Apel Reference Apel2002), internal wave propagation onto a shallow shelf (Davis et al. Reference Davis, Arthur, Reid, Rogers, Fringer, DeCarlo and Cohen2020) or intruding gravity currents (la Forgia et al. Reference la Forgia, Ottolenghi, Adduce and Falcini2020). When reflections occur due to additional topographic features, such large-scale mean flows may encounter solitons of different speeds (la Forgia et al. Reference la Forgia, Ottolenghi, Adduce and Falcini2020), leading to the type of soliton–mean interaction described here. Along with the mKdV equation, internal waves can be modelled by the Gardner equation that combines KdV and mKdV hydrodynamic fluxes (Grimshaw Reference Grimshaw2002; Helfrich & Melville Reference Helfrich and Melville2006). The generalisation of our results to the Gardner equation is straightforward. We stress that our approach does not make use of the integrability of the mKdV equation, so can be applied to a non-integrable, non-convex dispersive hydrodynamics. In particular, a new, intriguing non-convex scalar model has recently been derived for the contour dynamics of long-wave potential vorticity coastal fronts in Jamshidi & Johnson (Reference Jamshidi and Johnson2020). The model is shown to accurately depict quasi-geostrophic contour dynamics (Pratt & Stern Reference Pratt and Stern1986), generalising previous work from free fronts, involving a Rossby wave where mKdV models the dynamics (Pratt Reference Pratt1988; Gruzinov Reference Gruzinov1992; Nycander et al. Reference Nycander, Dritschel and Sutyrin1993), to fronts in which the coastal boundary introduces additional flows due to Kelvin waves and the image vortical current. Non-convexity was found to play a prominent role when boundary vortical effects are dominant. This suggests that non-convex interactions such as soliton–solibore, solibore–rarefaction and solibore–undular bore scenarios described here could occur in the near shore vortical dynamics. The study of soliton–mean flow interaction for this model and its fluid dynamic implications would be an interesting and relevant application of the theory presented here.
Our theory can also be extended to bidirectional wave systems describing internal gravity waves in fluids with the Miyata–Choi–Camassa equations (Choi & Camassa Reference Choi and Camassa1999) being an obvious, fully nonlinear, long-wave candidate model. Other applications outside the realm of classical fluid dynamics include polarisation waves in two-component Bose–Einstein condensates (Congy, Kamchatnov & Pavloff Reference Congy, Kamchatnov and Pavloff2016; Ivanov et al. Reference Ivanov, Kamchatnov, Congy and Pavloff2017), nonlinear optics described by non-convex equations (Ivanov & Kamchatnov Reference Ivanov and Kamchatnov2017; Ivanov Reference Ivanov2020) and collisionless plasmas (Nakamura, Ferreira & Ludwig Reference Nakamura, Ferreira and Ludwig1985; Chanteur & Raadu Reference Chanteur and Raadu1987; Ruderman et al. Reference Ruderman, Talipova and Pelinovsky2008). Yet another possible application is in the hydrodynamic interpretation of a far-from-equilibrium nonlinear magnetisation dynamics such as in Iacocca, Silva & Hoefer (Reference Iacocca, Silva and Hoefer2017), where solitons and DSWs can also emerge.
Future directions include considering dispersion as an additional source of non-convexity. Such systems are abundant in geophysical fluids, describing magma and glacier flows (Scott, Stevenson & Whitehead Reference Scott, Stevenson and Whitehead1986; Stubblefield et al. Reference Stubblefield, Spiegelman and Creyts2020) or wave–ice sheet interactions (Il'ichev & Tomashpolskii Reference Il'ichev and Tomashpolskii2015). Indeed, recent works on DSWs in systems with non-convex dispersion (Lowman & Hoefer Reference Lowman and Hoefer2013; El & Smyth Reference El and Smyth2016; Sprenger & Hoefer Reference Sprenger and Hoefer2017; Hoefer, Smyth & Sprenger Reference Hoefer, Smyth and Sprenger2019; Baqer & Smyth Reference Baqer and Smyth2020; Congy et al. Reference Congy, El, Hoefer and Shearer2021) reveal a plethora of unusual behaviours that can lead to new, interesting soliton–mean flow interactions.
Funding
The work of G.A.E. was partially supported by EPSRC grant EP/R00515X/2. The work of M.A.H. and K.V.D.S. was partially supported by NSF grant DMS-1816934.
Declaration of interests
The authors report no conflict of interest.
Appendix A. The mKdV travelling wave solutions
The mKdV travelling wave solutions  $u = u(\eta )$,
 $\eta = {(x-Ut)}/{\sqrt {2|\mu |}}$ are described by the ODE
 \begin{equation} (u_\eta)^{2} = \text{sgn}(\mu) (u-u_1)(u-u_2)(u-u_3)(u-u_4) \equiv Q(u) , \end{equation}
subject to the constraint  $\sum _{i=1}^{4} u_i = 0$ and ordering of the roots
 $u_1 \leq u_2 \leq u_3 \leq u_4$. We only consider the modulationally stable case in which all roots are real. The phase velocity
 $U$ is given by
 \begin{equation} U ={-}\tfrac{1}{2}(u_1 u_2 + u_1 u_3 + u_1 u_4 + u_2 u_3 + u_2 u_4 + u_3 u_4). \end{equation}
Equation (A1) is a nonlinear oscillator equation in the potential  $-Q(u)$. Figure 16 shows representative potential curves
 $Q(u)$ for both signs of the dispersion coefficient
 $\mu$. Travelling wave solutions exist in the regions where
 $Q(u)>0$ (shaded regions) and can be obtained by integrating (A1) in terms of Jacobi elliptic functions. The cases
 $\mu <0$ and
 $\mu >0$ are treated separately.
(i) For  $\mu > 0$, the travelling wave solution is expressed in terms of Jacobi elliptic functions as
 \begin{equation} u = u_2 + \frac{(u_3-u_2)\text{cn}^{2}(\theta,m)} {1-\frac{u_3-u_2}{u_4-u_2}\text{sn}^{2}(\theta,m)}, \end{equation}
with  $\theta = \sqrt {(u_3-u_1)(u_4-u_2)}\eta$ and modulus
 $m=m_+ = {(u_3-u_2)(u_4-u_1)}/(u_4-u_2) (u_3-u_1)$. The wavenumber of the travelling wave is given by
 \begin{equation} k = \frac{{\rm \pi} \sqrt{(u_3-u_1)(u_4-u_2)}}{2K(m)\sqrt{2|\mu|}}. \end{equation}
When  $u_2 \to u_1$ (
 $m_+ \to 1$), the solution becomes a bright (positive polarity) soliton with amplitude
 $a = u_3-u_1$, mean background
 $\bar {u} = u_1<0$,
 \begin{equation} u = u_1 + \frac{u_3-u_1}{\cosh^{2} \theta - \frac{u_3-u_1}{u_4-u_1}\sinh^{2}\theta}, \end{equation}
which travels with the velocity  $U = c_+$
 \begin{equation} c_+(a,\bar{u}) = \tfrac{1}{2}a^{2} + 2a\bar{u}+ 3\bar{u}^{2}. \end{equation}
Due to the root ordering, these bright solitons exist only for a certain range of positive amplitudes and a negative background, given by the constraint
 \begin{equation} 0 < a <{-}2\bar{u}. \end{equation}
Dark (negative polarity) soliton solutions occur when  $u_3 \to u_4$ instead. In this case,
 $\bar {u} =u_4>0$,
 $a=u_2-u_4<0$ and the soliton velocity
 $U = c_-$
 \begin{equation} c_-(a,\bar{u}) = \tfrac{1}{2}a^{2} - 2a\bar{u}+ 3\bar{u}^{2}. \end{equation}
with negative amplitudes  $a$ satisfying
 \begin{equation} -2 \bar{u} < a <0. \end{equation}
Potential curve  $Q(u)$ of the nonlinear oscillator equation (A1). Travelling wave solutions exist in the shaded regions. (a)
 $\mu > 0$ and (b)
 $\mu < 0$.

When  $u_2 \to u_1$ and additionally,
 $u_3 \to u_4$, the travelling wave becomes a kink,
 \begin{equation} u ={\pm} \bar{u} \tanh(\bar{u}\eta), \end{equation}
a heteroclinic smooth transition connecting two equilibria  $\bar {u} = u_1<0$ and
 $-\bar {u}=u_4>0$ (note that the constraint
 $\sum u_j=0$ becomes
 $u_4+u_1=0$ in this limit) and travelling with speed
 $U = \bar {u}^{2}$, which matches the classical shock speed determined by the Rankine–Hugoniot condition.
(ii) For  $\mu < 0$, travelling wave solutions can occur between
 $u_1$ and
 $u_2$ or between
 $u_3$ and
 $u_4$. Between
 $u_3$ and
 $u_4$, the travelling wave solution is
 \begin{equation} u = u_3 + \frac{(u_4-u_3)\text{cn}^{2}(\theta,m)}{1+\dfrac{u_4-u_3}{u_3-u_1}\text{sn}^{2}(\theta,m)}, \end{equation}
with  $m=m_- = {(u_4-u_3)(u_2 - u_1)}/{(u_4-u_2)(u_3-u_1)}$. The wavenumber is given by the same formula (A4). When
 $u_3 \to u_2$ (
 $m_- \to 1$) the solution becomes a bright exponential soliton with amplitude
 $a = u_4-u_2$ and background
 $\bar {u} = u_2$
 \begin{equation} u = u_2 + \frac{u_4-u_2}{\cosh^{2} \theta + \dfrac{u_4-u_2}{u_2-u_1}\sinh^{2}\theta}. \end{equation}
This soliton solution travels according to the same soliton amplitude–speed relation (A6) as in the case  $\mu > 0$. Due to the root ordering, valid bright soliton amplitudes for the solution to exist are given by
 \begin{equation} a > max(0,-4\bar{u}), \end{equation}
with no constraint on the background  $\bar {u}$.
For  $\mu <0$, there is a special type of travelling wave solution expressible in terms of trigonometric functions. Again, these solutions occur either between
 $u_1$ and
 $u_2$ or between
 $u_3$ and
 $u_4$ but under the additional constraint that
 $u_3=u_4$ in the first case and
 $u_1=u_2$ in the second case. For
 $u_3 \le u \le u_4$,
 $u_1=u_2$ the solution is given by
 \begin{equation} u=u_3+\frac{u_4-u_3}{1+\dfrac{u_4-u_1}{u_3-u_1}\tan^{2} \theta}. \end{equation}
The nonlinear trigonometric solution (A14) has no analogue in KdV theory. When  $u_3 \to u_2 = u_1 \equiv \bar {u}$, the solution (A14) becomes an algebraic bright soliton described by
 \begin{equation} u = u_1 + \frac{u_4 - u_1}{1 + (u_4-u_1)^{2}\eta^{2}/4}, \end{equation}
with amplitude  $a=u_4-u_1= - 4\bar {u}$ and travelling at speed
 $U = 3u_1^{2}=3 \bar {u}^{2}$, which is the characteristic speed of the dispersionless mKdV equation. Dark algebraic solitons can be obtained by the transformation (A16) below.
The solution oscillating between  $u_1$ and
 $u_2$, can be obtained by applying the invariant transformation
 \begin{equation} u \to -u,\quad u_i \to -u_{5-i},\quad i=1,2,3,4. \end{equation}
In this region, both the exponential and algebraic soliton solutions have negative polarity with amplitude  $a=u_3-u_1$ and background
 $\bar {u}=u_3$ satisfying
 \begin{equation} a < \min(0,- 4 \bar{u}) . \end{equation}
In both cases, the soliton amplitude–speed relation is given by (A8). Heteroclinic kink solutions of mKdV do not exist if  $\mu <0$.
Appendix B. Characteristic velocities of the mKdV–Whitham modulation equations
The characteristic velocities  $W_i(\boldsymbol {\lambda })$ can be written as
 \begin{gather} \left.\begin{gathered} \mu < 0: \quad W_1 = U + \frac{2}{3}(r_3 - r_2)\frac{K(m)}{E(m)} \\ W_2 = U - \frac{2}{3}(r_2 - r_1)\frac{(1-m)K(m)}{E(m)-(1-m)K(m)} \\ W_3 = U + \frac{2}{3}(r_2 - r_1)\frac{K(m)}{E(m)-K(m)} \end{gathered}\right\} \end{gather}
 \begin{gather} \left.\begin{gathered} \mu > 0: \quad W_1 ={-}U - \frac{2}{3}(r_2 - r_1)\frac{K(m)}{E(m)-K(m)} \\ W_2 ={-}U + \frac{2}{3}(r_2 - r_1)\frac{(1-m)K(m)}{E(m)-(1-m)K(m)} \\ W_3 ={-}U - \frac{2}{3}(r_3 - r_2)\frac{K(m)}{E(m)}, \end{gathered}\right\} \end{gather}
where  $U=\frac {1}{3}(r_1 + r_2 + r_3)$,
 $m = (r_2 - r_1)/(r_3 - r_1)$ is the modulus,
 $0 \le m \le 1$, and
 $K(m)$ and
 $E(m)$ are complete elliptic integrals of the first and second kind, respectively. The parameters
 $r_1, r_2, r_3$ are related to the Riemann invariants
 $\lambda _1, \lambda _2, \lambda _3$ by
 \begin{equation} \left.\begin{gathered} \mu < 0: \quad r_1 = 3\lambda_3^{2},\quad r_2 = 3\lambda_2^{2},\quad r_3 = 3\lambda_1^{2};\\ \mu > 0: \quad r_1 ={-}3\lambda_1^{2},\quad r_2 ={-}3\lambda_2^{2},\quad r_3 ={-}3\lambda_3^{2}. \end{gathered}\right\} \end{equation}
The mapping  $\boldsymbol {r} \mapsto \boldsymbol {\lambda }$ specified by (B3) is multivalued, which implies that the mKdV modulation system (4.3) with characteristic velocities (B1), (B2) is neither strictly hyperbolic nor genuinely nonlinear in both cases
 $\mu <0$ and
 $\mu >0$. However, within the restricted subset in which
 $\lambda _j \ne 0$,
 $j = 1,2,3$, the mKdV modulation system is strictly hyperbolic and genuinely nonlinear. The relevant modulation solutions are subject to the ordering
 $\lambda _1 \leq \lambda _2 \leq \lambda _3$ and
 $r_1 \leq r_2 \leq r_3$ resulting from the ordering of the roots in the ODE potential curve (A1).
We note here that the expressions (B1), (B2) for the mKdV–Whitham characteristic velocities  $W_j(\boldsymbol {\lambda })$ are related to the characteristic velocities
 $V_j(\boldsymbol {r})$ of the diagonal KdV–Whitham system (Whitham Reference Whitham1965) as
 \begin{equation} \left.\begin{gathered} \mu < 0: \quad W_i(\boldsymbol{\lambda}) = V_{4-i}(\boldsymbol{r}), \\ \mu > 0: \quad W_i(\boldsymbol{\lambda}) ={-}V_{i}(\boldsymbol{r}). \end{gathered}\right\} \end{equation}
The quadratic transformations (B3) can be viewed as a modulation theory counterpart of the celebrated Miura transform (Miura Reference Miura1968).
We now obtain the soliton reduction of the mKdV–Whitham system. First, note that the soliton limit of the mKdV travelling wave solutions described in § 4 is achieved by letting either  $m_+ \to 1$ (
 $\mu >0$) or
 $m_- \to 1$ (
 $\mu <0$). Using the relations (4.4a–c), (B3), we find that both cases correspond to the limit
 $m \to 1$ in the respective modulation systems specified by (B1) (
 $\mu <0$) and (B2) (
 $\mu >0$).
For  $\mu >0$, bright soliton solutions occur when
 $u_1 \to u_2$, which coincides with
 $\lambda _2 \to \lambda _3$ by (4.4a–c). Furthermore,
 $r_2 \to r_3$ and
 $m \to 1$ in (B2), yielding the limiting characteristic velocities
 $$\begin{gather} W_1(\boldsymbol{\lambda}) = 3\lambda_1^{2}, \end{gather}$$
 $$\begin{gather}W_2(\boldsymbol{\lambda}) = \lambda_1^{2} + 2\lambda_3^{2} = W_3(\boldsymbol{\lambda}). \end{gather}$$