Introduction
The areas of the medial parieto-occipital cortex (mPOC)
The posterior parietal cortex (PPC) is traditionally considered as an association area at the interface between sensory and motor system. The PPC is not uniform but is functionally divided into subregions which are differently specialized, i.e., perform different functions. While the dorsolateral part of the PPC is well studied and its characterization as a “where/how” pathway involved in the control/planning of upper limb motor acts is relatively uncontroversial (e.g., Ungerleider & Mishkin, Reference Ungerleider and Mishkin1982; Goodale & Milner, Reference Goodale and Milner1992; Astafiev et al., Reference Astafiev, Shulman, Stanley, Snyder, Van Essen and Corbetta2003; Galati et al., Reference Galati, Committeri, Pitzalis, Pelle, Patria, Fattori and Galletti2011), less attention has been devoted to the dorsomedial part of the PPC, in particular to its caudal aspect (also called mPOC) whose processing nature is less clear.
Both in human and macaque, the mPOC is crossed by the parieto-occipital sulcus (POS), which runs downward as a deep cleft on the medial surface of the hemisphere, and joins the calcarine fissure below and behind the posterior end of the corpus callosum (Fig. 1). It marks the boundary between the cuneus and precuneus, and the parietal and occipital lobes. Evidence from both single unit and functional magnetic resonance imaging (fMRI) studies suggests that the POS contains regions important for visual motion and action. The mPOC is a crucial node of the dorsal visual stream and the origin of several pathways for visuospatial processing (Rizzolatti & Matelli Reference Rizzolatti and Matelli2003; Galletti et al., Reference Galletti, Fattori, Gamberini and Kutz2004; Kravitz et al., Reference Kravitz, Saleem, Baker and Mishkin2011). In macaque, this has long been known since the late nineties (Galletti et al., Reference Galletti, Fattori, Battaglini, Shipp and Zeki1996, Reference Galletti, Fattori, Gamberini and Kutz1999a,Reference Galletti, Fattori, Kutz and Gamberinib; see the article by Gamberini et al. in this issue), while in humans evidence has been accumulated only in recent years.
Anatomy of the medial wall in human and macaque brains. Medial views of human (left) and macaque (right) cortical surface reconstruction of the right hemisphere (RH). The cortical surface was defined at the gray–white matter border and has been partially inflated to reveal regions within the sulci (concavities, in dark gray) and on the gyri (convexities, in light gray). The cuneus and precuneus regions are color coded (green and yellow, respectively) as well as the main medial sulci: calcarine sulcus (magenta), POS (green), subparietal sulcus (yellow), and cingulate sulcus (blue). Modified from Pitzalis et al. (Reference Pitzalis, Fattori and Galletti2013b).

In monkeys, the POS contains two cytoarchitectonically and functionally distinct regions, V6 and V6A (Fig. 2A). Area V6 occupies the ventralmost part and fundus of the anterior bank of POS (Fig. 2A), which is a retinotopically organized area that represents the entire contralateral hemifield, and robustly responds to unidirectional motion (Fig. 2B,a; Galletti et al., Reference Galletti, Fattori, Battaglini, Shipp and Zeki1996; Reference Galletti, Fattori, Gamberini and Kutz1999a). Many V6 cells, called real-motion cells, strongly respond to the motion of a visual stimulus (Fig. 2B,a) but are unresponsive to the same retinal stimulation evoked by the movement of the eyes (Fig. 2B,b; Galletti & Fattori, Reference Galletti and Fattori2003). Area V6A occupies most of the anterior bank of the POS, in the caudalmost part of the superior parietal lobule (SPL) (Fig. 2A; Galletti et al., Reference Galletti, Fattori, Battaglini, Shipp and Zeki1996; Reference Galletti, Fattori, Kutz and Gamberini1999b), contains many arm movement-related cells (Fattori et al., Reference Fattori, Gamberini, Kutz and Galletti2001), whose activity is spatially tuned (Fig. 2C; Fattori et al., Reference Fattori, Kutz, Breveglieri, Marzocchi and Galletti2005) and is very sensitive to the orientation of the wrist (Fig. 2D; Fattori et al., Reference Fattori, Breveglieri, Marzocchi, Filippini, Bosco and Galletti2009a). Recently, macaque area V6A has been cytoarchitectonically subdivided into a ventral (V6Av) and a dorsal (V6Ad) portion (Fig. 2A; Luppino et al., Reference Luppino, Ben Hamed, Gamberini, Matelli and Galletti2005). The two portions of V6A have also shown functional differences, mainly in the sensory domain. V6Av contains a majority of visual cells with receptive fields that are mostly in the lower periphery; V6Ad, in contrast, shows a higher number of cells sensitive to somatic stimulation, and the visual cells mostly represent the central part of the visual field (Fig. 2E; Gamberini et al., Reference Gamberini, Galletti, Bosco, Breveglieri and Fattori2011).
Brain location and functional properties of macaque areas V6, V6Av, V6Ad. (A) Medial view of the posterior part of a LH to show the anatomical position of areas V6 (yellow), V6Av (dark violet), and V6Ad (light violet) in the anterior bank of the POS of a macaque brain (modified from Galletti et al., Reference Galletti, Fattori, Kutz and Gamberini1999b). (B) Real-motion cell recorded in area V6. The cell strongly responds (a) to the leftward movement of the visual stimulus (dark bar), whereas it do not respond (b) to the same visual stimulation of the receptive field evoked by the rightward movement of the eyes with the visual stimulus motionless. (C) Typical experimental setup used on monkey to test neuronal responsiveness to reaching movement, and response of a typical reaching neuron of area V6A to different directions of arm movement (Fattori et al., Reference Fattori, Kutz, Breveglieri, Marzocchi and Galletti2005). (D) Monkey experimental setup to test the modulating effect of wrist orientation, and response of a typical V6A neuron modulated by the orientation of the wrist (Fattori et al., Reference Fattori, Breveglieri, Marzocchi, Filippini, Bosco and Galletti2009a). (E) Visual field representation in V6Ad and V6Av, respectively (Gamberini et al., Reference Gamberini, Galletti, Bosco, Breveglieri and Fattori2011). About one thousand of visual receptive fields were used to plot the figure, and colors from blue to red indicate the density of receptive field overlap. To the right, data in E are shown overlapped to better recognize similarities and differences between the two sectors of V6A (Gamberini et al., Reference Gamberini, Galletti, Bosco, Breveglieri and Fattori2011).
In humans, our group has recently described the homologs of monkey V6 (Pitzalis et al., Reference Pitzalis, Galletti, Huang, Patria, Committeri, Galati, Fattori and Sereno2006; Reference Pitzalis, Sereno, Committeri, Fattori, Galati, Patria and Galletti2010, Reference Pitzalis, Strappini, De Gasperis, Bultrini and Di Russo2012, Reference Pitzalis, Bozzacchi, Bultrini, Fattori, Galletti and Di Russo2013a,Reference Pitzalis, Fattori and Gallettib,Reference Pitzalis, Sdoia, Bultrini, Committeri, Di Russo, Fattori, Galletti and Galatic), V6Av (Pitzalis et al., Reference Pitzalis, Sereno, Committeri, Fattori, Galati, Tosoni and Galletti2013d), and V6Ad (Tosoni et al., Reference Tosoni, Pitzalis, Committeri, Fattori, Galletti and Galati2014) by using a combination of fMRI methods such as wide-field retinotopy and task-evoked activity. In the following sections, we will first report a separate description of the main results achieved on human areas V6, V6Av, and V6Ad using each method, and then we will combine the evidence from macaque and human brain to suggest the possible functional role played by these three medial parieto-occipital areas.
Human area V6
Retinotopic mapping combined with fMRI allows the visual cortex to be charted with a precision unmatched elsewhere in the human brain, and not far short of that achievable in animals using invasive techniques. Using these brain mapping methods, a list of visual areas in the human brain have been identified (Watson et al., Reference Watson, Myers, Frakowiak, Hajnal, Woods, Mazziotta, Shipp and Zeki1993; Sereno et al., Reference Sereno, Dale, Reppas, Kwong, Belliveau, Brady, Rosen and Tootell1995, Reference Sereno, Pitzalis and Martinez2001; Tootell et al., Reference Tootell, Reppas, Kwong, Malach, Born, Brady, Rosen and Belliveau1995, Reference Tootell, Mendola, Hadjikhani, Ledden, Liu, Reppas, Sereno and Dale1997; DeYoe et al., Reference DeYoe, Carman, Bandettini, Glickman, Wieser, Cox, Miller and Neitz1996; McKeefry & Zeki, Reference McKeefry and Zeki1997; Tootell & Hadjikhani, Reference Tootell and Hadjikhani2001). In particular, the areas V1, V2, V3, VP, V3A, V4v, and middle temporal (MT)/V5 have been named in humans based on homologies with nonhuman primate areas (for review, see Sereno, Reference Sereno1998; Sereno & Tootell, Reference Sereno and Tootell2005). Until recently, two prominent omissions in this list were the human homologs of macaque areas V6 and V6A. Given the great emphasis for the periphery of these areas in the macaque, previous fMRI studies failed to activate areas V6 and V6A as they typically stimulated the central 8–12° of the visual field (e.g., Sereno et al., Reference Sereno, Dale, Reppas, Kwong, Belliveau, Brady, Rosen and Tootell1995, Reference Sereno, Pitzalis and Martinez2001; Tootell et al., Reference Tootell, Mendola, Hadjikhani, Ledden, Liu, Reppas, Sereno and Dale1997, Reference Tootell, Hadjikhani, Hall, Marrett, Vanduffel, Vaughan and Dale1998). Thus, despite some attempts, the discovery of these areas in the human brain was still lacking up to very recently.
We approached the delicate issue of finding the homolog of a monkey extrastriate visual area, which emphasizes the periphery (and de-emphasizes the center of the visual field) by implementing an innovative setup able to stimulate the entire visual field up to 110° in total visual extent (Pitzalis et al., Reference Pitzalis, Galletti, Huang, Patria, Committeri, Galati, Fattori and Sereno2006), simulating for the first time in the fMRI scanner, the conditions used in the study of monkey areas V6 and V6A. To increase the chance to find the human homolog of monkey V6, we combined wide-field retinotopic stimulation with high-field fMRI phase-encoded retinotopic stimuli slightly adjusted to respect the distinctive characteristics of these areas in macaque (Sereno et al., Reference Sereno, Dale, Reppas, Kwong, Belliveau, Brady, Rosen and Tootell1995; Tootell et al., Reference Tootell, Mendola, Hadjikhani, Ledden, Liu, Reppas, Sereno and Dale1997; for details, see Pitzalis et al., Reference Pitzalis, Galletti, Huang, Patria, Committeri, Galati, Fattori and Sereno2006).
Thanks to the wide-field retinotopic stimulation, we first mapped in a large sample of subjects the organization of human visual area V6 (Pitzalis et al., Reference Pitzalis, Galletti, Huang, Patria, Committeri, Galati, Fattori and Sereno2006). The results obtained from some exemplary subjects are reported in Fig. 3. Here, the periphery was stimulated the most completely (up to 110° total visual angle), and the signal obtained was strong and consistent in all visual areas. In Fig. 3, the inflated (A) and the flat (B) representations of the posterior portion of the left hemisphere (LH) of a representative subject indicate the typical position of the POS with respect to the calcarine sulcus on the medial wall of the hemisphere, and of the posterior intraparietal sulcus (pIPS) (see caption for details). Area V6 is located in the dorsalmost part of the human POS (see Fig. 3A) and represents the entire contralateral hemifield. The greatly enlarged mapping stimuli used here revealed the presence of a previously unidentified upper field representation unusually located in dorsal extrastriate cortex, where the other visual areas represent the peripheral lower visual field (Fig. 3C). This previously unidentified upper field representation is distinct from the ones in dorsal areas V3A and V7, which are located more laterally (Tootell et al., Reference Tootell, Mendola, Hadjikhani, Ledden, Liu, Reppas, Sereno and Dale1997; Tootell et al., Reference Tootell, Hadjikhani, Hall, Marrett, Vanduffel, Vaughan and Dale1998), and is located just anterior to peripheral V2/V3 lower representations. The organization and neighbor relations of this human area, confirmed also in the average map shown in Fig. 4 (V6, yellow outline), closely resemble those reported for macaque V6 (Galletti et al., Reference Galletti, Fattori, Battaglini, Shipp and Zeki1996, Reference Galletti, Fattori, Gamberini and Kutz1999a). Not only does the visual field representation in V6 of macaques and humans follows a common organization but also the same is true for the eccentricity profile of area V6 (Fig. 3D). The human area V6 contains a central representation of the visual field laterally and a peripheral representation of the visual field medially. This is in line with the macaque data, where the representation of the central 20 deg of the visual field is located at the lateral end of POS, and the most peripheral representation is at the medial end of POS. Eccentricity plots suggest that central and peripheral visual field representations have similar extents, as in macaque V6, but in contrast with all other known visual areas where central representation is highly prevalent (Galletti et al., Reference Galletti, Fattori, Gamberini and Kutz1999a). The analysis of isoeccentricity contours (shown in Pitzalis et al., Reference Pitzalis, Galletti, Huang, Patria, Committeri, Galati, Fattori and Sereno2006) reveals the presence of a foveal representation in the most lateral part of V6 (indicated by an asterisk in Fig. 3D), which stands apart from the foveal representations of areas V2 and V3, and also from the foveal representation of V3A, previously shown to be separated from foveal V2 and V3 (Tootell et al., Reference Tootell, Mendola, Hadjikhani, Ledden, Liu, Reppas, Sereno and Dale1997). Finally, visual field sign calculations (Sereno et al., Reference Sereno, Dale, Reppas, Kwong, Belliveau, Brady, Rosen and Tootell1995) show that V6 has a mirror-image representation of the visual field (Fig. 3E: yellow), like V1 and V3 (Pitzalis et al., Reference Pitzalis, Galletti, Huang, Patria, Committeri, Galati, Fattori and Sereno2006).
Wide-field retinotopic maps in human areas V6 and V6Av. (A) Inflated representation of the posterior portion of the LH of a representative subject indicating the position of the POS on the medial wall with respect to the calcarine sulcus and the pIPS. The cortical surfaces were defined at the gray–white matter border and have been inflated to reveal regions within the sulci (concavities, dark gray) as well as on the gyri (convexities, light gray). (B) Flat representation of the portion of the inflated brain inside the white box showing for reference the corresponding positions of these three sulci (POS, pIPS, and calcarine) on the flat map. The same part of the brain shown in the flat map (B) is shown in the close-up images from the LH rendered in C, D, and E. In A and B, the key sulci are indicated by dashed white lines. In sections B–C, yellow outlines and dotted white outlines indicate, respectively, location and borders of the human areas V6 (Pitzalis et al., Reference Pitzalis, Galletti, Huang, Patria, Committeri, Galati, Fattori and Sereno2006) and V6Av (Pitzalis et al., Reference Pitzalis, Sereno, Committeri, Fattori, Galati, Tosoni and Galletti2013d). (C) Polar angle maps of two participants. Color hue indicates the response phase, which is proportional to the polar angle of the local visual field representation. Red, blue, and green areas represent preference for upper, middle, and lower parts of the contralateral visual field, respectively. (D) Eccentricity maps. Figure shows color plots of the response to a wide-field ring stimulus expanding at a constant slow speed (about 1°/s) of two participants. The representation of central-through-more-peripheral eccentricities is coded using red-blue-green, respectively (see the inset, located at the upper right of each snapshot). Each inset indicates the maximal periphery, we were able to reach in that subject. The hue of the color at each cortical surface point again indicates the response phase, but now it is proportional to the eccentricity of the local visual field representation. The representations of the center of gaze are indicated by asterisks. Unlike V6, putative area V6Av lacks a representation of the center of gaze. (E) Maps of retinotopic field sign. Analysis of retinotopic data (polar angle and eccentricity) by visual field sign (mirror-image vs. nonmirror-image visual field representation) (Sereno et al., Reference Sereno, Dale, Reppas, Kwong, Belliveau, Brady, Rosen and Tootell1995). Mirror-image areas (yellow; e.g., V1) and nonmirror-image areas (blue; e.g., V2) are shown for two participants. The lower field representations of V1, V2, V3, V3A, and V7 (if any) are labeled along with V6 and V6Av. Note that while V6 contains a mirror-image representation, V6Av contains a nonmirror-image representation, like V2 and V3A, and opposite to V1 and V3. In all close-up images (C–E), only the dorsal stream is shown together with the borders of the dorsal visual areas identified in these subjects by retinotopic mapping (V1−, V2−, V3, V3A, V7; Sereno et al., Reference Sereno, Dale, Reppas, Kwong, Belliveau, Brady, Rosen and Tootell1995). On the flat map, dotted and solid white lines indicate vertical and horizontal meridians. POS, pIPs, posterior end of the intraparietal sulcus. Modified from Pitzalis et al. (Reference Pitzalis, Sereno, Committeri, Fattori, Galati, Tosoni and Galletti2013d).
Average polar angle maps rendered on the inflated LH and RH of the FreeSurfer “fsaverage” surface (rotated toward posterior view as in Fig. 3). Counterclockwise (CCW) and Clockwise (CW) polar angle scans were combined in each subject to cancel hemodynamic delay differences among areas and then vector-averaged across subjects using sulcus-based surface morphing. The yellow borders indicate the position of human area V6. The dotted borders indicate V6Av, an extra lower-field representation anterior and superior to V6. Horizontal and vertical meridians of average retinotopy in early visual areas are indicated by thick dashes and lines of small circles (PrCu, precuneus; other labels as in Fig. 3). Modified from Pitzalis et al. (2013d-V6A).
Overall, because of the similarity to macaque area V6 in terms of position, internal organization, and neighboring relations with V2, V3, and V3A (Galletti et al., Reference Galletti, Fattori, Gamberini and Kutz1999a; see the article by Gamberini et al. in this issue), we labeled this area “human V6” (Pitzalis et al., Reference Pitzalis, Galletti, Huang, Patria, Committeri, Galati, Fattori and Sereno2006; Fattori et al., Reference Fattori, Pitzalis and Galletti2009b).
Human area V6A: Ventral and dorsal subdivisions
After the retinotopic identification of the human area V6, we started to explore the cortical response to wide-field retinotopic stimuli in the territory around area V6. Specifically, we were interested in finding a retinotopic layout resembling that observed for macaque V6A. Our starting point was the original V6 study (Pitzalis et al., Reference Pitzalis, Galletti, Huang, Patria, Committeri, Galati, Fattori and Sereno2006), where we showed some preliminary data about the existence of an additional retinotopic region anterior to V6 representing the periphery of the lower visual field. More recently (Pitzalis et al., Reference Pitzalis, Sereno, Committeri, Fattori, Galati, Tosoni and Galletti2013d), we systematically investigated the retinotopic organization of this region using the same wide-field retinotopic mapping developed to map V6. The individual analyses of the polar angle data (see Fig. 3C) demonstrated the presence of an additional area (indicated with a dotted white outline) in the dorsal stream with a systematic representation of the contralateral lower visual field that is separated from the lower field in V6 by a vertical meridian. Comparing macaque single-unit data with human fMRI data, we suggested that this region actually corresponds to the ventral part of macaque V6A (namely V6Av), which responds to “low level” visual stimuli (like the flashing checkerboard rotating wedge used for the retinotopic mapping) and mostly represents the periphery of the lower, contralateral visual field. The location and retinotopic organization of area V6Av were confirmed also in the average map shown in Fig. 4, where the position and borders of V6Av are indicated by a dotted white outline. Indeed, the lower-field-only representation was located on the dorsalmost part of the POS, anterior to the lower-field representation of V6 (yellow outline) and medial to the peripheral lower field representation of area V3A. This lower-field-only representation was separated from the most posterior lower field in V6 by an intervening vertical meridian. The general organization of the V6A average maps closely parallels the individual data (Figs. 2 and 3).
In contrast to human V6, human V6Av lacks a representation of the center of gaze (Fig. 3D); it responds only to visual stimulation of the far periphery (starting from 30°). V6Av responds to a greater portion of periphery than even area V6. Analysis of eccentricity data shows that the more central representation of the area is located dorsolaterally and the most peripheral part ventromedially, close to the peripheral representation of V6. Visual field sign calculations show that V6Av has a nonmirror-image representation, like V2 and V3A but opposite to V1, V3, and V6 (Fig. 3E). It is located anterior to the mirror-V6 and just above (in the flat map) the nonmirror V3A, and is present bilaterally in all subjects. The retinotopic description of this new region is similar to that observed in the macaque V6Av, where Gamberini et al. (Reference Gamberini, Galletti, Bosco, Breveglieri and Fattori2011) described a clear over-representation of the periphery (Fig. 2E) as well as of the lower visual field adjoining posteriorly the lower visual field of V6.
Macaque area V6A is constituted also by a dorsal part (called V6Ad), located on the anterior bank of POS, at the border with V6Av (Fig. 2A; Luppino et al., Reference Luppino, Ben Hamed, Gamberini, Matelli and Galletti2005). In the human brain, we failed to find a retinotopic definition of area V6Ad. Despite the use of a wide-field retinotopy, we did not see convincing evidence of a systematic retinotopic organization in the cortical territory immediately anterior to V6Av. In fact, we found that, moving anterior to V6Av, the retinotopy in the individual polar angle maps (see Fig. 3C) was quite different in the left and right hemispheres and also inconsistent across sessions from the same subject (i.e., test and retest) and across subjects. Upper visual fields were found in a minority of subjects (30%). If present, upper fields were variably located either on the POS or on the posterior end of the IPS (labeled pIPS in the figures). In the latter case, it was sometimes not clearly separated from the upper field of V3A (suggesting it might belong to it), while in other cases it was separated from the upper field of V3A by a horizontal meridian. Note that the statistical procedure used for the average polar angle map (see Fig. 4) reduces noise in both visual and nonvisual cortical areas because the vector sum operation strongly penalizes voxels with inconsistent phase across subjects. In this analysis, the variable upper field activation sometimes found anterior to V6Av not unexpectedly disappeared. In contrast, the V6Av and V6 maps were found in exactly the same position showing that delay differences between subjects were small. The dorsal red spot observed in some cases was not consistent in the same way as V6 and V6Av and that is why we did not include it in the map.
In conclusion, we found sporadic retinotopic signs immediately anterior to V6Av but failed to find a systematic map that could be reliable considered the human homolog of area V6Ad. This negative result fits with the receptive field macaque data, which failed to find systematic retinotopic maps anterior to V6Av (Gamberini et al., Reference Gamberini, Galletti, Bosco, Breveglieri and Fattori2011). This nonretinotopic visual region might correspond to the dorsal part of macaque V6A, namely V6Ad. In the macaque V6Ad, a high percentage of the visual cells were “high-level” neurons activated only by complex and continuously changing visual stimulations (Galletti et al., Reference Galletti, Fattori, Kutz and Gamberini1999b; Gamberini et al., Reference Gamberini, Galletti, Bosco, Breveglieri and Fattori2011). The retinotopic mapping stimuli might be less effective for “high-level” neurons in a putative human V6Ad, and the fewer cells activated there would likely be activated by both central and peripheral stimuli, further weakening the phase-encoded BOLD signal, which effectively subtracts out nonretinotopic activations. This could explain why we did not find V6A activations from stimulating the central 30° and why the retinotopic mapping failed to find area V6Ad.
Comparative studies sometimes failed to find a rigorous match between macaque and human retinotopic regions. Indeed, new retinotopic areas in humans have been reported in regions (e.g., VIP+, Sereno & Huang, Reference Sereno and Huang2006; LIP+, Sereno et al., Reference Sereno, Pitzalis and Martinez2001) not thought to contain retinotopic maps as suggested by monkey data. But this is not the case for the region facing human area V6Av. Showing the signs of sporadic retinotopic signals, as we found anterior to V6Av, is different than demonstrating the presence of a specific retinotopic map, which survives unchanged across different subjects, hemispheres, and test/retest check. We did not find any systematic evidence of retinotopy immediately anterior to V6Av, consistent with macaque evidence found by Galletti and coworkers (Gamberini et al., Reference Gamberini, Galletti, Bosco, Breveglieri and Fattori2011). We are aware that recent studies have shown a continuous stream of retinotopy extending up to precuneus, and cingulate sulcus on the medial wall (Huang et al., Reference Huang, Chen, Tran, Holstein and Sereno2012; Huang & Sereno, Reference Huang and Sereno2013; Sereno et al., Reference Sereno, Lutti, Weiskopf and Dick2013), but there are no studies so far (including those quoted above) which explicitly linked those anterior retinotopic map to area V6A.
Given that a retinotopic definition seemed not viable for V6Ad, we have recently attempted at defining it functionally. Based on the evidence that macaque V6Ad contains a high number of reaching-related neurons (Gamberini et al., Reference Gamberini, Galletti, Bosco, Breveglieri and Fattori2011), we looked for a pointing-selective region situated anteriorly in the close proximity of V6Av (Tosoni et al., Reference Tosoni, Pitzalis, Committeri, Fattori, Galletti and Galati2014). We were aware that many areas in the monkey caudal SPL contain cells activated by arm movement (among them, not only the areas V6Av and V6Ad, but also areas PEc, MIP/PRR, and PE; Colby and Duhamel, Reference Colby and Duhamel1991; Andersen et al., Reference Andersen, Snyder, Bradley and Xing1997; Snyder et al., Reference Snyder, Batista and Andersen1997, Reference Snyder, Batista and Andersen1998, Reference Snyder, Batista and Andersen2000; Ferraina et al., Reference Ferraina, Battaglia-Mayer, Genovesio, Marconi, Onorati and Caminiti2001, Reference Ferraina, Brunamonti, Giusti, Costa, Genovesio and Caminiti2009; Breveglieri et al., Reference Breveglieri, Galletti, Gamberini, Passarelli and Fattori2006, Reference Breveglieri, Galletti, Monaco and Fattori2008; Gamberini et al., Reference Gamberini, Galletti, Bosco, Breveglieri and Fattori2011), so we were also aware that the finding of a reaching/pointing-selective cortical region in the human caudal SPL would not be indicative of the location and extent of human area V6Ad, but rather of the wide cortical region that includes all the areas containing arm-reaching neurons. In fact, many previous studies have found reaching/pointing-selective cortical regions anterior to the POS (Astafiev et al., Reference Astafiev, Shulman, Stanley, Snyder, Van Essen and Corbetta2003; Connolly et al., Reference Connolly, Andersen and Goodale2003; Tosoni et al., Reference Tosoni, Galati, Romani and Corbetta2008; Beurze et al., Reference Beurze, de Lange, Toni and Medendorp2009; Filimon et al., Reference Filimon, Nelson, Huang and Sereno2009; Cavina-Pratesi et al., Reference Cavina-Pratesi, Monaco, Fattori, Galletti and McAdam2010; Galati et al., Reference Galati, Committeri, Pitzalis, Pelle, Patria, Fattori and Galletti2011; Konen et al., Reference Konen, Mruczek, Montoya and Kastner2013). In some cases, however, the region was so large that it was evidently not restricted to the area V6Ad or to the whole area V6A. In other cases, the region was more restricted, and a homology between these functionally selected regions with monkey V6A was proposed (Tosoni et al., Reference Tosoni, Galati, Romani and Corbetta2008; Cavina-Pratesi et al., Reference Cavina-Pratesi, Monaco, Fattori, Galletti and McAdam2010; Galati et al., Reference Galati, Committeri, Pitzalis, Pelle, Patria, Fattori and Galletti2011). But in none of these papers, the authors could demonstrate that the activated region included V6Ad or that it was restricted to the area V6A.
To search for human V6Ad, we, therefore, used a different approach with respect to the previous studies. We used a combination of wide-field retinotopy (to define areas V6 and V6Av) and functional mapping. The functional mapping included a visual motion task (i.e., flowfields stimulus as in Pitzalis et al., Reference Pitzalis, Sereno, Committeri, Fattori, Galati, Patria and Galletti2010; see Fig. 5A,1) and a delayed pointing and saccadic task (involving wrist rotation designed to maximally activate the arm movement-related cells with spatial tuning in area V6A, as in Tosoni et al., Reference Tosoni, Galati, Romani and Corbetta2008, see Fig. 5A,2). We examined the cortical topography of BOLD activations specific for pointing versus saccadic movements in relation to the retinotopically defined human areas V6 and V6Av. The rationale of this approach was to recognize V6Av in a single subject, and then to prove that the region immediately anterior to V6Av shows different functional properties with respect to V6Av itself, as it is the case for V6Ad in the macaque.
Fig. 5A shows the retinotopically defined human areas V6 and V6Av (red and blue outlines, respectively) together with the group fMRI activation for pointing (relative to saccadic eye movements; green area) and for flowfields (relative to random motion; red area) superimposed on the atlas brain (see caption for details). As shown in Fig. 5A, the flowfields functional activation (red area) involved a cortical region that included areas V6 (red outline) and V6Av (blue outline), while preferential activation for pointing involved a long stripe of cortex (green area) in the medial parietal region localized anteriorly and dorsally to the retinotopic area V6Av. The critical issue here was to determine whether the selectivity for pointing versus saccades also occurred within the retinotopically defined V6 and V6Av or only anterior to these regions, i.e., within a putative V6Ad. A formal analysis of pointing- and saccade-induced activity within V6 and V6Av (Fig. 5B) showed that while V6 was almost silent to pointing and V6Av showed significantly greater responses to pointing versus baseline (as in Pitzalis et al., Reference Pitzalis, Sereno, Committeri, Fattori, Galati, Tosoni and Galletti2013d), selectivity for pointing relative to saccades was only found in anterior POS regions distinct from V6 and V6Av.
Functional definition of human area V6Ad. (A) Visual stimuli and task paradigms. (1) Visual motion experiment. The two frames of the ON phase show the two different types of coherent motion (radial and rotation–spiral motion) that switched almost every 500 ms and were compared with random motion presented during the OFF phase. For both radial and spiral motions, we tested both expansion and contraction components. (2) Pointing/saccade experiment. Subjects alternated blocks of memory delayed saccadic eye or hand pointing movements (involving wrist orientation) to peripheral visual targets with passive fixation blocks. (B) The BOLD contrasts between pointing and saccadic activity (pointing > saccades; green area) and between coherent dot fields and random dot fields (flowfields > random; red area) are superimposed over a posterior-medial view of the Conte69 atlas (Van Essen et al. Reference Van Essen, Glasser, Dierker, Harwell and Coalson2011). The two BOLD contrasts are rendered along with the borders of the associated putative V6Ad region (dark green) and the retinotopic V6 (red) and V6Av (blue) regions. (C) BOLD percent signal change for blocks of flowfields stimulation, saccadic eye movements, and hand pointing in the retinotopic V6 and V6Av, and the functionally defined V6Ad. Modified from Tosoni et al. (Reference Tosoni, Pitzalis, Committeri, Fattori, Galletti and Galati2014).
The above reported data clearly indicate that the cortical region anterior to V6Av showed different functional properties with respect to V6Av itself, and these properties were similar to those showed by the macaque V6Ad. However, in the macaque, even the cortical region bordering anteriorly V6Ad (including areas PEc and PE) shows these properties (limb movement activity; Sakata et al., Reference Sakata, Takaoka, Kawarasaki and Shibutani1973; Hyvarinen, Reference Hyvarinen1982; Lacquaniti et al., Reference Lacquaniti, Guigon, Bianchi, Ferraina and Caminiti1995; Ferraina et al., Reference Ferraina, Battaglia-Mayer, Genovesio, Marconi, Onorati and Caminiti2001; Breveglieri et al., Reference Breveglieri, Galletti, Gamberini, Passarelli and Fattori2006; Bremner and Andersen, Reference Bremner and Andersen2012), so, likely, the green region in Fig. 5A includes the human homologs of areas V6Ad, PEc, and PE. Since we had no hints how to determine the anterior limit of V6Ad, we defined as a putative V6Ad, a region that included the most posterior part of the pointing versus saccade map (dark green outline in the posterior part of the pointing vs. saccade green area in Fig. 5A). We arbitrarily decided to make the putative V6Ad about as large as V6 and V6Av including in this region all voxels in the map up to a maximum distance of 16 mm from the most posterior activation peak. Although we were aware that in this way the anterior border of V6Ad was set quite arbitrarily, this procedure enabled us to determine whether the functionally selected territory just anterior to V6Av, despite its vicinity to V6Av, showed different functional properties.
As displayed in Fig. 5B, the retinotopic areas V6 and V6Av and the newly defined putative V6Ad exhibited a gradient of functional specialization. While area V6 shows strong selectivity for coherent motion and greater BOLD responses to execution of eye movements relative to pointing movements, the most anterior V6Ad region showed the opposite behavior, i.e., weak responses to flowfields stimulation but strong selectivity for the execution of pointing movements involving wrist rotation. The anatomically intermediate area V6Av showed comparable BOLD responses to pointing and saccadic eye movements but stronger responses to flowfields stimulation with respect to the putative V6Ad. These findings showed that the three regions in the POC showed a gradient of functional specialization that follows a posterior-to-anterior axis, with the retinotopic area V6, localized posteriorly, specialized for visual analysis of coherent motion; the putative V6Ad region, localized anteriorly (and dorsally), specialized for execution of pointing movement (vs. saccadic eye movement); and the retinotopic V6Av region, spatially interposed between the two regions, with both significant but not selective visual and motor responses. This topographical arrangement of functional specialization exactly mirrors that observed in the macaque (Gamberini et al., Reference Gamberini, Galletti, Bosco, Breveglieri and Fattori2011).
In conclusion, in both macaque and human brains, there are two sectors within V6A, one more sensitive to visual stimulation, V6Av, bordering V6, and another just anterior to V6Av, V6Ad, less visually responsive but more strongly reach-related.
The results reviewed so far demonstrated the existence of the three distinct medial occipito-parietal areas located extremely close to each other on the POS: V6, V6Av, and V6Ad in the human brain. Fig. 6 shows the location and topography of the newly identified cortical areas V6, V6Av, and V6Ad together with other early visual areas mapped with wide-field retinotopic stimuli. As shown in the figure, the wide-field retinotopic stimuli used in the present study also revealed the actual size of striate and extrastriate areas, which appear larger than in previous brain mapping studies. Activation extends from the occipital lobe up to the precuneate surface to an extent not seen before with standard mapping stimuli. As displayed in Fig. 6, the three regions we identified (V6, V6Av, and V6Ad) are spatially adjacent along the POS, and their topographical localization follows a posterior-to-anterior axis, with the retinotopic area V6 located posteriorly, the pointing-selective area V6Ad anteriorly (and dorsally), and the retinotopic V6Av in an intermediate position.
Human V6, V6Av, and V6Ad together with other visual areas mapped with wide-field retinotopic stimuli. Maps of visual areas (in colors) shown in lateral and medial views of flattened (A), folded (B), and inflated (C) representations of a RH of a human subject. Light gray indicates gyri (convex curvature); dark gray indicates sulci (concave curvature). The area V6 (reported in green) adjoins the borders of the medialmost parts of dorsal V2, V3, and V3A. The area V6Av (reported in light blue) adjoins posteriorly the border of V6 and laterally those of areas V3A and/or V7. The area V6Ad (reported in orange) adjoins posteriorly the border of V6Av. The location and topography of the cortical areas were based on functional and anatomical MR tests of each subject. Main sulci have been labeled: central sulcus (CS); superior temporal sulcus (STS); POS. The fundus of CS, STS, POS, and calcarine is indicated with a dashed white line. Modified from Pitzalis et al. (Reference Pitzalis, Galletti, Huang, Patria, Committeri, Galati, Fattori and Sereno2006).
Comparison with macaque areas V6 and V6A
In various studies from our group, we reported that the anatomical position, neighbor relations, and functional properties of human V6 (e.g., Pitzalis et al., Reference Pitzalis, Galletti, Huang, Patria, Committeri, Galati, Fattori and Sereno2006, Reference Pitzalis, Sereno, Committeri, Fattori, Galati, Patria and Galletti2010, Reference Pitzalis, Strappini, De Gasperis, Bultrini and Di Russo2012, Reference Pitzalis, Bozzacchi, Bultrini, Fattori, Galletti and Di Russo2013a,Reference Pitzalis, Fattori and Gallettib,Reference Pitzalis, Sdoia, Bultrini, Committeri, Di Russo, Fattori, Galletti and Galatic), V6Av (Pitzalis et al., Reference Pitzalis, Sereno, Committeri, Fattori, Galati, Tosoni and Galletti2013d) and V6Ad (Tosoni et al., Reference Tosoni, Pitzalis, Committeri, Fattori, Galletti and Galati2014) closely resemble those reported for macaque V6 (Galletti et al., Reference Galletti, Fattori, Battaglini, Shipp and Zeki1996, Reference Galletti, Fattori, Gamberini and Kutz1999a), V6Av, and V6Ad (Galletti et al., Reference Galletti, Fattori, Kutz and Gamberini1999b; Gamberini et al., Reference Gamberini, Galletti, Bosco, Breveglieri and Fattori2011; see the article by Gamberini et al. in this issue).
Fig. 7 shows the similarities between human and macaque in anatomical position and neighbor relationships of the three areas. Fig. 7A shows the location of the three areas in a 3D semi-inflated human brain. The 3D reconstruction enables to properly position the new regions with respect to area V3A, which is anterolateral to V6 and posterolateral to V6Av. As in macaque (Fig. 7C), human V6, V6Av, and V6Ad are located within the POS and border one each other (Fig. 7A). Human V6 is located in the posterior wall of the dorsal end of POS, V6Av in the fundus of the dorsal end of POS, and V6Ad in the anterior bank of the dorsal end of POS. Fig. 7B shows the three areas on a flat map of the posterior portion of the brain together with other early visual areas mapped using wide-field retinotopic stimuli to show the neighbor relationships of the three areas. A comparison between the flattened maps in human (Fig. 7B) and monkey (Fig. 7D) brains emphasizes the similarity in the basic layout and neighbor relationships of the three areas across the two species. Notice that in both human and macaque, V6Av abuts on area V6 posteriorly, V3A laterally, and V6Ad anteriorly. A direct comparison between the 3D maps in Fig. 7A and 7C, however, shows that the brain location of these areas is not exactly the same: in human, the areas are located in the upper part of POS, whereas in monkey they are located in the caudal part of the precuneus. Interestingly, in both human and monkey, the location of V6, V6Av, and V6Ad follows the location of area V1 that changes between human and monkey (Fig. 8). While in monkey, V1 (area 17) occupies the entire occipital pole; in human, it is restricted within the calcarine sulcus. In other words, passing from monkey to human, there has been a posterior-around-to-medial movement of human V1 that brought this area from the occipital pole to within the calcarine sulcus. This cortical displacement has produced the effect of pushing the peripheries of areas 18 and 19 up and down with respect to the rims of calcarine sulcus, overflowing the calcarine cortex onto the medial wall (Fig. 8). Thus, V6 sits in a more superior position in humans because of the peripheral 18/19 “overflow” that pushes up the cortex, where V6, V6Av, and V6Ad are located. It is worthwhile to note that in spite of these changes in location, their neighbor relations on the unfolded surface remain essentially unchanged (Fig. 7B and 7D).
Brain location of areas V6 (yellow), V6Av (blue), and V6Ad (magenta) in humans (A and B) and macaque monkeys (C and D). A medial view of the inflated surface (left column) and a flat map of the posterior brain (right column) are shown. A and C show the typical topographical arrangement of areas V6, V6Av, and V6Ad along the POS. B and D show the spatial relationship among areas V6, V6Av, and V6Ad and other early visual areas. The recently defined human areas V6, V6Av, and V6Ad have spatial topographical arrangements that exactly mirror that in the macaque monkey. The location and topography of cortical areas are based on wide-field retinotopy and functional scans in humans and on retinotopic and functional properties of single neurons in monkeys (Gamberini et al., Reference Gamberini, Galletti, Bosco, Breveglieri and Fattori2011). Light and dark gray indicate gyri and sulci. Main labeled sulci: Cal, calcarine; POS; Cin, cingulate sulcus; IPS, intraparietal sulcus; STS. Modified from Pitzalis et al. (Reference Pitzalis, Sereno, Committeri, Fattori, Galati, Tosoni and Galletti2013d).
Brodmann's parcellation in human and macaque brains. Medial views of human (left) and macaque (right) brains (RH), showing the Brodmann's parcellation of the cortical surface (Brodmann, Reference Brodmann1909). Areas 18 and 19 are color coded (purple and green, respectively). The location of areas V6, V6Av, and V6Ad is indicated by red arrows on both brains.
Comparison with previous human studies
Before the finding of human area V6 by our group (Pitzalis et al., Reference Pitzalis, Galletti, Huang, Patria, Committeri, Galati, Fattori and Sereno2006), there have been some attempts by other group to define the homolog of macaque V6 in the human brain. These previous studies ended up finding a human “V6-complex” defined on functional criteria, which likely included both areas V6 and V6A. Neuroimaging using positron emission tomography and fMRI showed POS involvement in humans during visual motion perception (Sereno et al., Reference Sereno, Pitzalis and Martinez2001; Dechent & Frahm, Reference Dechent and Frahm2003), visuospatial attention (Simon et al., Reference Simon, Mangin, Cohen, Le Bihan and Dehaene2002), and visuomotor control (de Jong et al., Reference de Jong, van der Graaf and Paans2001; Simon et al., Reference Simon, Mangin, Cohen, Le Bihan and Dehaene2002). Because of the reminiscence of V6 and V6A location in the monkey brain, more ventral activity was labeled as putative V6 and more dorsal activity as putative V6A (de Jong et al., Reference de Jong, van der Graaf and Paans2001; Simon et al., Reference Simon, Mangin, Cohen, Le Bihan and Dehaene2002; Dechent & Frahm, Reference Dechent and Frahm2003), but none of these data demonstrated the homology with the macaque cortical areas. As reported above, in 2006, we demonstrated (Pitzalis et al., Reference Pitzalis, Galletti, Huang, Patria, Committeri, Galati, Fattori and Sereno2006) that what we called V6 in the human brain is indeed the homolog of monkey V6 because it represents the entire contralateral visual hemifield, from the fovea to the far periphery, it includes a medially located ‘‘upper’’ field representation distinct from the upper-field representation in the nearby area V3A, it represents the fovea laterally, it emphasizes the visual periphery, and finally its spatial relationships with neighboring areas V2, V3, and V3A were the same as described in macaque monkey.
Since our discovery of human area V6 by retinotopic mapping (Pitzalis et al., Reference Pitzalis, Galletti, Huang, Patria, Committeri, Galati, Fattori and Sereno2006), the subsequent retinotopic studies on the same topic have been substantially confirmatory of our main results (e.g., Cardin & Smith, Reference Cardin and Smith2010; Arnoldussen et al., Reference Arnoldussen, Goossens and van den Berg2011; Cardin et al., Reference Cardin, Hemsworth and Smith2012), and no controversial issue has been raised about it.
While there are no detailed studies of retinotopy on human V6A, apart from Pitzalis et al. (Reference Pitzalis, Sereno, Committeri, Fattori, Galati, Tosoni and Galletti2013d), a number of other neuroimaging studies have reported that the mPOC responds to pointing (Simon et al., Reference Simon, Mangin, Cohen, Le Bihan and Dehaene2002; Astafiev et al., Reference Astafiev, Shulman, Stanley, Snyder, Van Essen and Corbetta2003; Connolly et al., Reference Connolly, Andersen and Goodale2003; Tosoni et al., Reference Tosoni, Galati, Romani and Corbetta2008) as well as to reaching and grasping movements (Beurze et al., Reference Beurze, de Lange, Toni and Medendorp2007, Reference Beurze, de Lange, Toni and Medendorp2009; Filimon et al., Reference Filimon, Nelson, Hagler and Sereno2007, Reference Filimon, Nelson, Huang and Sereno2009; Cavina-Pratesi et al., Reference Cavina-Pratesi, Monaco, Fattori, Galletti and McAdam2010; Vesia et al., Reference Vesia, Prime, Yan, Sergio and Crawford2010; Galati et al., Reference Galati, Committeri, Pitzalis, Pelle, Patria, Fattori and Galletti2011; Gallivan et al., Reference Gallivan, McLean, Smith and Culham2011; Konen et al., Reference Konen, Mruczek, Montoya and Kastner2013). Electrophysiological studies have demonstrated electroencephalogram (EEG) activity in the medial parietal cortex in response to reaching movements (e.g., Bozzacchi et al., Reference Bozzacchi, Giusti, Pitzalis, Spinelli and Di Russo2012a,Reference Bozzacchi, Giusti, Pitzalis, Spinelli and Di Russob, Reference Bozzacchi, Spinelli, Pitzalis, Giusti and Di Russo2014).
Although it is well established that pointing execution involves activation of medial parietal cortex, it lacks an objective way to exactly locate and delimitate the cortical regions that are activated in these tasks. One difficulty in summarizing the data from different studies is the large variety of areal names attributed by different authors to their own medial parietal activations. Some previous studies have reported two distinct activation foci for both pointing and reaching movements in the medial parietal cortex: one anterior, along the IPS, and another posterior, in the vicinity of the POS (preCUN and PO in Fig. 2, Beurze et al., Reference Beurze, de Lange, Toni and Medendorp2007; aPCU and sPOS in Fig. 3, Filimon et al., Reference Filimon, Nelson, Huang and Sereno2009; aPRR and pPRR in Fig. 2, Tosoni et al., Reference Tosoni, Galati, Romani and Corbetta2008; MD and MP in Fig. 4, Galati et al., Reference Galati, Committeri, Pitzalis, Pelle, Patria, Fattori and Galletti2011; anterior superior parieto-occipital cortex (aSPOC) and posterior superior parieto-occipital cortex (pSPOC) in Fig. 5, Cavina-Pratesi et al., Reference Cavina-Pratesi, Monaco, Fattori, Galletti and McAdam2010). Other studies have reported one large activation region encompassing both foci (the human parietal reach region, hPRR in Fig. 2, Connolly et al., Reference Connolly, Andersen and Goodale2003).
A question arises about the relationship between the two functionally defined medial parietal reaching areas found in previous studies and the human homologs of macaque areas V6, V6Av, and V6Ad as defined retinotopically and functionally by our lab (Pitzalis et al., Reference Pitzalis, Galletti, Huang, Patria, Committeri, Galati, Fattori and Sereno2006, Reference Pitzalis, Sereno, Committeri, Fattori, Galati, Tosoni and Galletti2013d; Tosoni et al., Reference Tosoni, Pitzalis, Committeri, Fattori, Galletti and Galati2014). Given the different trend in functional properties found in Pitzalis et al. (Reference Pitzalis, Sereno, Committeri, Fattori, Galati, Tosoni and Galletti2013d) between these three areas, a possible hypothesis is that the human V6Av as retinotopically defined in Pitzalis et al. (Reference Pitzalis, Sereno, Committeri, Fattori, Galati, Tosoni and Galletti2013d) corresponds to the posterior reaching regions described in the other studies (PO: Beurze et al., Reference Beurze, de Lange, Toni and Medendorp2007; pPRR: Tosoni et al., Reference Tosoni, Galati, Romani and Corbetta2008; sPOS: Filimon et al., Reference Filimon, Nelson, Huang and Sereno2009; SPOC: Gallivan et al., Reference Gallivan, Cavina-Pratesi and Culham2009; pSPOC: Cavina-Pratesi et al., Reference Cavina-Pratesi, Monaco, Fattori, Galletti and McAdam2010; MP: Galati et al., Reference Galati, Committeri, Pitzalis, Pelle, Patria, Fattori and Galletti2011; Rossit et al., Reference Rossit, McAdam, McLean, Goodale and Culham2013), while human V6Ad as functionally defined in Tosoni et al. (Reference Tosoni, Pitzalis, Committeri, Fattori, Galletti and Galati2014) corresponds to the anterior reaching regions (preCUN: Beurze et al., Reference Beurze, de Lange, Toni and Medendorp2007; aPRR: Tosoni et al., Reference Tosoni, Galati, Romani and Corbetta2008; aPCU: Filimon et al., Reference Filimon, Nelson, Huang and Sereno2009; aSPOC: Cavina-Pratesi et al., Reference Cavina-Pratesi, Monaco, Fattori, Galletti and McAdam2010; MD: Galati et al., Reference Galati, Committeri, Pitzalis, Pelle, Patria, Fattori and Galletti2011). Being human V6, a motion sensitive region silent during reaching movements (Pitzalis et al., Reference Pitzalis, Sereno, Committeri, Fattori, Galati, Tosoni and Galletti2013d; Tosoni et al., Reference Tosoni, Pitzalis, Committeri, Fattori, Galletti and Galati2014), it should not be a part of this large human parietal reach region. Note, however, that we think that not all the anterior reaching regions described in the other studies (i.e., PreCUN/aPCU/aPRR/MD/aSPOC) can be similarly considered equivalent to V6Ad. Some of these regions (PreCUN/aPCU/aPRR) are extremely large cortical territory extending far anteriorly and “likely” including (in their posterior part) also V6Ad. Since V6Ad appears to only extend into the posterior part of the precuneus, we think that it can be more reasonably compared only to aSPOC and MD.
An alternative hypothesis has been suggested by Cavina-Pratesi et al. (Reference Cavina-Pratesi, Monaco, Fattori, Galletti and McAdam2010). In their view, the posterior reaching region (pSPOC) likely corresponds to the human V6 as defined by (Pitzalis et al., Reference Pitzalis, Galletti, Huang, Patria, Committeri, Galati, Fattori and Sereno2006). Consequently, the anterior reach region (aSPOC) would correspond to area V6Av. This would explain the absence of a grip response they found in aSPOC (which contrasts with the presence in macaque area V6A of neurons encoding specific wrist orientations—Fattori et al., Reference Fattori, Breveglieri, Marzocchi, Filippini, Bosco and Galletti2009a and grip postures—Monaco et al., Reference Monaco, Cavina-Pratesi, Sedda, Fattori, Galletti and Culham2011), given the less sensitivity to reaching found in human V6Av with respect to V6Ad (Tosoni et al., Reference Tosoni, Pitzalis, Committeri, Fattori, Galletti and Galati2014). Moreover, in support of this view, they found that pSPOC (like macaque V6) shows a certain degree of sensitivity to visual stimulation (more than to the arm transport), and these properties are more consistent with earlier visual areas. The anatomical location of human V6 is also apparently consistent with that they found for pSPOC.
There is, however, several evidence which militate against the hypothesis suggested by Cavina-Pratesi et al. (Reference Cavina-Pratesi, Monaco, Fattori, Galletti and McAdam2010). First, the absence of a grip response in aSPOC (Cavina-Pratesi et al., Reference Cavina-Pratesi, Monaco, Fattori, Galletti and McAdam2010) cannot be taken as a positive evidence for homology because in monkey, V6Av contains grasping neurons as well as V6Ad. Second, if aSPOC does not respond to grasping because it corresponds to human V6Av that very recently was found to have less sensitivity to reaching with respect to V6Ad (Tosoni et al., Reference Tosoni, Pitzalis, Committeri, Fattori, Galletti and Galati2014), then they would have found a region anterior to aSPOC responding to grasping, but this is not the case. Third, the sensitivity found in pSPOC for the visual stimulation fits also well with the hypothesis that it corresponds to V6Av (which contains a majority of visual cells) instead of to V6. For all these reasons, we are more in favor of the hypothesis that the two medial parietal reaching areas correspond to the two sectors of V6A.
Beside these speculations, the bottom line is that without further evidence it is not possible to rigorously establish the relationship between areas found using strict retinotopic criteria (as V6 and V6Av) and/or a combination of retinotopy and task-evoked fMRI activity (as V6Ad) and the functionally defined motion and reaching regions found in other fMRI studies, whose location and extent depend on the task and the parameters used to acquire and analyze the data. Retinotopic mapping is demanding and time consuming, and we know that only few fMRI labs are equipped for it. However, while so far there is not a functional localizer for areas V6Av and V6Ad, human V6 can be easily mapped by a functional localizer, as suggested by our group as well as other groups (Pitzalis et al., Reference Pitzalis, Sereno, Committeri, Fattori, Galati, Patria and Galletti2010; Cardin & Smith, Reference Cardin and Smith2010). Future studies using the V6 functional localizer are needed to verify the spatial relationship of the functionally defined motion and reaching regions at least with V6.
Comparative lesion-based studies
The results reviewed so far confirm that the POS contains two regions important for visual motion and action, namely V6 and V6A, respectively. Evidence of this comes not only from single unit and fMRI studies but also from lesion-based analysis.
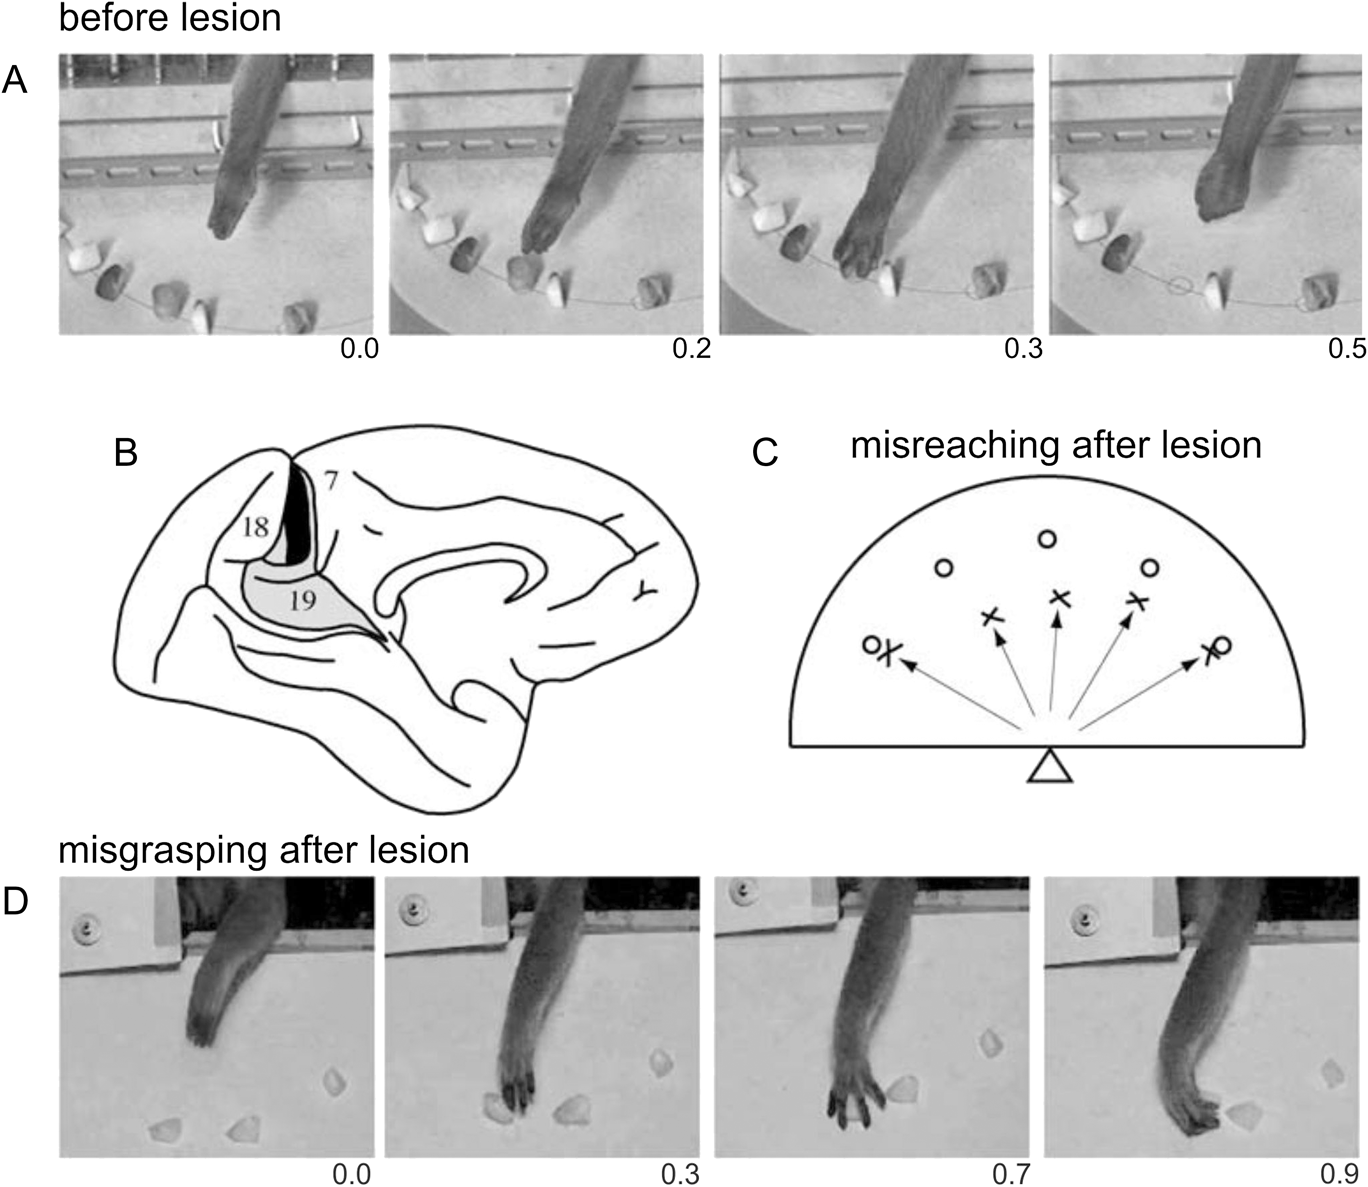
The literature on clinical studies following lesions of the dorsal stream is rich of studies on optic ataxia, which is the typical neuropsychological deficit linking vision to action (“how” pathway, Goodale & Milner, Reference Goodale and Milner1992). Indeed, these patients have lesions in the superior parieto-occipital junction and show misreaching in visually guided movements (Balint, Reference Balint1909; Ratcliff & Davies-Jones, Reference Ratcliff and Davies-Jones1972; Perenin & Vighetto, Reference Perenin and Vighetto1988). Besides misreaching, optic ataxia patients also exhibit deficits in adjusting hand orienting (Perenin & Vighetto, Reference Perenin and Vighetto1988) and shaping (Jeannerod, Reference Jeannerod1986; Jakobson et al., Reference Jakobson, Archibald, Carey and Goodale1991) during prehension of objects under visual guidance. It has been hypothesized that optic ataxia reflects a failure to transform retinal information into appropriate spatiomotor coordinates for action (e.g., Buxbaum & Coslett, Reference Buxbaum and Coslett1997), and that this failure is due to the fact that the brain damage involves the human cortical territory of area V6A (Galletti et al., Reference Galletti, Battaglini and Fattori1993, Reference Galletti, Battaglini and Fattori1995, Reference Galletti, Fattori, Kutz and Battaglini1997a,Reference Galletti, Battaglini and Fattorib; Galletti & Fattori, Reference Galletti, Fattori, Karnath, Milner and Vallar2002). In agreement with this hypothesis, brain lesions restricted to area V6A in monkey produce misreaching with the arm contralateral to the lesion in visually guided movements (Fig. 9C; Battaglini et al., Reference Battaglini, Muzur, Galletti, Skrap, Brovelli and Fattori2002). The misreaching observed after V6A lesion is congruent with the functional characteristics of single V6A cells, which are modulated by the direction of arm movement (Fattori et al., Reference Fattori, Kutz, Breveglieri, Marzocchi and Galletti2005) as well as the depth of reaching movement (Hadjidimitrakis et al., Reference Hadjidimitrakis, Bertozzi, Breveglieri, Bosco, Galletti and Fattori2014). Lesions of V6A in monkey also produce deficits in wrist orientation and grasping movements (Battaglini et al., Reference Battaglini, Muzur, Galletti, Skrap, Brovelli and Fattori2002). As shown in frame D in Fig. 9, when grasping a piece of food on a plate, the monkey with V6A lesion widened the grip aperture too much, delayed the grip of the object, and rotated the hand abnormally, so that the fingers closed laterally rather than downwards. Like to misreaching, also the misgrasping observed after V6A lesion is congruent with the functional characteristics of single V6A cells. In fact, area V6A contains cells modulated by wrist rotation, cells active only during grasping movements when the animal picks up pieces of food and cells with a somatosensory receptive field located on the distal part of the arm, particularly on the hand (Galletti et al., Reference Galletti, Fattori, Gamberini and Kutz2004). Given the similarities of impairments observed in monkey after selective V6A lesions (Battaglini et al., Reference Battaglini, Muzur, Galletti, Skrap, Brovelli and Fattori2002) and in optic ataxia patients (e.g., Perenin & Vighetto, Reference Perenin and Vighetto1988), Galletti et al. (Reference Galletti, Fattori, Gamberini and Kutz2004) suggested that human and monkey SPL are homologous structures and suggest that most of the deficits observed in optic ataxia patients are the result of the lesion of a human area V6A. Further lesion studies on optic ataxia lend support to this view. Karnath and Perenin (Reference Karnath and Perenin2005) found optic ataxia associated with a lesion overlap that affected the lateral cortical convexity at the occipito-parietal junction and that extended in both hemispheres to the medial cortical aspect, where it affected the precuneus close to the occipito-parietal junction (where we now know that human V6A area is located, Pitzalis et al., Reference Pitzalis, Sereno, Committeri, Fattori, Galati, Tosoni and Galletti2013d; Tosoni et al., Reference Tosoni, Pitzalis, Committeri, Fattori, Galletti and Galati2014).
Fig. 8A–8D Misreaching and misgrasping after lesion of monkey area V6A. (A) Frames from a digital TV camera illustrating the behavior of a normal animal in reaching and grasping food. Time below frames is in seconds. (B) Reconstruction of location and extent of the brain damage in case V6M2 of Battaglini et al. (Reference Battaglini, Muzur, Galletti, Skrap, Brovelli and Fattori2002). The lesion is indicated on the silhouette of monkey brain reported by Brodmann (Reference Brodmann1909), adapted in size to match the brain of the monkey reported by Battaglini et al. (Reference Battaglini, Muzur, Galletti, Skrap, Brovelli and Fattori2002). The lesion was bilateral, but here is reported (in black) only the lesion in the LH; that in the RH was very similar in location and extent (see Battaglini et al., Reference Battaglini, Muzur, Galletti, Skrap, Brovelli and Fattori2002). Dorsal area 19 is shown in gray; its location and extent, as well as locations of areas 18 and 7, are according to Brodmann (Reference Brodmann1909). (C) Misreaching after bilateral V6A lesion. Food (raisins) was distributed on a semicircular plate placed horizontally in front of the animal, as shown in the frames at the top of the figure. The plate is seen here from above, and the position of the monkey is indicated by the triangle. Open circles indicate food locations. Crosses indicate the locations where the hand landed in the first attempt to reach the food. (D) Frames from a video camera illustrating the anomalous rotation of the wrist that led the fingers to close laterally rather than downward. Time below frames is in seconds. Modified from Galletti and Fattori (Reference Galletti and Fattori2003).
Although the majority of lesion studies was focused on misreaching deficit in optic ataxia patients, there is also few clinical evidence on misperception of visual motion following dorsal POS lesions. It has been reported that lesions or electrical stimulation of the cortex of human POS produce motion-related visual disturbance (e.g., Heide et al., Reference Heide, Koenig and Dichgans1990; Richer et al., Reference Richer, Martinez, Cohen and Sthilaire1991; Blanke et al., Reference Blanke, Landis, Mermoud, Spinelli and Safran2003), and epileptic seizures within the precuneus produce linear self-motion perception (Wiest et al., Reference Wiest, Zimprich, Prayer, Czech, Serles and Baumgartner2004). Also, Blanke and coworkers reported that cortical lesions in the dorsal part of human POS, approximately around the location of human area V6 (Pitzalis et al., Reference Pitzalis, Galletti, Huang, Patria, Committeri, Galati, Fattori and Sereno2006), cause motion recognition deficits (Blanke et al., Reference Blanke, Landis, Mermoud, Spinelli and Safran2003). Fig. 10 reports the data of this study on patients with parieto-occipital lesions. The study reported that patients whose lesions were focused around the POS showed motion blindness, i.e., a selective disturbance of visual motion perception, despite intact perception of other features of the visual scene. These patients were completely unable to discriminate the direction of motion of visual stimuli, and the authors speculated that a loss of direction selective neurons could be the reason of that deficit (Blanke et al., Reference Blanke, Landis, Mermoud, Spinelli and Safran2003). This is in line with the view that lesions in motion-blind patients do involve the human homolog of monkey area V6, since this latter has a plenty of direction selective cells as well as cells able to recognize the “real movement” in the visual field (Galletti & Fattori, Reference Galletti and Fattori2003).
Loss of the ability to detect motion direction in human patients lesioned in the POS. Figure shows the lesion analysis (overlap plots) of patients with (group A, top) and without (group B, bottom) direction-selective motion blindness as reported in Blanke et al. (Reference Blanke, Landis, Mermoud, Spinelli and Safran2003). The number of overlapping lesions is indicated by color, from blue (n = 1) to red (n = 6). The center of overlap is indicated in red for both group patients. The Talairach coordinates of the transverse sections are given in the middle of the figure (z-coordinates). In motion-blind patients, two centers of overlap were found, one at the temporo-occipital junction (red arrow) and the other in the PPC (yellow arrow). Both overlap areas were anatomically distinct from the center of overlap in patients from group B localized on the cuneus and lingual gyrus (green arrow) and able to see motion. Lesions inducing motion blindness are centered on two cortical regions located in or near the brain location of area MT/V5 and in or near the brain location of V6. Modified from Blanke et al. (Reference Blanke, Landis, Mermoud, Spinelli and Safran2003).
Functional roles of human areas V6 and V6A
The different functional profile of areas V6 and V6A reviewed above and their anatomical positions suggests that they likely perform different functions within an integrated network aimed at subserving sensory-motor integration in the human mPOC.
All the recent neuroimaging results from our study and other studies have demonstrated that human V6 is a medial motion area involved in estimation of egomotion (Cardin & Smith, Reference Cardin and Smith2010, Reference Cardin and Smith2011; Pitzalis et al., Reference Pitzalis, Sereno, Committeri, Fattori, Galati, Patria and Galletti2010, Reference Pitzalis, Strappini, De Gasperis, Bultrini and Di Russo2012, Reference Pitzalis, Bozzacchi, Bultrini, Fattori, Galletti and Di Russo2013a,Reference Pitzalis, Fattori and Gallettib,Reference Pitzalis, Sdoia, Bultrini, Committeri, Di Russo, Fattori, Galletti and Galatic; Fischer et al., Reference Fischer, Bulthoff, Logothetis and Bartels2012). Additionally, area V6 has a strong response to translational egomotion (Pitzalis et al., Reference Pitzalis, Sereno, Committeri, Fattori, Galati, Patria and Galletti2010, Reference Pitzalis, Fattori and Galletti2013b,Reference Pitzalis, Sdoia, Bultrini, Committeri, Di Russo, Fattori, Galletti and Galatic) which suggests that this area processes visual egomotion signals to extract information about the relative distance of objects, likely in order to act on them, or to avoid them (see also Cardin et al., Reference Cardin, Hemsworth and Smith2012). Given this emphasis on objects, a possibility is that V6 is involved in “subtracting out” self-motion signals across the whole visual field for the purpose of flow parsing—the separation of object motion from self-motion (Warren & Rushton, Reference Warren and Rushton2009)—as already suggested by our group (Galletti & Fattori, Reference Galletti and Fattori2003; Pitzalis et al., Reference Pitzalis, Sereno, Committeri, Fattori, Galati, Patria and Galletti2010, Reference Pitzalis, Fattori and Galletti2013b) as well as by other authors (Cardin et al., Reference Cardin, Hemsworth and Smith2012). The segregation of these two types of motion is essential both for the avoidance of obstacles and for planning the handling of nearby objects. Notice that this motion segregation has been shown to use optic flow as well as local motion signals (Warren & Rushton, Reference Warren and Rushton2009), i.e., the signals encoded in V6. From V6, visual information would reach bimodal visual/somatosensory areas in the SPL (areas V6A and MIP; Galletti et al., Reference Galletti, Gamberini, Kutz, Fattori, Luppino and Matelli2001) that are able to encode visual space and arm reaching movement (Colby & Duhamel, Reference Colby and Duhamel1991; Galletti & Fattori, Reference Galletti, Fattori, Karnath, Milner and Vallar2002; Galletti et al., Reference Galletti, Fattori, Gamberini and Kutz2004). Thus, even though area V6 is not directly involved in the control of arm movement, the ability of V6 cells to recognize the “real movement” in the visual field (see Fig. 2B; Galletti & Fattori, Reference Galletti and Fattori2003) and to encode the direction of movement of objects (Galletti et al., Reference Galletti, Fattori, Battaglini, Shipp and Zeki1996) could be useful to encode the continuously changing spatial location of moving objects, providing the spatial coordinates of moving targets to the controllers of arm reaching movements as area V6A.
In macaque, there is evidence that both V6Ad and V6Av are involved in analyzing the basic features of the visual world and in monitoring reach-to-grasp actions (Gamberini et al., Reference Gamberini, Galletti, Bosco, Breveglieri and Fattori2011). The somatosensory information is more powerful in driving arm-related responses in V6Ad, and visual information is more powerful in driving arm-related responses in V6Av. Both sectors of V6A have the basic machinery necessary to analyze stationary and moving visual stimuli. V6Ad (responding mainly to the central visual field) would be involved in the control of the final part of prehension, when the hand approaches the object of interest and interacts with it. Conversely, the over-representation of the periphery in V6Av, particularly the medial lower visual field (found also in humans, see Pitzalis et al., Reference Pitzalis, Sereno, Committeri, Fattori, Galati, Tosoni and Galletti2013d), agrees with the view that this sector of V6A is involved in the visual analysis of the transport phase of reach-to-grasp action. In fact, the medial lower visual field is the part of the visual field traversed by the arm on the way to reach an object to be grasped.
In light of all the macaque and human evidence reviewed above, we recently suggested that information on objects in depth which are translating in space, because of the self-motion, is processed in V6 and conveyed to V6A for evaluating object distance in a dynamic condition such as that created by self-motion, so to orchestrate the eye and arm movements necessary to reach or avoid static and moving objects in the environment (Pitzalis et al., Reference Pitzalis, Bozzacchi, Bultrini, Fattori, Galletti and Di Russo2013a,Reference Pitzalis, Fattori and Gallettib,Reference Pitzalis, Sdoia, Bultrini, Committeri, Di Russo, Fattori, Galletti and Galatic,Reference Pitzalis, Sereno, Committeri, Fattori, Galati, Tosoni and Gallettid). With its anatomical position and functional properties, area V6Av could represent a critical region for bridging the visual functions of V6 and the arm-related functions of V6Ad to support abilities such as the grasp of moving or static objects embedded in dynamic environments.
Conclusions
In a series of brain mapping studies, we mapped human areas V6 (Pitzalis et al., Reference Pitzalis, Galletti, Huang, Patria, Committeri, Galati, Fattori and Sereno2006) and V6Av (Pitzalis et al., Reference Pitzalis, Sereno, Committeri, Fattori, Galati, Tosoni and Galletti2013d) retinotopically and defined human V6Ad functionally as a pointing-selective region situated anteriorly in the close proximity of V6Av (Tosoni et al., Reference Tosoni, Pitzalis, Committeri, Fattori, Galletti and Galati2014). Like in macaque, human V6 is a motion area (e.g., Pitzalis et al., Reference Pitzalis, Sereno, Committeri, Fattori, Galati, Patria and Galletti2010, Reference Pitzalis, Strappini, De Gasperis, Bultrini and Di Russo2012, Reference Pitzalis, Bozzacchi, Bultrini, Fattori, Galletti and Di Russo2013a,Reference Pitzalis, Fattori and Gallettib,Reference Pitzalis, Sdoia, Bultrini, Committeri, Di Russo, Fattori, Galletti and Galatic), while V6Av and V6Ad respond to pointing movements (Tosoni et al., Reference Tosoni, Pitzalis, Committeri, Fattori, Galletti and Galati2014). We suggest that, like in the monkey, V6Av is involved in the visual analysis of the transport phase of reach-to-grasp action and V6Ad in the control of the final part of hand movement, when the hand approaches the object of interest and interacts with it. The retinotopic organization (when present), anatomical position, neighbor relations, and functional properties of these three areas closely resemble those reported for macaque V6 (Galletti et al., Reference Galletti, Fattori, Battaglini, Shipp and Zeki1996, Reference Galletti, Fattori, Gamberini and Kutz1999a), V6Av, and V6Ad (Galletti et al., Reference Galletti, Fattori, Kutz and Gamberini1999b; Gamberini et al., Reference Gamberini, Galletti, Bosco, Breveglieri and Fattori2011).
Acknowledgment
This research was supported by research grant of the University of Rome ‘‘Foro Italico’’ (number RIC112014) and by MIUR, FIRB 2013 N. RBFR132BKP, and by MIUR, PRIN 2010MEFNF7 and Fondazione del Monte di Bologna e Ravenna, Italy.