





1 Introduction
In physics under extreme conditions, numerous transient processes, such as inertial confinement fusion (ICF) implosions and intense laser–matter interactions, exhibit complex, disordered and non-reproducible evolution on femtosecond-to-picosecond timescales[ Reference Moses 1 – Reference Li, Lu, Xie, Sun, Liang, Yang, Guo, Zhu, Zhang, Zhang, Xue, Zhang, Haq, Zhu, Kang and Zhu 4 ]. The accurate diagnosis of these single-shot ultrafast events places stringent demands on both the penetration capability and spatiotemporal resolution of diagnostic techniques. Currently, advanced light sources based on large-scale synchrotrons or X-ray free-electron lasers (XFELs) play a crucial role in extreme-condition research, yet their heavy reliance on continuous imaging or repeated pump–probe measurements restricts their applicability to non-repeatable ultrafast transient processes[ Reference McMahon 5 , Reference Wang, Liu, Im, Lee, Wang, Fezzaa, Hung and Winkelman 6 ]. Although flash radiography facilities based on linear induction accelerators enable multi-pulse imaging with nanosecond temporal and millimeter spatial resolution, they still fall short of meeting the combined requirements of micrometer-scale spatial resolution and femtosecond-to-picosecond temporal resolution[ Reference Ekdahl 7 , Reference Peach and Ekdahl 8 ]. Although X-ray streak cameras can achieve sub-picosecond temporal resolution via slit imaging and reconstruct two-dimensional (2D) images from one-dimensional (1D) streaked data using indirect methods such as compressed ultrafast photography or arrayed pinholes, their imaging field of view, number of acquired frames, dynamic range and immunity to interference remain limited[ Reference Niu, Yang, Niu, Liao, Zhou and Ding 9 – Reference Shiraga, Heya, Nakasuji, Miyanaga, Azechi, Takabe, Yamanaka and Mima 13 ]. With advances in microelectronics, the temporal resolution of X-ray framing cameras has been improved to the picosecond level, and spatial resolution to several tens of micrometers, enabling their application in diagnosing ultrafast processes in ICF experiments. However, the transit time spread within the microchannel plate limits further improvement in temporal resolution[ Reference Cai, Lin, Luo, Wang, Huang, Xu, Luo and Liu 14 , Reference Gao, He, Tian, Zhang, Zhang, Wang, Chen, Jia, Yuan, Liang, Yan, Li, Wang and Yin 15 ]. Therefore, the development of ultrafast X-ray continuous imaging technology capable of capturing the entire process of a single shot has become essential to overcoming the limitations in dynamic diagnostics for research in fusion physics, shock wave physics and high-energy-density states of matter.
The rapid development of ultra-intense and ultra-short lasers has provided a novel diagnostic X-ray source: betatron radiation. This radiation originates from the transverse oscillation of electrons trapped in a laser wakefield accelerator[ Reference Tajima and Dawson 16 , Reference Rousse, Phuoc, Shah, Pukhov, Lefebvre, Malka, Kiselev, Burgy, Rousseau, Umstadter and Hulin 17 ], producing X-ray pulses characterized by a broad spectrum[ Reference Esarey, Shadwick, Catravas and Leemans 18 ], spatial coherence[ Reference Kneip, McGuffey, Martins, Martins, Bellei, Chvykov, Dollar, Fonseca, Huntington, Kalintchenko, Maksimchuk, Mangles, Matsuoka, Nagel, Palmer, Schreiber, Phuoc, Thomas, Yanovsky, Silva, Krushelnick and Najmudin 19 ], micrometer-scale source size[ Reference Schnell, Sävert, Uschmann, Jansen, Kaluza and Spielmann 20 , Reference Schnell, Sävert, Landgraf, Reuter, Nicolai, Jäckel, Peth, Thiele, Jansen, Pukhov, Willi, Kaluza and Spielmann 21 ] and femtosecond-scale duration[ Reference Phuoc, Fitour, Tafzi, Garl, Artemiev, Shah, Albert, Boschetto, Rousse, Kim, Pukhov, Seredov and Kostyukov 22 ]. This makes it particularly suitable for diagnosing ultrafast dynamics within dense, opaque media. For instance, Mahieu et al. [ Reference Mahieu, Jourdain, Phuoc, Dorchies, Goddet, Lifschitz, Renaudin and Lecherbourg 23 ] generated a betatron radiation source and successfully applied it to femtosecond X-ray absorption spectroscopy experiments, measuring for the first time the non-equilibrium electron temperature evolution of copper from the solid state to warm dense matter (WDM) under femtosecond laser heating with a temporal resolution of 75 fs. In recent years, phase-contrast imaging based on betatron sources has demonstrated significant potential for diagnosis of internal structures in low-Z materials[ Reference Wenz, Schleede, Khrennikov, Bech, Thibault, Heigoldt, Pfeiffer and Karsch 24 – Reference Hussein, Senabulya, Ma, Streeter, Kettle, Dann, Albert, Bourgeois, Cipiccia, Cole, Finlay, Gerstmayr, González, Higginbotham, Jaroszynski, Falk, Krushelnick, Lemos, Lopes, Lumsdon, Lundh, Mangles, Najmudin, Rajeev, Schlepütz, Shahzad, Smid, Spesyvtsev, Symes, Vieux, Willingale, Wood, Shahani and Thomas 27 ]. This technique is applicable not only in the biomedical field for imaging soft tissues and animal embryos[ Reference Cole, Wood, Lopes, Poder, Abel, Alatabi, Bryant, Jin, Kneip, Mecseki, Symes, Mangles and Najmudin 28 , Reference Cole, Symes, Lopes, Wood, Poder, Alatabi, Botchway, Foster, Gratton, Johnson, Kamperidis, Kononenko, De Lazzari, Palmer, Rusby, Sanderson, Sandholzer, Sarri, Szoke-Kovacs, Teboul, Thompson, Warwick, Westerberg, Hill, Norris, Mangles and Najmudin 29 ] but also in shock wave physics research for transient diagnostics of density discontinuities and interface evolution during dynamic compression[ Reference Wood, Chapman, Poder, Lopes, Rutherford, White, Albert, Behm, Booth, Bryant, Foster, Glenzer, Hill, Krushelnick, Najmudin, Pollock, Rose, Schumaker, Scott, Sherlock, Thomas, Zhao, Eakins and Mangles 30 ], thereby providing experimental evidence for high-energy-density physics.
However, current petawatt-class ultrashort laser-driven betatron sources typically operate at low repetition rates of 0.1–10 Hz, and their single-shot nature fundamentally limits the continuous imaging capability[ Reference Li, Chen, Chen, Liu, Gu, Guo, Hua, Huang, Leng, Li, Li, Li, Lin, Lu, Lyu, Ma, Ning, Peng, Wan, Wang, Wang, Wei, Yan, Zhang, Zhao, Zhao, Zhou, Zhou, Zhou, Zhu and Zhu 31 ]. Although high-repetition-rate operation enables signal accumulation in repeatable experiments, it remains insufficient for non-repeatable transient processes such as ICF implosions and shock loading, where single-shot measurements are incapable of capturing multi-frame images. This inability to reconstruct the full dynamic evolution severely limits the application of these sources.
To overcome the bottleneck of insufficient spatiotemporal information in single-shot betatron radiation diagnostics, this work proposes a novel integrated technical scheme combining multi-pulse driving and multi-angle detection, aiming to achieve high spatiotemporal resolution for continuous imaging of extreme physical processes under single-shot conditions. Table 1 systematically compares the core performance parameters of the proposed method with those of flash radiography facilities, X-ray streak cameras and X-ray framing cameras. The scheme first employs beam splitting, delay and mirror design to generate multiple X-ray pulses with precise femtosecond-to-picosecond intervals in a single experiment, enabling multi-timeframe sampling of non-repeatable ultrafast processes. Furthermore, by utilizing a specially designed target structure, multiple betatron sources with spatially distributed angular emission are excited in a single laser interaction, allowing imaging information from different time frames to be separated at distinct positions on the detector. Based on existing petawatt-class ultra-short ultra-intense laser facilities and the proposed structural design, particle-in-cell (PIC) simulations with FBPIC code are first conducted to model the laser–plasma interaction and the electron beam[ Reference Lehe, Kirchen, Andriyash, Godfrey and Vay 32 – Reference Kirchen, Lehe, Jalas, Shapoval, Vay and Maier 34 ]. After obtaining the phase-space data of the electron beam, the SynchRad code is then employed to calculate the betatron radiation’s energy spectrum and spatial distribution based on the Liénard–Wiechert potentials[ Reference Esarey, Shadwick, Catravas and Leemans 18 , 35 ]. Finally, these radiation characteristics are input into Geant4 simulations to model X-ray transport through the sample and detector response, ultimately evaluating imaging performance metrics[ Reference Agostinelli, Allison and Amako 36 – Reference Allison, Amako and Apostolakis 38 ].
Performance comparison of different X-ray imaging techniques.

Table 1 Long description
The table compares four techniques: Linear induction accelerator for flash radiography, X-ray streak camera, X-ray framing camera, and the Proposed scheme.
* Spatial resolution: Linear induction accelerator is 0.75 to 4 mm; X-ray streak camera is 10 to 150 mu m; X-ray framing camera is 30 to 100 mu m; Proposed scheme is several mu m level.
* Temporal resolution: Linear induction accelerator is 20 to 360 n s; X-ray streak camera is sub-p s to 150 p s; X-ray framing camera is 5 to 35 p s; Proposed scheme is f s to p s level.
* Measurement dimension: Linear induction accelerator is 2 D (1 to 4 frames); X-ray streak camera is 1 D, 2 D (multi-frame); X-ray framing camera is 2 D (multi-frame); Proposed scheme is 2 D (multi-frame).
2 Experimental design
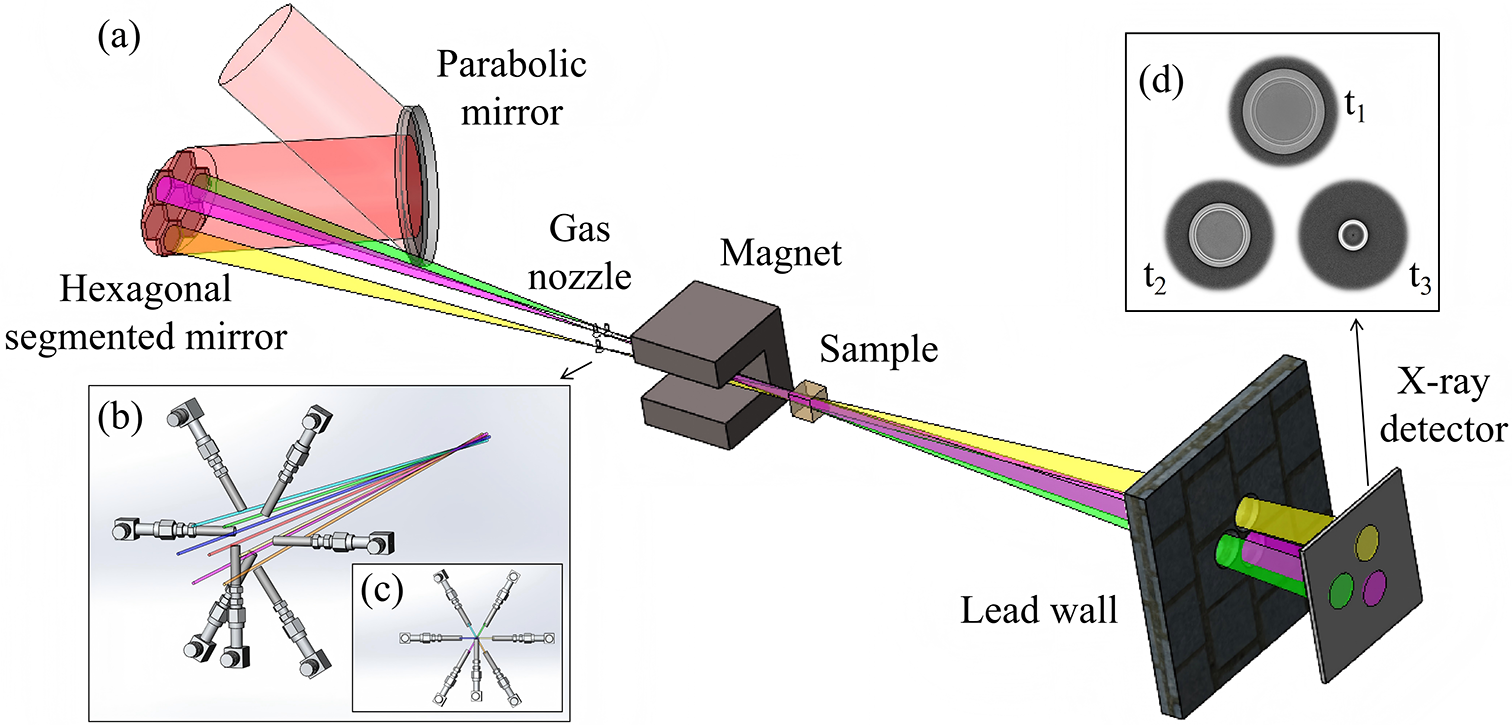
The 1 PW/0.1 Hz laser system at the Shanghai Superintense Ultrafast Laser Facility (SULF-1 PW) acts as the core driver in this scheme[ Reference Zhang, Wu, Hu, Yang, Gui, Ji, Liu, Wang, Liu, Lu, Xu, Leng, Li and Xu 39 , Reference Zhang, Deng, Jiang, Wang, Wei, Ge, Chu, Chen, Wang, Yan, Feng, Jiang, Hu, Tan, Zeng, Guo, Yang, Qian, Zhu, Zhang, Xu, Leng, Zhou, Li, Wang and Li 40 ]. It operates at a repetition rate of 0.1 Hz, with a central wavelength of 800 nm, a single-pulse energy of 30 J and a pulse duration of 28 fs. It provides the necessary driving energy foundation required for multi-pulse betatron radiation imaging. The optical layout of the device is illustrated in Figure 1.
Schematic diagram of the multi-pulse betatron radiation imaging system. (a) The incident laser beam is focused by an off-axis parabolic mirror and then split into seven independently controlled sub-beams by a hexagonal segmented mirror system. Each mirror unit is equipped with a piezoelectric actuator for precise adjustment of the time delay and angular deflection of the corresponding sub-beam. The sub-beams are respectively incident onto a gas nozzle array, and the generated electron beams are synchronously deflected by a dipole magnet. The resulting multiple radiation beams converge at the sample, and the imaging signals are then transmitted through an aperture on the lead wall and ultimately recorded by a detector. (b) Detailed view of the gas nozzle array structure. (c) Projection image of the gas nozzle array in the vertical laser propagation direction. (d) Schematic illustration of X-ray imaging with different angles and time delays.

Figure 1 Long description
Panel a shows a wide-angle schematic. A red incident laser beam strikes a Parabolic mirror at the top left, reflecting onto a Hexagonal segmented mirror. This splits the light into seven colored sub-beams (yellow, green, purple, and others). These beams pass through a Gas nozzle array and into a C-shaped Magnet. Beyond the magnet, the beams converge at a cubic Sample. The resulting radiation passes through a circular aperture in a stone-textured Lead wall to strike an X-ray detector, which displays three distinct circular signals. Panel b provides a close-up of the gas nozzle array, showing seven mechanical injectors arranged in a radial pattern around the converging laser paths. Panel c is a vertical projection of the nozzle array, showing the injectors pointing toward a central focal point. Panel d shows three grayscale circular X-ray projection images labeled t sub 1, t sub 2, and t sub 3, representing different time delays. The images show varying intensities and ring structures within the circular frames.
The laser beam is focused by an off-axis parabolic (OAP) mirror with a focal length of 2 m and then reflected onto a hexagonal close-packed segmented mirror array (HCP-SMA). This system comprises seven independently controllable mirror units, each featuring a 50 mm edge length that defines a hexagonal spot measuring 86 mm
$\times$
 100 mm. The array is arranged in a honeycomb pattern with 2 mm spacing between units, effectively splitting the incident laser into seven sub-beams. Each mirror unit includes a piezoelectric actuator, which enables sub-micrometer displacement and divergence control of the order of milliradians. Each subunit can be independently adjusted over a displacement range of 0.3 μm–60 mm, achieving temporal delays of the order of 1 fs–200 ps. In addition, the propagating direction of the laser pulse can be tuned, allowing for an angular separation over 40 mrad between sub-pulses, which converge at the imaging sample position and thus ensure a centimeter-scale separation between the gas nozzles on the transverse projection plane.
To ensure stable laser transmission, the experimental design utilizes JGS1 fused silica mirrors with an extremely low thermal expansion coefficient, physically isolates the optical platform from the cavity and incorporates vibration isolation modules, combined with real-time cameras that monitor the laser spot and pointing to drive motorized mirror mounts, compensating for beam pointing errors caused by thermal drift and mechanical jitter. After modulation by the HCP-SMA, the single sub-laser beam power exceeds 100 TW and the focal spot waist radius is approximately 21 μm, corresponding to a peak intensity above
$2.0\times {10}^{19}$
 W/cm
${}^2$
 and a normalized vector potential
${a}_0>2.0$
 .
The main laser beam is focused by the OAP mirror and delivered to a gas nozzle array via the HCP-SMA. The beam-splitting optics are arranged in a helical longitudinal configuration to spatially separate the resulting sub-pulses. Owing to the fixed focal length of the OAP mirror, the focal points of the resulting sub-pulses naturally inherit this helical longitudinal distribution. Consequently, the gas nozzle array adopts the same helical longitudinal arrangement, with each nozzle precisely positioned by a motorized translation stage to align with the focus of its corresponding sub-pulse. Thus, all sub-pulses interact simultaneously with their respective gas nozzles. This helical longitudinal arrangement enables the generation of multi-angle, multi-frame and spatially separated betatron X-ray radiation, as it simultaneously achieves both angular separation and time delay. On one hand, it positions each gas target at a distinct azimuthal angle relative to the sample, ensuring that each betatron X-ray pulse probes the sample from a different direction, thereby enabling angular separation of multi-frame images on the detector plane. On the other hand, the varying longitudinal positions of the gas targets result in different propagation distances from each X-ray source to the sample, and these optical path differences introduce delays ranging from femtoseconds to picoseconds in the arrival times of the X-ray pulses at the sample. Furthermore, the supersonic Laval gas nozzle effectively confines the flow to expand axially and reduces lateral diffusion[
Reference Anderson
41
–
Reference Sylla, Veltcheva, Kahaly, Flacco and Malka
43
]. The peak plasma expansion velocity inferred from diffraction fringes in interferograms is approximately 1.2
$\times {10}^7$
 cm/s[
Reference Prasad, Barnwal, Naik, Chakera and Gupta
44
]. On the picosecond timescale of laser–plasma interaction, any plasma expansion or shock wave generated at a single nozzle is physically incapable of affecting other spatially separated gas targets, given that the transverse projection spacing between individual nozzles is on the centimeter scale. The gas nozzles are supplied with high-purity helium as the target medium for laser wakefield acceleration. The pressure of the gas is regulated by a high-precision pressure controller, ensuring a stable gas jet with a tunable density profile.
The laser beams are focused onto a gas target array to drive laser wakefield acceleration and generate betatron radiation[ 45 ]. Simultaneously, a dipole magnet is employed to deflect the electron beam. Multiple betatron radiation beams converge at the sample to be imaged, and the final signals are collected by a flat-panel detector or an imaging plate. To further suppress the scattering background and ensure signal independence across channels, a multi-channel shielding aperture made of a high-atomic-number material such as lead is placed in front of the detector. The aperture is precisely perforated with beam channels aligned according to the angular differences of the individual sub-beams, allowing the primary X-rays to pass through their corresponding channels and reach designated areas on the detector. This configuration not only effectively mitigates scattering background but also provides physical isolation against inter-frame and inter-channel crosstalk, thereby ensuring the signal independence of each channel.
In the imaging path corresponding to a single beam, the source-to-object distance
${d}_{\mathrm{so}}=0.5$
 m, the object-to-detector distance
${d}_{\mathrm{od}}=2.5$
 m and the system magnification is approximately 6, enabling spatial resolution on the micrometer scale. The imaging magnification for each sub-beam is given by the following formula:

where
$c$
 is the speed of light in vacuum and
$\Delta t$
 is the time delay of each sub-beam relative to the reference beam. Benefiting from the independent control of each reflective element in the array, the system can capture ultrafast dynamic processes within a 200 ps time window, achieving continuous imaging with temporal resolution of femtoseconds and spatial resolution of micrometers.
3 Results and discussion
The fundamental characteristics of betatron radiation, including its small divergence angle, photon energy of the order of tens of keV and high photon yield, have been confirmed in multiple experimental studies based on a hundred-terawatt laser-driven wakefield accelerator[
Reference Albert, Pollock, Shaw, Marsh, Ralph, Chen, Alessi, Pak, Clayton, Glenzer and Joshi
46
–
Reference Yu, Liu, Wang, Li, Qi, Zhang, Qin, Liu, Fang, Feng, Wu, Ke, Chen, Wang, Xu, Leng, Xia, Li and Xu
48
]. Experiments by Albert et al.
[
Reference Albert, Pollock, Shaw, Marsh, Ralph, Chen, Alessi, Pak, Clayton, Glenzer and Joshi
46
] demonstrated that betatron radiation generated by a near-hundred-TW laser exhibits an on-axis peak energy of approximately 10 keV, with a broad energy spectrum extending up to 80 keV. Furthermore, as the critical energy increases, the radiation divergence angle decreases and can be optimized to below 10 mrad. Cipiccia et al.
[
Reference Cipiccia, Islam, Ersfeld, Shanks, Brunetti, Vieux, Yang, Issac, Wiggins, Welsh, Anania, Maneuski, Montgomery, Smith, Hoek, Hamilton, Lemos, Symes, Rajeev, O’Shea, Dias and Jaroszynski
47
] used a 100 TW laser to generate quasi-monoenergetic electron beams with energies around 700 MeV via a laser wakefield accelerator. By exploiting the harmonic resonance effect between the electrons and the trailing part of the laser pulse, they enhanced the radiation critical energy up to 50–150 keV, achieving a photon number of approximately
$5.0\times {10}^8$
 . Through phase-contrast imaging, they confirmed a radiation source size of about 15 μm, indicating its capability for micrometer-scale spatial resolution. In another study, Yu et al.
[
Reference Yu, Liu, Wang, Li, Qi, Zhang, Qin, Liu, Fang, Feng, Wu, Ke, Chen, Wang, Xu, Leng, Xia, Li and Xu
48
] utilized a 100 TW laser with tilted shock-front manipulation to control the electron motion. Without significantly degrading the electron beam energy spread, they pushed the X-ray critical energy to several tens of keV and further increased the photon yield. Collectively, these studies validate the integrated performance of betatron radiation in terms of its narrow divergence angle below 10 mrad, photon energy up to tens of keV, single-pulse photon yield reaching the order of
${10}^8$
 –
${10}^9$
 and micrometer-scale spatial resolution, providing experimental support for its practical feasibility in applications such as dynamic imaging. To fully verify the feasibility of the multi-pulse betatron radiation source imaging scheme proposed here, we first conduct simulation studies based on the source parameters, followed by imaging feasibility demonstrations using Geant4 simulations.
3.1 Characteristics of betatron radiation
Simulations of betatron radiation driven by a single laser beam in the proposed scheme were conducted to further validate the theoretically achievable brightness, photon energy and divergence angle of the radiation. Although the driving laser has a peak power of 1 PW, the energy delivered to each individual gas jet is significantly attenuated after beam splitting and reflection by the HCP-SMA. Here, we conservatively estimate that the laser power delivered to each gas target is 100 TW. To accurately model the interaction between this high-power laser and the plasma target, FBPIC code is employed. This PIC code is tailored for relativistic plasma physics and is particularly well-suited for simulations of laser wakefield acceleration[
Reference Lehe, Kirchen, Andriyash, Godfrey and Vay
32
–
Reference Kirchen, Lehe, Jalas, Shapoval, Vay and Maier
34
]. Accordingly, the FBPIC simulation parameters are set as follows: after beam splitting by the HCP-SMA, the laser delivers a peak power of 100 TW at the target, with a pulse duration of approximately 28 fs and a central wavelength of 800 nm. The beam aperture is 90–95 mm, and the focused beam waist radius is 21 μm. The corresponding peak intensity is
$I\approx 2.0\times {10}^{19}\ \mathrm{W}/{\mathrm{cm}}^2$
 , yielding a normalized vector potential of
${a}_0=2.0$
 . The laser is focused at the entrance of a supersonic gas nozzle with a diameter of 3 mm. Pure helium gas is used, producing a plasma density of
$8\times {10}^{18}\ {\mathrm{cm}}^{-3}$
 . The longitudinal and transverse dimensions of the simulation window are 70 and 80 μm, respectively. Each grid cell contains 32 macro-particles, with cell sizes of
$\Delta z=34\ \mathrm{nm}$
 and
$\Delta r=78\ \mathrm{nm}$
 . The laser is injected from the left-hand side of the simulation window along the
$z$
 -direction and is focused at a position 1.25 mm from the plasma entrance.
The duration of the radiation is predominantly determined by the longitudinal length of the electron bunch. For the acceleration process dominated by self-injection, under the ideal assumption of continuous and uniform electron injection into the plasma wave, the radiation pulse width can be estimated by the following formula[ Reference Phuoc, Fitour, Tafzi, Garl, Artemiev, Shah, Albert, Boschetto, Rousse, Kim, Pukhov, Seredov and Kostyukov 22 ]:

where
${L}_{\mathrm{acc}}$
 is the acceleration length,
${n}_{\mathrm{e}}$
 the plasma density and
$\lambda$
 the laser wavelength. With typical experimental parameters – an acceleration length
${L}_{\mathrm{acc}}$
 = 3 mm, laser wavelength
$\lambda$
 = 0.8 μm and plasma density
${n}_{\mathrm{e}}$
 = 8
$\times {10}^{18}$
 cm
${}^{-3}$
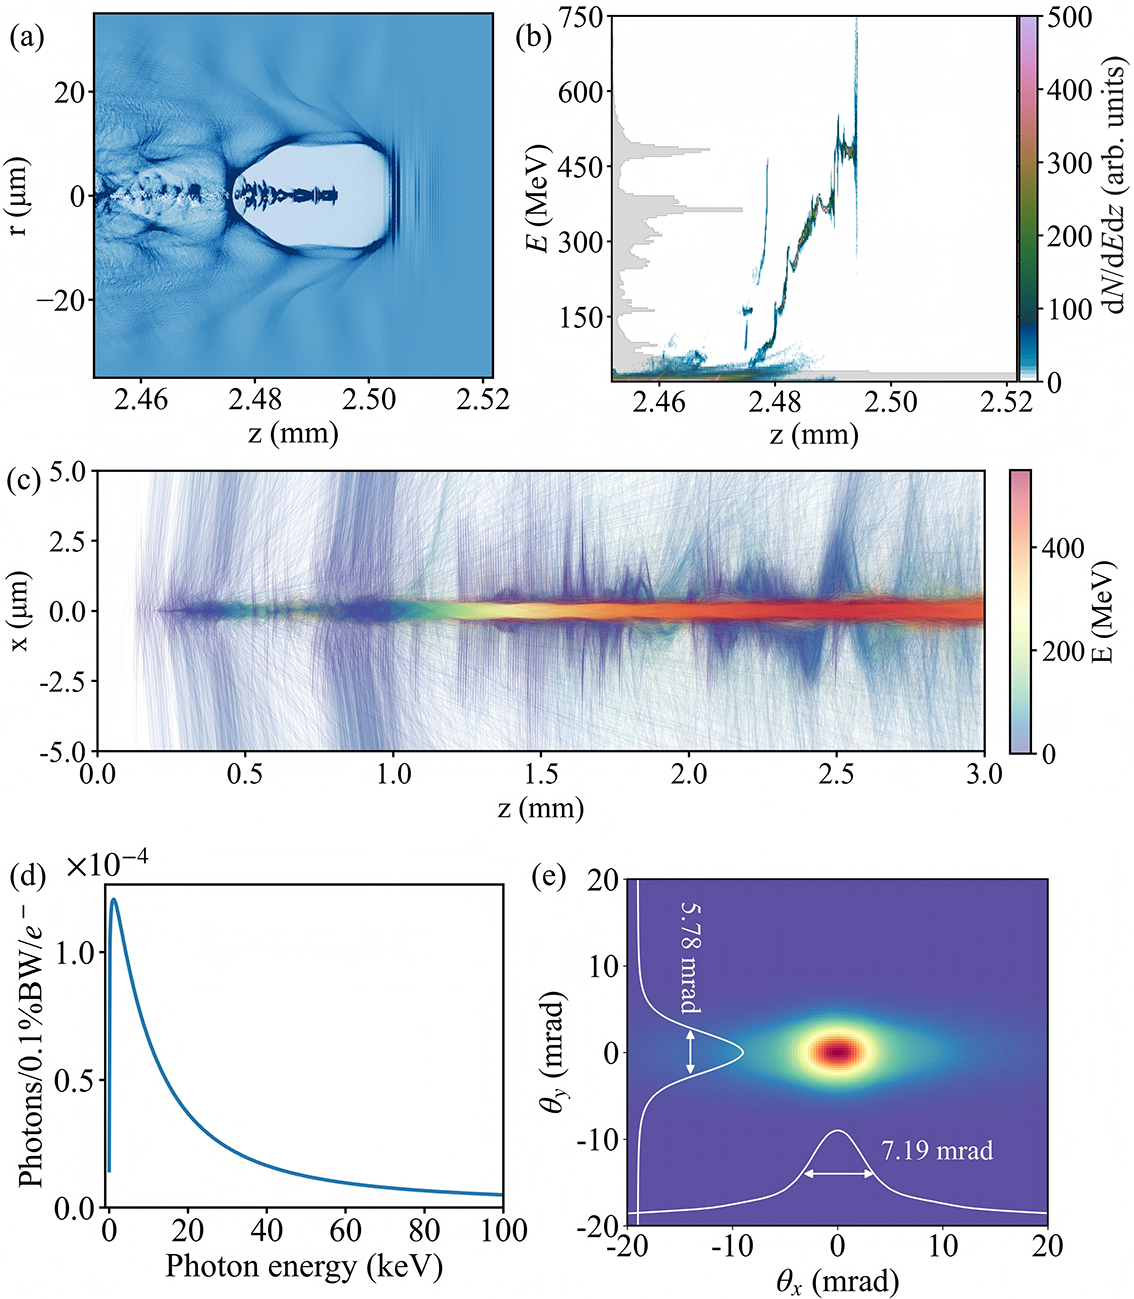
 – the radiation pulse duration is estimated to be approximately 29 fs. This value is consistent with the full-width at half-maximum (FWHM) electron-bunch length of about 9 μm observed in PIC simulations, as shown in Figure 2(a).
Simulated betatron radiation source characteristics using FBPIC[
Reference Kirchen, Lehe, Jalas, Shapoval, Vay and Maier
34
] and SynchRad[
35
] codes. (a) Plasma density distribution in the
$r$
 –
$z$
 plane. (b) Longitudinal phase-space distribution of the electron beam, with the gray shading representing the electron energy spectrum. (c) Traced electron trajectories and their energy evolution. (d) Spectral distribution of the betatron X-rays. (e) X-ray beam profile integrated over the spectrum.

Figure 2 Long description
A multi-panel figure containing five scientific plots labeled a through e.
* Panel a: A 2D heat map of plasma density in the r-z plane. The x-axis z ranges from 2.45 to 2.52 millimeters, and the y-axis r ranges from minus 20 to 20 micrometers. It shows a wakefield bubble structure centered around z equals 2.49 millimeters.
* Panel b: A scatter plot of longitudinal phase-space distribution. The x-axis z matches panel a, and the y-axis E represents energy in M e V from 0 to 750. A gray shaded histogram on the left vertical axis shows the electron energy spectrum with a peak near 400 M e V. A color bar on the right indicates d N / d E d z in arbitrary units.
* Panel c: A trajectory plot showing electron evolution. The x-axis z ranges from 0.0 to 3.0 millimeters, and the y-axis x ranges from minus 5.0 to 5.0 micrometers. A central horizontal band shows high energy electrons, color-coded by a scale on the right from 0 to 400 M e V.
* Panel d: A line graph of the spectral distribution of betatron X-rays. The x-axis is Photon energy in k e V from 0 to 100. The y-axis is Photons per 0.1 percent B W per e-minus, scaled by 10 super minus 4. The curve peaks sharply near 5 k e V and decays asymptotically toward 100 k e V.
* Panel e: A 2D X-ray beam profile. The x-axis theta sub x and y-axis theta sub y both range from minus 20 to 20 mrad. A central hot spot is shown in red and yellow. White line profiles indicate a vertical divergence of 5.78 mrad and a horizontal divergence of 7.19 mrad.
As presented in Figure 2(b), the simulation indicates that the charge of the electron beam above 25 MeV exceeds 3 nC, with the maximum electron energy reaching up to 500 MeV. By tracking 20,000 representative electrons, the transverse oscillation amplitude is confined within an FWHM scale of 1 μm, demonstrating good collimation, as shown in Figure 2(c). The velocity and position of these relativistic electrons were recorded every 3 fs. After obtaining the phase-space data of the tracking electrons, the SynchRad code is employed to calculate the betatron radiation’s energy spectrum and spatial distribution based on the Liénard–Wiechert potentials[ Reference Esarey, Shadwick, Catravas and Leemans 18 , 35 ] in the far-field using Equation (3), as illustrated in Figures 2(d) and 2(e):

where
${r}$
 denotes the position vector of the electron,
${n}$
 is the unit vector along the observation direction and
$\beta =v/c$
 represents the dimensionless velocity vector.
In the calculation, the radiation from all 20,000 electrons is summed, with a frequency sampling range from 0.1 to 100 keV and an angular distribution grid of 64 mrad
$\times$
 64 mrad. The critical energy
${E}_{\mathrm{c}}$
 of the betatron radiation is 15 keV. The FWHM divergence angles in the transverse and longitudinal directions are 5.78 and 7.19 mrad, respectively. The estimated photon yields are
$5.6\times {10}^9$
 (
$>$
 1 keV) and
$2.3\times {10}^9$
 (
$>$
 5 keV). Based on these parameters, the peak brilliance of the radiation source is estimated to be
$8.0\times {10}^{23}$
 photons
$\cdot$
 s
${}^{-1}\cdot$
 mm
${}^{-2}\cdot$
 mrad
${}^{-2}\cdot$
 0.1%BW
${}^{-1}$
 at 5 keV.
Based on the radiation source characteristics designed above, we further explore geometric multiplexing imaging. Owing to the size of the mirror units and the focal length of the OAP, the angular separation between the sub-beams is approximately 43–50 mrad. This significant difference from the narrow divergence angle of betatron radiation (
$<$
 10 mrad) provides a geometric foundation for multi-angle imaging. According to the imaging system’s magnification setting of
$M$
 = 6, the projected separation between the radiation centers of each sub-beam on the detector plane exceeds 10 cm, completely avoiding image aliasing. Moreover, the femtosecond-scale pulse duration of betatron radiation enables independent capture of dynamic processes at different time frames within a picosecond-scale window in a single experiment, without relying on ultrafast scintillators or high-speed cameras.
3.2 Feasibility demonstration of imaging
Existing studies have reported X-ray imaging of static capsules using betatron radiation[
Reference Fourmaux, Hallin, Krol, Bourgade and Kieffer
49
]. To evaluate the practical feasibility of multi-pulse betatron radiation for dynamically diagnosing extreme physical processes, we established a full model spanning from the radiation source to the imaging detector based on Geant4, an open-source Monte Carlo software widely employed to simulate particle–matter interactions[
Reference Agostinelli, Allison and Amako
36
–
Reference Allison, Amako and Apostolakis
38
]. In the simulation, the betatron radiation source is modeled as a spatially coherent micrometer-scale point source. Its photon energy distribution, referenced from SynchRad simulation results, exhibits a continuous spectrum characteristic of synchrotron radiation, with a critical energy of 15 keV and a single-pulse photon number of approximately
${10}^9$
 . The distance between the betatron radiation source and the sample is 0.5 m, with the detector placed 2.5 m behind the sample, resulting in an imaging magnification factor of 6. The sample is designed as a spherical capsule with a radius of 1 mm, simulating a typical ICF capsule structure[
Reference Yan, Zheng, Chen, Jiang, Zhang and Jiang
50
,
Reference Tian, Yu, Shan, Wu, Bi, Zhang, Wu, Zhang, Zhang, Liu, Wang, Yuan, Yang, Yang, Deng, Teng, Zhou, Zhao, Gu and Zhang
51
]. The capsule consists of three layers: a 200-μm-thick CH layer, a 100-μm-thick DT ice layer and an inner cavity filled with DT gas at 10 atm. The refractive index data for the capsule materials are obtained from the CXRO database[
Reference Henke, Gullikson and Davis
52
].
To validate the multi-pulse dynamic imaging capability, simulated imaging was performed for three characteristic stages of an ICF capsule implosion: the initial uncompressed stage
${t}_1$
 , the half-compressed stage of the inner shell
${t}_2$
 and the moment of maximum compression
${t}_3$
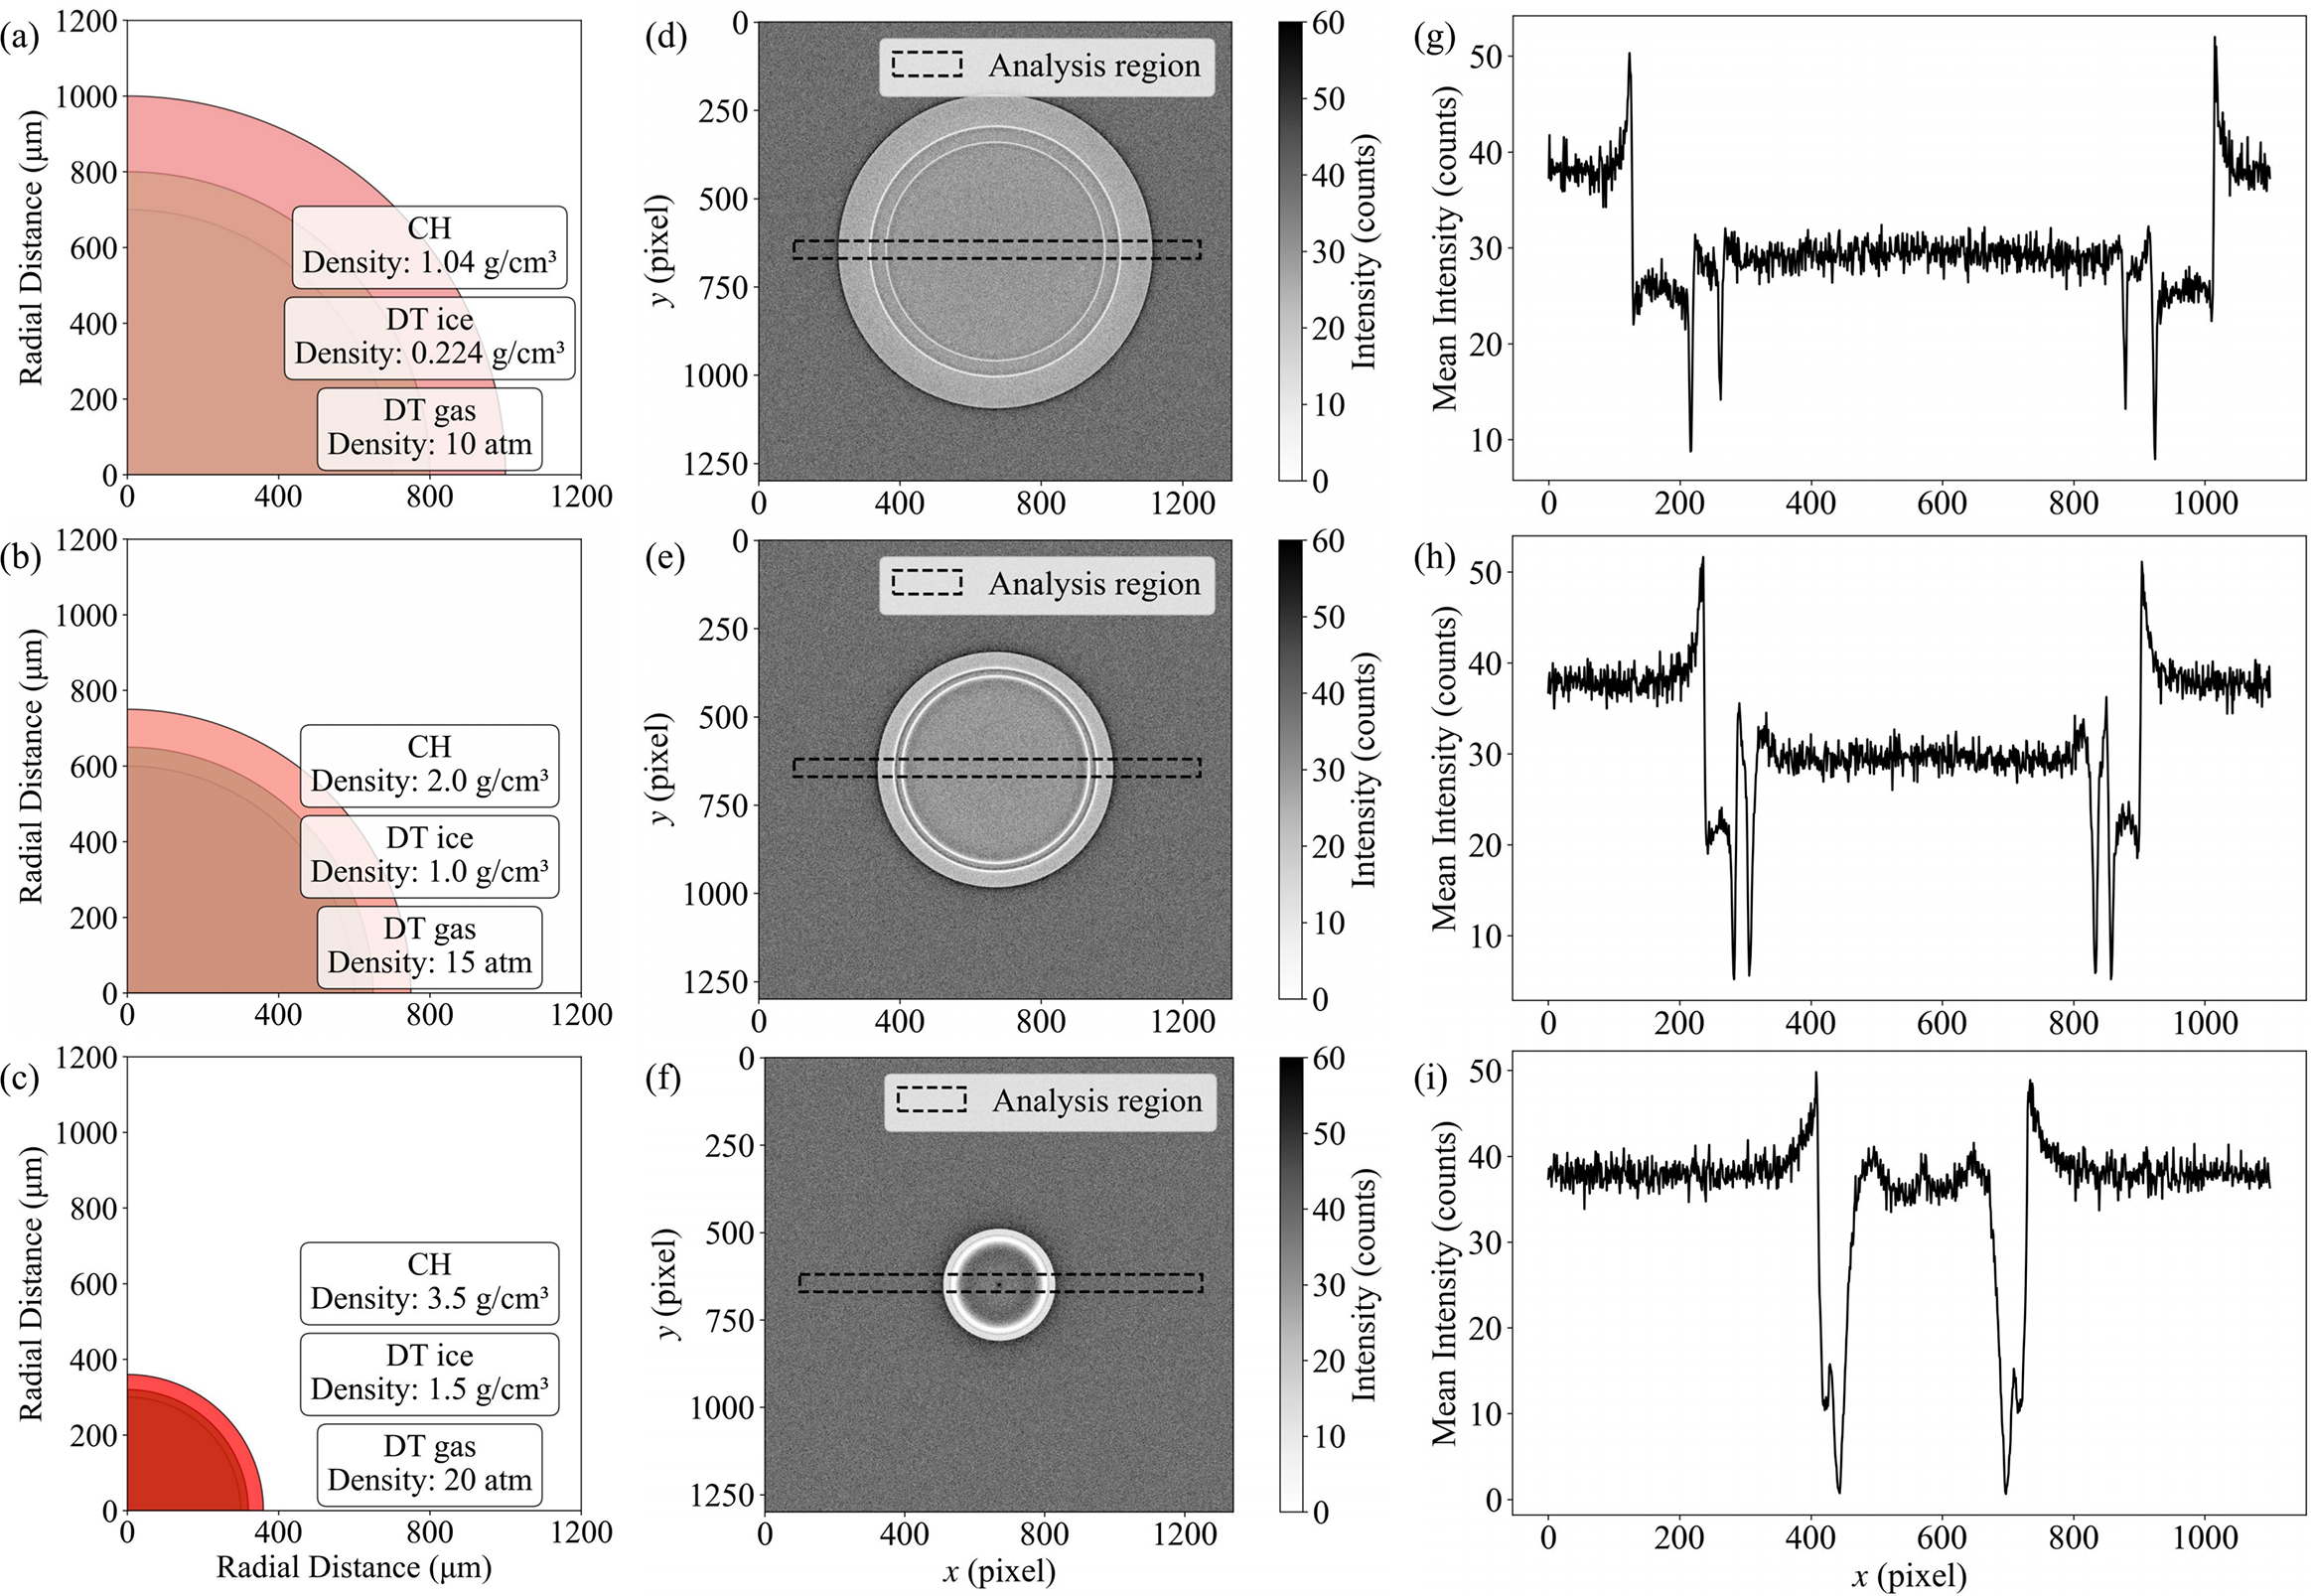
 . Figures 3(a)–3(c) illustrate the input capsule configurations at these three compression stages. The imaging performance of a single betatron pulse was first evaluated for the static capsule at
${t}_1$
 . Results show that in the phase-contrast imaging mode, the sample edges exhibit alternating bright and dark fringes due to refraction. As shown in Figures 3(d) and 3(g), interfaces between different capsule layers are clearly resolved. This demonstrates that phase-contrast imaging provides superior contrast sensitivity for low-Z material interfaces compared to conventional absorption imaging, making it particularly suitable for diagnosing weakly absorbing structures such as the frozen fuel layer in ICF. Clear structural information is visible at the interfaces of the CH layer, DT ice layer and DT gas. Imaging results at the half-compressed stage
${t}_2$
 are shown in Figures 3(e) and 3(h). At this early implosion phase, the CH and DT ice layers are compressed to half the initial thickness, with pronounced edge enhancement at each interface and good imaging contrast. This further confirms the radiation source’s penetration capability and spatial resolution under different sample thicknesses. The results at the maximum compression stage
${t}_3$
 are presented in Figures 3(f) and 3(i). The remaining CH layer and the highly compressed DT ice layer remain clearly distinguishable despite further capsule compression. This indicates that the imaging system retains the ability to resolve micrometer-scale interface structures even under high areal-density conditions.
Geant4 simulation of imaging using multi-pulse betatron radiation. (a)–(c) Input capsule configurations at three distinct times,
${t}_1$
 ,
${t}_2$
 and
${t}_3$
 . (d)–(f) Simulated betatron radiation phase-contrast images corresponding to (a)–(c). (g)–(i) The intensity profiles along the central axis for the pellet structure at the same three time frames,
${t}_1$
 ,
${t}_2$
 and
${t}_3$
 , corresponding to (d)–(f).

Figure 3 Long description
The figure consists of three rows representing time frames t sub 1, t sub 2, and t sub 3.
Row 1 (t sub 1):
- Panel a: A quarter-circle diagram of a capsule with three layers. The innermost layer is D T gas at 10 atm. The middle layer is D T ice with a density of 0.224 g/cm cubed. The outermost layer is C H with a density of 1.04 g/cm cubed. The total radius is approximately 1000 micrometers.
- Panel d: A simulated phase-contrast image showing a large circular shell. A horizontal dashed rectangle indicates the analysis region.
- Panel g: A line graph of mean intensity in counts versus x pixel. It shows a noisy baseline around 40 counts with sharp peaks and troughs between pixels 200 and 1000, corresponding to the shell boundaries.
Row 2 (t sub 2):
- Panel b: The capsule has compressed to a radius of approximately 750 micrometers. Densities have increased: D T gas to 15 atm, D T ice to 1.0 g/cm cubed, and C H to 2.0 g/cm cubed.
- Panel e: The circular shell in the phase-contrast image is smaller and more defined.
- Panel h: The intensity profile shows the peaks and troughs shifted inward, narrowing the central region.
Row 3 (t sub 3):
- Panel c: The capsule is highly compressed with a radius under 400 micrometers. Densities are now: D T gas at 20 atm, D T ice at 1.5 g/cm cubed, and C H at 3.5 g/cm cubed.
- Panel f: The phase-contrast image shows a very small, bright circular core.
- Panel i: The intensity profile shows a significant central dip and two very close, sharp peaks between pixels 400 and 800, indicating the final stages of compression.
Geant4 simulation results demonstrate that the dynamic imaging scheme utilizing multi-pulse betatron radiation is capable of performing high spatiotemporal-resolution continuous imaging of non-repeatable ultrafast processes. This provides a reliable technical pathway for the in situ diagnosis of extreme physical processes such as ICF implosion dynamics and shock wave propagation.
3.3 Imaging applicability over a wide parameter range
In the preceding simulation of the core parameters of the radiation source, after the beam-splitting mirror system, we adopted 100 TW as a conservative estimate of the laser intensity. Given that the actual laser energy reaching the target is higher and that multi-petawatt laser facilities with even higher peak powers are available, we further investigated the variation of the betatron radiation photon number
${N}_{\mathrm{phs}}$
 and the critical energy
${E}_{\mathrm{c}}$
 with the laser intensity parameter
${a}_0$
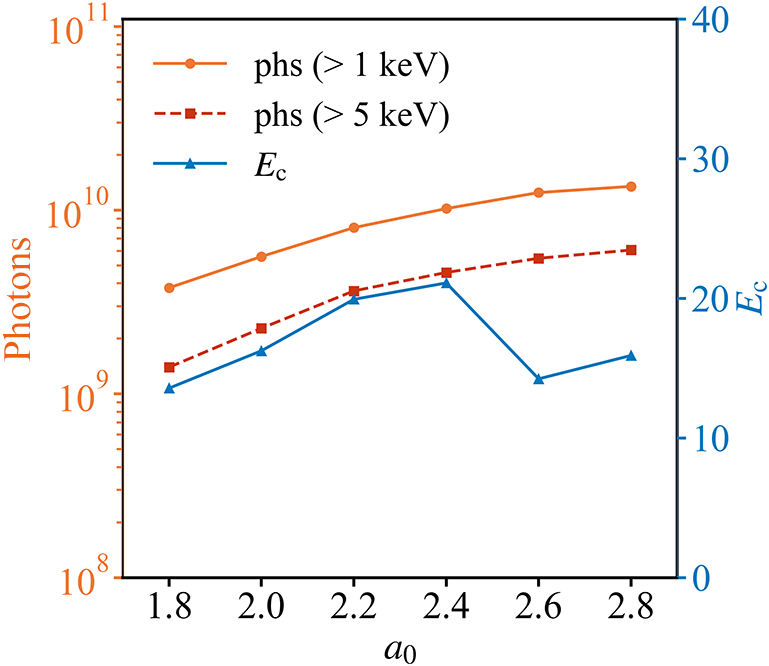
 . As shown in Figure 4, as
${a}_0$
 increases,
${N}_{\mathrm{phs}}$
 exhibits a monotonic increasing trend, indicating that higher X-ray fluxes can be achieved under higher laser intensities. Under the same plasma density, when
${a}_0<2.5$
 , the
${E}_{\mathrm{c}}$
 value of betatron radiation increases with
${a}_0$
 . However, when
${a}_0>2.5$
 ,
${E}_{\mathrm{c}}$
 decreases. This is because a larger
${a}_0$
 leads to a large number of electrons being injected into the bubble, resulting in a significant beam loading effect, which reduces the overall electron beam energy and consequently affects the critical energy of betatron radiation. Notably, within the entire range of simulation parameters, the critical energy remains above 13 keV, which is sufficient to meet the requirements of typical imaging applications.
Variation of the photon number and critical energy of betatron radiation under different normalized laser intensities.

Figure 4 Long description
The horizontal axis represents normalized laser intensity a sub 0, ranging from 1.8 to 2.8. The left vertical axis is logarithmic, measuring Photons from 10 super 8 to 10 super 11. The right vertical axis is linear, measuring E sub c from 0 to 40.
Three data series are plotted:
* phs (> 1 k e V): An orange solid line with circular markers. It shows a steady logarithmic increase from approximately 4 times 10 super 9 at a sub 0 = 1.8 to over 10 super 10 at a sub 0 = 2.8.
* phs (> 5 k e V): An orange dashed line with square markers. It follows a similar upward trend, starting at roughly 1.5 times 10 super 9 and reaching nearly 7 times 10 super 9.
* E sub c: A blue solid line with triangular markers corresponding to the right axis. It increases from 14 at a sub 0 = 1.8 to a peak of 22 at a sub 0 = 2.4, followed by a sharp drop to 15 at a sub 0 = 2.6, and a slight recovery to 17 at a sub 0 = 2.8.
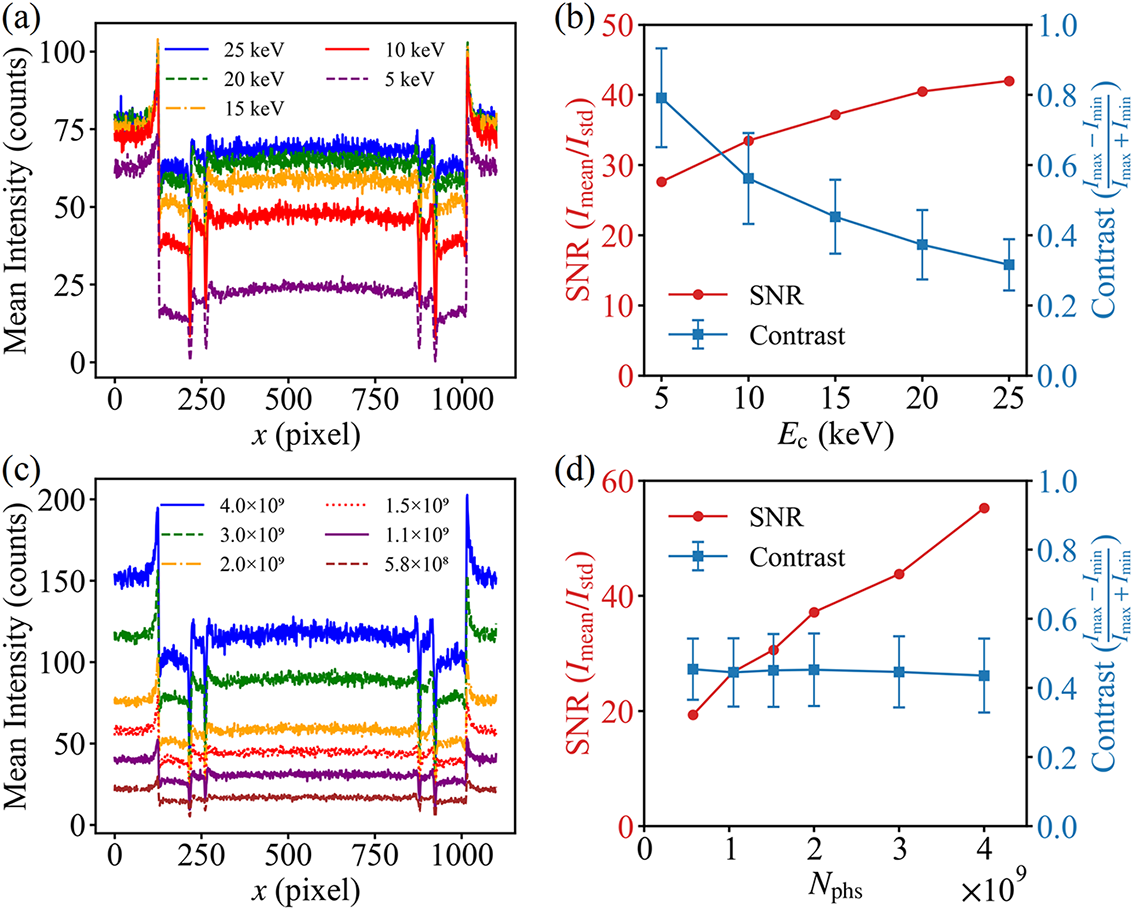
Based on Geant4 simulations, the effects of the critical energy and photon number of betatron radiation on imaging quality were systematically investigated. Firstly, with a fixed photon number, the influence of the betatron radiation critical energy on the imaging signal-to-noise ratio (SNR) and imaging contrast was analyzed. As shown in Figure 5(a), under varying critical energy conditions, a distinct edge enhancement effect was observed in the images. Furthermore, the overall average intensity exhibited a significant increase with rising
${E}_{\mathrm{c}}$
 . Figure 5(b) illustrates that as
${E}_{\mathrm{c}}$
 increases from 5 to 25 keV, the SNR rises from 28 to 42. X-rays with higher critical energy penetrate the sample more effectively while reducing the proportion of background noise. In contrast, the image contrast decreases from 0.75 to 0.25 with increasing
${E}_{\mathrm{c}}$
 . This is attributed to the reduced attenuation difference of high-energy X-rays in low-Z materials, where the phase-contrast enhancement arising from density variations at sample boundaries is overwhelmed by abundant high-energy photons, thereby weakening the brightness contrast at material boundaries. Notably, the fluctuation range of contrast decreases with increasing
${E}_{\mathrm{c}}$
 , indicating that boundary details can be observed more stably and reliably under high SNR conditions. In betatron radiation phase-contrast imaging applications, a higher critical energy is not always preferable. Instead, the X-ray energy should be selected to match the imaging sample, balancing the SNR and image contrast to achieve high-quality imaging.
Geant4-simulated imaging results at time
${t}_1$
 for different betatron radiation parameters. (a) Intensity distribution curves along the central axis for different critical energies with an input photon number of
$2\times {10}^9$
 . (b) Corresponding imaging signal-to-noise ratio and contrast analysis at different boundary positions for the various critical energies shown in (a); error bars represent the mean and standard deviation of contrast. (c) Intensity distribution curves along the central axis for different photon numbers with a critical energy of 15 keV. (d) Corresponding imaging signal-to-noise ratio and contrast analysis at different boundary positions for the various photon numbers shown in (c).

Figure 5 Long description
Panel a. A line graph of Mean Intensity in counts versus x in pixel. Five noisy curves represent critical energies from 5 k e V to 25 k e V. The curves show a central plateau between 250 and 850 pixels with sharp peaks at the boundaries. Higher critical energy correlates with higher mean intensity across the entire x-axis range.
Panel b. A dual-axis plot showing S N R and Contrast versus E sub c in k e V. The left y-axis is S N R (I sub mean over I sub std) in red, showing a logarithmic-like increase from approximately 28 to 42. The right y-axis is Contrast (I sub max minus I sub min over I sub max plus I sub min) in blue, showing a linear decrease from 0.8 to 0.3 with error bars.
Panel c. A line graph of Mean Intensity in counts versus x in pixel for a fixed 15 k e V energy. Six curves represent photon numbers from 5.8 times 10 super 8 to 4.0 times 10 super 9. The vertical intensity levels increase proportionally with the input photon number while maintaining the same spatial profile shape.
Panel d. A dual-axis plot showing S N R and Contrast versus N sub phs. The red S N R curve shows a linear increase from 20 to nearly 60 as photon number increases. The blue Contrast curve remains nearly horizontal at a value of approximately 0.45 across all photon numbers.
Subsequently, the effects of the photon number on the imaging SNR and contrast were investigated under a moderate critical energy of 15 keV. As depicted in Figures 5(c) and 5(d), both the background intensity and the intensity transmitted through the sample increase with rising photon number. The imaging SNR increases almost linearly with the photon number, while the image contrast remains relatively stable within the range of 0.4–0.5. This demonstrates that the photon number does not significantly alter the boundary contrast characteristics of the image, and a higher photon number generally leads to better imaging performance. Through parameter scanning over a broad range of betatron radiation parameters, when the laser peak power reaches the hundred-terawatt or even multi-petawatt level, betatron radiation with a photon number exceeding
${10}^9$
 and a critical energy exceeding 13 keV can be stably generated over a wide range of normalized intensity
${a}_0$
 , meeting the basic requirements of photon flux and penetration capability for typical imaging applications.
In practical X-ray imaging applications, betatron radiation sources exhibit shot-to-shot pointing fluctuations, typically of the order of 1–3 mrad[ Reference Guo, Zhang, Zhang, Hua, Pai, Zhang, Chu, Mori, Joshi, Wang and Lu 25 ]. In our designed beam-splitting mirror system, the angular separation between the generated sub-beams of X-rays exceeds 40 mrad, which is significantly larger than the pointing fluctuation range of the radiation source. Therefore, even with shot-to-shot pointing variations, no overlapping of multiple image frames occurs. Furthermore, the effects of pointing fluctuations on imaging quality can be mitigated either through experimental optimization of the injection scheme or via image post-processing techniques such as normalized cross-correlation, enabling phase-contrast imaging at micrometer-scale resolution[ Reference Wenz, Schleede, Khrennikov, Bech, Thibault, Heigoldt, Pfeiffer and Karsch 24 , Reference Durbin, Clevenger, Graber and Henning 53 ].
4 Conclusion
Compared to traditional X-ray streak cameras, this approach achieves micrometer-level spatial resolution and femtosecond-to-picosecond temporal resolution without relying on ultrafast scintillators or complex temporal gating systems. Geometric beam-splitting and angular multiplexing techniques are employed to effectively prevent image aliasing, ensuring the independence and integrity of images at each time frame. Simulations of the radiation source and imaging performance demonstrate that this multi-pulse, multi-angle imaging scheme, based on betatron X-ray sources and beam-splitting optical design, can be applied to diagnose transient extreme physical processes. This scheme addresses key limitations in ultrafast diagnostics, including the pump–probe dependence and detector response times of current methods, as well as the low repetition rates of petawatt lasers. Consequently, it combines high temporal-spatial resolution with a novel design to achieve continuous dynamic imaging of previously inaccessible transient extreme events.
Acknowledgements
This work was supported by the National Key Research and Development Program of China (Grant No. 2025YFF0515000), the Strategic Priority Research Program of the Chinese Academy of Sciences (Grant No. XDB0890200), the National Natural Science Foundation of China (Grant Nos. 12225411, 12388102 and 12474349), the CAS Project for Young Scientists in Basic Research (Grant No. YSBR060), the CAS Youth Innovation Promotion Association (Grant No. 2022242) and the New Cornerstone Science Foundation through the Xplorer Prize.







 Open access

