Introduction
Schizophrenia (SZ) and bipolar disorder (BD) are debilitating psychiatric disorders that affect approximately 1% of the population worldwide (McGrath et al. Reference McGrath, Saha, Chant and Welham2008). Since 2007, when differential expression of microRNAs (miRNAs) in postmortem brain tissue from psychiatric patients and normal controls was assessed (Perkins et al. Reference Perkins, Jeffries, Jarskog, Thomson, Woods, Newman, Parker, Jin and Hammond2007) for the first time, increasing evidence from follow-up expression studies (Beveridge et al. Reference Beveridge, Tooney, Carroll, Gardiner, Bowden, Scott, Tran, Dedova and Cairns2008; Kim et al. Reference Kim, Reimers, Maher, Williamson, McMichael, McClay, van den Oord, Riley, Kendler and Vladimirov2010; Santarelli et al. Reference Santarelli, Beveridge, Tooney and Cairns2011; Miller et al. Reference Miller, Zeier, Xi, Lanz, Deng, Strathmann, Willoughby, Kenny, Elsworth, Lawrence, Roth, Edbauer, Kleiman and Wahlested2013) conducted in postmortem brain tissue of SZ and BD patients as well as recent genome-wide association studies (GWAS) (PGC, 2011; Ripke et al. Reference Ripke, O'Dushlaine, Chambert, Moran, Kahler, Akterin, Bergen, Collins, Crowley, Fromer, Kim, Lee, Magnusson, Sanchez, Stahl, Williams, Wray, Xia, Bettella, Borglum, Bulik-Sullivan, Cormican, Craddock, de Leeuw, Durmishi, Gill, Golimbet, Hamshere, Holmans, Hougaard, Kendler, Lin, Morris, Mors, Mortensen, Neale, O'Neill, Owen, Milovancevic, Posthuma, Powell, Richards, Riley, Ruderfer, Rujescu, Sigurdsson, Silagadze, Smit, Stefansson, Steinberg, Suvisaari, Tosato, Verhage, Walters, Levinson, Gejman, Kendler, Laurent, Mowry, O'Donovan, Owen, Pulver, Riley, Schwab, Wildenauer, Dudbridge, Holmans, Shi, Albus, Alexander, Campion, Cohen, Dikeos, Duan, Eichhammer, Godard, Hansen, Lerer, Liang, Maier, Mallet, Nertney, Nestadt, Norton, O'Neill, Papadimitriou, Ribble, Sanders, Silverman, Walsh, Williams, Wormley, Arranz, Bakker, Bender, Bramon, Collier, Crespo-Facorro, Hall, Iyegbe, Jablensky, Kahn, Kalaydjieva, Lawrie, Lewis, Lin, Linszen, Mata, McIntosh, Murray, Ophoff, Powell, Rujescu, Van Os, Walshe, Weisbrod, Wiersma, Donnelly, Barroso, Blackwell, Bramon, Brown, Casas, Corvin, Deloukas, Duncanson, Jankowski, Markus, Mathew, Palmer, Plomin, Rautanen, Sawcer, Trembath, Viswanathan, Wood, Spencer, Band, Bellenguez, Freeman, Hellenthal, Giannoulatou, Pirinen, Pearson, Strange, Su, Vukcevic, Donnelly, Langford, Hunt, Edkins, Gwilliam, Blackburn, Bumpstead, Dronov, Gillman, Gray, Hammond, Jayakumar, McCann, Liddle, Potter, Ravindrarajah, Ricketts, Tashakkori-Ghanbaria, Waller, Weston, Widaa, Whittaker, Barroso, Deloukas, Mathew, Blackwell, Brown, Corvin, McCarthy, Spencer, Bramon, Corvin, O'Donovan, Stefansson, Scolnick, Purcell, McCarroll, Sklar, Hultman and Sullivan2013, Reference Ripke, Neale, Corvin, Walters, Farh and Holmans2014) have implicated miRNAs to play a role in SZ and BD etiology. miRNAs are small single-stranded RNA molecules that mainly downregulate protein-coding genes by binding to the gene's 3′ untranslated region (UTR) (Forero et al. Reference Forero, van der Ven, Callaerts and Del-Favero2010) through a variety of mechanisms, including mRNA cleavage and degradation, translational inhibition, and shortening of the mRNA poly tail (Filipowicz et al. Reference Filipowicz, Bhattacharyya and Sonenberg2008).
In 2013, the Psychiatric Genetic Consortium (PGC) published the largest GWAS to date with an initial discovery sample of 21 856 individuals and a replication sample of 29 839 individuals (Ripke et al. Reference Ripke, O'Dushlaine, Chambert, Moran, Kahler, Akterin, Bergen, Collins, Crowley, Fromer, Kim, Lee, Magnusson, Sanchez, Stahl, Williams, Wray, Xia, Bettella, Borglum, Bulik-Sullivan, Cormican, Craddock, de Leeuw, Durmishi, Gill, Golimbet, Hamshere, Holmans, Hougaard, Kendler, Lin, Morris, Mors, Mortensen, Neale, O'Neill, Owen, Milovancevic, Posthuma, Powell, Richards, Riley, Ruderfer, Rujescu, Sigurdsson, Silagadze, Smit, Stefansson, Steinberg, Suvisaari, Tosato, Verhage, Walters, Levinson, Gejman, Kendler, Laurent, Mowry, O'Donovan, Owen, Pulver, Riley, Schwab, Wildenauer, Dudbridge, Holmans, Shi, Albus, Alexander, Campion, Cohen, Dikeos, Duan, Eichhammer, Godard, Hansen, Lerer, Liang, Maier, Mallet, Nertney, Nestadt, Norton, O'Neill, Papadimitriou, Ribble, Sanders, Silverman, Walsh, Williams, Wormley, Arranz, Bakker, Bender, Bramon, Collier, Crespo-Facorro, Hall, Iyegbe, Jablensky, Kahn, Kalaydjieva, Lawrie, Lewis, Lin, Linszen, Mata, McIntosh, Murray, Ophoff, Powell, Rujescu, Van Os, Walshe, Weisbrod, Wiersma, Donnelly, Barroso, Blackwell, Bramon, Brown, Casas, Corvin, Deloukas, Duncanson, Jankowski, Markus, Mathew, Palmer, Plomin, Rautanen, Sawcer, Trembath, Viswanathan, Wood, Spencer, Band, Bellenguez, Freeman, Hellenthal, Giannoulatou, Pirinen, Pearson, Strange, Su, Vukcevic, Donnelly, Langford, Hunt, Edkins, Gwilliam, Blackburn, Bumpstead, Dronov, Gillman, Gray, Hammond, Jayakumar, McCann, Liddle, Potter, Ravindrarajah, Ricketts, Tashakkori-Ghanbaria, Waller, Weston, Widaa, Whittaker, Barroso, Deloukas, Mathew, Blackwell, Brown, Corvin, McCarthy, Spencer, Bramon, Corvin, O'Donovan, Stefansson, Scolnick, Purcell, McCarroll, Sklar, Hultman and Sullivan2013). Their strongest finding was located in the primary transcript of hsa-miR-137 (miR-137). Other genes, predicted as targets of miR-137, were also noted as achieving genome-wide significance; the predicted relationship between miR-137 and these genes has since been experimentally verified (Kim et al. Reference Kim, Parker, Williamson, McMichael, Fanous and Vladimirov2012; Kwon et al. Reference Kwon, Wang and Tsai2013; Collins et al. Reference Collins, Kim, Bloom, Kelada, Sethupathy and Sullivan2014). A second PGC study, utilizing an even larger sample size than the first, identified over 108 genome-wide significant signals, many of which also mapped to additional miRNA genes with neurodevelopmental function such as hsa-miR-640, -135a, -4304 and let-7g (Ripke et al. Reference Ripke, Neale, Corvin, Walters, Farh and Holmans2014). To our knowledge, however, no one has attempted to link aberrant miRNA expression from postmortem studies to significant genetic association signals identified in the PGC GWAS. Expression quantitative trait loci (eQTL) analysis offers a relatively straightforward approach to this task by linking genetic variants with gene expression (Westra & Franke, Reference Westra and Franke2014). Moreover, specific testable hypotheses can be drawn from the significant associations found between variants and molecular features as eQTLs were shown to be also tissue- and cell-specific and to exhibit conserved effect sizes across major population groups (Stranger et al. Reference Stranger, Montgomery, Dimas, Parts, Stegle, Ingle, Sekowska, Smith, Evans, Gutierrez-Arcelus, Price, Raj, Nisbett, Nica, Beazley, Durbin, Deloukas and Dermitzakis2012). miRNA-linked eQTLs, in particular, have been shown to be associated with the expression of complex phenotypic traits (Nicolae et al. Reference Nicolae, Gamazon, Zhang, Duan, Dolan and Cox2010; Gamazon et al. Reference Gamazon, Ziliak, Im, LaCroix, Park, Cox and Huang2012). miRNA-linked eQTLs can impact on miRNA cellular function either directly through modification of the miRNA expression (Hansen et al. Reference Hansen, Olsen, Lindow, Jakobsen, Ullum, Jonsson, Andreassen, Djurovic, Melle, Agartz, Hall, Timm, Wang and Werge2007; Feng et al. Reference Feng, Sun, Yan, Noltner, Li, Buzin, Longmate, Heston, Rossi and Sommer2009; Xu et al. Reference Xu, Li, Zhang, Zhang, Zhang, Huang, Sun, Ren, Sui and Liu2010) or indirectly by impacting on the miRNA-binding activity to its target transcripts (Nicolae et al. Reference Nicolae, Gamazon, Zhang, Duan, Dolan and Cox2010; Gamazon et al. Reference Gamazon, Ziliak, Im, LaCroix, Park, Cox and Huang2012). In this study, we attempt to generate specific hypotheses regarding the genetic signals observed in the latest PGC GWAS and their connection to miRNAs by employing a two-stage approach. First, we ask whether GWAS signals observed in the PGC dataset are enriched for single nucleotide polymorphisms (SNPs) in linkage disequilibrium (LD, R 2 > 0.8) with known miRNA precursors. Second, in a 1 Mb region flanking those miRNAs for which enrichment was detected, we ask, whether any of those specific SNPs function as eQTLs for miRNA expression. Multiple authors have noted already the enrichment of eQTLs among top GWAS findings in a wide variety of disorders, including SZ, diabetes, and specific types of cancer (Nicolae et al. Reference Nicolae, Gamazon, Zhang, Duan, Dolan and Cox2010; Richards et al. Reference Richards, Jones, Moskvina, Kirov, Gejman, Levinson, Sanders, Purcell, Visscher, Craddock, Owen, Holmans and O'Donovan2012; Bacanu et al. Reference Bacanu, Chen, Sun, Richardson, Lai, Zhao, O'Donovan, Kendler and Chen2014; Jiang et al. Reference Jiang, Jia, Shen and Zhao2014; Roussos et al. Reference Roussos, Mitchell, Voloudakis, Fullard, Pothula, Tsang, Stahl, Georgakopoulos, Ruderfer, Charney, Okada, Siminovitch, Worthington, Padyukov, Klareskog, Gregersen, Plenge, Raychaudhuri, Fromer, Purcell, Brennand, Robakis, Schadt, Akbarian and Sklar2014; Zhang et al. Reference Zhang, Gierman, Levy, Plump, Dobrin, Goring, Curran, Johnson, Blangero, Kim, O'Donnell, Emilsson and Johnson2014). In this study we test two hypotheses: (1) that PGC GWAS signals are enriched for miRNA-linked eQTLs and (2) that by identifying the relationship between these genetic factors, the miRNAs and their respective gene targets, we can identify gene pathways of functional relevance to the pathophysiology of SZ and BD. Aberrant miRNA expression, especially during neurodevelopment, can modulate the expression of target protein-coding genes, which being themselves linked to the pathophysiology of SZ and BD as originally shown by PGC (PGC, 2011) could offer a novel etiological mechanism of disease development.
Method
Detection of SNP enrichment
All autosomal tag SNPs (Plink v1.07, R 2 = 0.8) (Purcell et al. Reference Purcell, Neale, Todd-Brown, Thomas, Ferreira, Bender, Maller, Sklar, de Bakker, Daly and Sham2007) found locally, within a 1 Mb region flanking known miRNA precursor sequences (N = 1881, miRBase v21) (Kozomara & Griffiths-Jones, Reference Kozomara and Griffiths-Jones2014) were extracted and tested for enrichment in association signals over the PGC GWAS background using the Simes and sum of squares (SST) tests (see Supplementary material). Additionally, in order to identify potential confounders that may influence the level of GWAS enrichment, we performed bioinformatic analysis of the selected tag SNPs in our dataset. SNPs were excluded from our list if they were found to be located in highly conserved regions, predicted to have detrimental protein effects (Adzhubei et al. Reference Adzhubei, Jordan and Sunyaev2013) or if they mapped to highly conserved transcription factor binding sites.
To determine whether the miRNA location affects the level of enrichment, miRNAs were categorized as intergenic and intragenic (Down & Hubbard, Reference Down and Hubbard2002). Intergenic miRNAs are located outside of the boundaries of protein-coding genes; intragenic miRNAs are located within the boundaries of an annotated protein-coding gene, including those found within the 5′- and 3′-UTRs, and in the exonic and intronic regions of the gene. Intergenic miRNAs have been noted to possess an independent source of transcription, whereas intragenic miRNAs are often thought to share promoter sequences with the protein-coding genes that host them (Gromak, Reference Gromak2012; Ramalingam et al. Reference Ramalingam, Palanichamy, Singh, Das, Bhagat, Kassab, Sinha and Chattopadhyay2014). It is worth noting that knowledge of transcription start sites (TSS) for the intragenic miRNAs has been based on bioinformatic prediction and the full range of the predicted miRNA TSS have not yet been fully validated experimentally (Saini et al. Reference Saini, Griffiths-Jones and Enright2007). Indeed, recent experimental work using chromatin-based assays and miRNA cloning into empty promoter sequences have suggested that some intragenic miRNAs may have TSS that are transcribed by polymerases II and III (Pol II, Pol III) independently of their host gene (Borchert et al. Reference Borchert, Lanier and Davidson2006; Monteys et al. Reference Monteys, Spengler, Wan, Tecedor, Lennox, Xing and Davidson2010). However, the data are still inconclusive and therefore, we believe that to assess the level of SNP enrichment separately based on this distinction alone would be premature without a full-scale validation of the TSS of known miRNAs and would also lead to a substantial reduction on statistical power. We do, however, draw a distinction between eQTLs associated with intergenic v. intragenic miRNAs in our pathway enrichment analysis. Our rationale for this distinction is based on the potential confounding effect of miRNA location on its host gene; it is possible an eQTL affecting the expression of intragenic miRNA to also affect the expression of its host protein-coding gene. The distance parameters employed for determining whether a SNP is a ‘local’ or a cis-eQTL are based on previous studies in which cis-eQTLs have been identified (Gamazon et al. Reference Gamazon, Ziliak, Im, LaCroix, Park, Cox and Huang2012, Reference Gamazon, Badner, Cheng, Zhang, Zhang, Cox, Gershon, Kelsoe, Greenwood, Nievergelt, Chen, McKinney, Shilling, Schork, Smith, Bloss, Nurnberger, Edenberg, Foroud, Koller, Scheftner, Coryell, Rice, Lawson, Nwulia, Hipolito, Byerley, McMahon, Schulze, Berrettini, Potash, Zandi, Mahon, McInnis, Zöllner, Zhang, Craig, Szelinger, Barrett and Liu2013a , b).
Data integration and genotype processing
All available genotypes were downloaded from the Stanley Online Genomics Database (Kim & Webster, Reference Kim and Webster2010) and filtered with PLINK v1.02 (Supplementary material). Subjects having genotypes and miRNA expression values (Kim et al. Reference Kim, Reimers, Maher, Williamson, McMichael, McClay, van den Oord, Riley, Kendler and Vladimirov2010) were matched on the basis of gender, age, postmortem interval (PMI), brain pH, DSM-IV diagnosis, and gender. After applying a stringent quality control (QC) to the available genotype data, a total of 78 subjects (SZ = 27, BD = 29, controls = 22) were retained. Specific demographic information for these subjects can be found in online Supplementary Table S1. Imputation was performed on the original genotypes to make the GWAS panel used in the structural magnetic resonance imaging (sMRI) study more comparable to that used by the PGC (Supplementary material). A total of 309 531 SNPs in the sMRI GWAS was used to generate additional 332 271 genotypes meeting study criteria leading to a final count of 641 802 genotypes.
eQTL detection
eQTLs were detected using an additive model and accounting for the potential effect of age, brain pH, race, gender, DSM-IV classification, PMI and RNA integrity number (RIN) on miRNA expression. Those SNPs having missing data and/or a low minor allele frequency (MAF < 0.02) in the sMRI GWAS were not considered in the eQTL analysis. SNPs were coded as 0 (homozygous for the major allele), 1 (heterozygous) and 2 (homozygous for the minor allele) for evaluation in a linear regression model implemented by the R package Matrix EQTL (Shabalin, Reference Shabalin2012); p values were corrected for multiple testing based on the number of SNPs within the 1 Mb region flanking of each individual miRNA that were tested in the enrichment stage at a false discovery rate (FDR) of 10%. We chose to focus exclusively on ‘local’ cis-eQTLs located within 1 Mb of the individual miRNA; by being closer to the gene of interest these have a greater chance to affect the overall level of expression than more distant (trans) eQTLs. A total of 2567 SNPs from the PGC dataset were evaluated in this manner.
Target prediction and pathway assessment
High-quality targets were predicted for all miRNAs for which a significant eQTL was identified (FDR < 0.1), using a consensus-based software approach in MiRWalk 2.0 (Dweep et al. Reference Dweep, Sticht, Pandey and Gretz2011). MiRWalk 2.0 is a highly regarded software/database archive that documents predictions from 12 independent prediction algorithms, including DIANA-microTv4.0 (Maragkakis et al. Reference Maragkakis, Vergoulis, Alexiou, Reczko, Plomaritou, Gousis, Kourtis, Koziris, Dalamagas and Hatzigeorgiou2011), DIANA-microT-CDS (Paraskevopoulou et al. Reference Paraskevopoulou, Georgakilas, Kostoulas, Vlachos, Vergoulis, Reczko, Filippidis, Dalamagas and Hatzigeorgiou2013), miRanda-rel2010 (Betel et al. Reference Betel, Koppal, Agius, Sander and Leslie2010), mirBridge (Tsang et al. Reference Tsang, Ebert and van Oudenaarden2010), miRDB4.0 (Wang and El Naqa, 2008), miRmap (Vejnar et al. Reference Vejnar, Blum and Zdobnov2013), miRNAMap (Hsu et al. Reference Hsu, Chu, Tsou, Chen, Chen, Hsu, Wong, Chen, Chen and Huang2008), doRiNA (Blin et al. Reference Blin, Dieterich, Wurmus, Rajewsky, Landthaler and Akalin2015), PITA (Kertesz et al. Reference Kertesz, Iovino, Unnerstall, Gaul and Segal2007), PICTAR2 (Krek et al. Reference Krek, Grun, Poy, Wolf, Rosenberg, Epstein, MacMenamin, da Piedade, Gunsalus, Stoffel and Rajewsky2005), RNAhybrid (Rehmsmeier et al. Reference Rehmsmeier, Steffen, Hochsmann and Giegerich2004), and Targetscan (Grimson et al. Reference Grimson, Farh, Johnston, Garrett-Engele, Lim and Bartel2007). MiRWalk 2.0 combines the information from these platforms to build miRNA target predictions in the promoter region, coding sequences, 5′- and 3′-UTRs. A consensus-based approach to target prediction has been recently suggested to be more useful since it minimizes the occurrence of false positives (Zhang & Verbeek, Reference Zhang and Verbeek2010; Pio et al. Reference Pio, Malerba, D'Elia and Ceci2014; Yu et al. Reference Yu, Kim, Min and Yoon2014). Targets for each miRNA were selected if they had a seed length ≥7 bases, were located with the gene's 3′-UTR and if the same binding site was predicted in ≥6 of the software systems that MiRWalk archives.
Using these targets, we analyzed the pathway enrichment using the human Wiki Pathways dataset, April 2014 release (Kelder et al. Reference Kelder, van Iersel, Hanspers, Kutmon, Conklin, Evelo and Pico2012). We first identified all genes targeted by miRNAs with significant cis-eQTLs which were then organized into gene pathways enriched for these miRNAs; second, the gene pathways were further assessed to identify pathways specifically enriched for the intragenic or intergenic miRNAs only. Pathway enrichment, at both stages, was determined using a hypergeometric test and correction for multiple testing was performed using methods outlined by Benjamini and Hochberg (Benjamini & Hochberg, Reference Benjamini and Hochberg1995).
Results
Detection of SNP enrichment
Of the 2567 selected SNPs, four were shown by PolyPhen2 to be potentially impactful to mRNA/miRNA expression (score > 0.4). Furthermore, bioinformatic assessment of using SNPINFO (Xu & Taylor, Reference Xu and Taylor2009) indicated that the majority of SNPs had no clear predicted biological function related to the regulation of gene expression, with the exception of few being associated with conserved transcription factor binding sites (online Supplementary Table S2). We therefore believe that there was no other biological effect exerted by the SNPs on the level of enrichment other than through their relationship with the miRNAs.
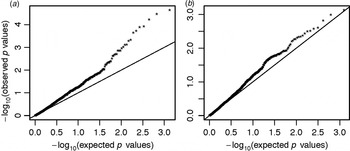
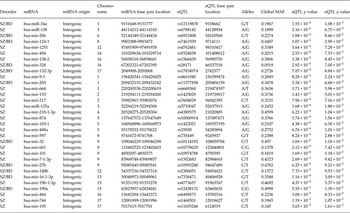
Based on the Simes test, enrichment of miRNA SNPs associated with both SZ (p = 0.0023; Fig. 1a ) and to a lesser extent with BD (p = 0.038, Fig. 1b ) was detected. After applying the SST, which adjusts for the overall background enrichment of GWAS signals, the enrichment for SZ remained significant (empirical p = 0.018), while the enrichment for BD was suggestive (empirical p = 0.07). Detailed description of these two statistical approaches are provided in the online Supplementary material. The types of miRNAs that these SNPs tagged were roughly 2:1 (23 intragenic: nine intergenic miRNAs; Table 1), suggesting that, the source of the signal may have also originated from the mRNA genes that harbor them. However, despite the belief that intragenic miRNAs share promoters with their host mRNAs, recent studies suggest that this may not be entirely correct with some miRNAs such as hsa-miR-128-2 contain their own transcription regulatory elements (Ozsolak et al. Reference Ozsolak, Poling, Wang, Liu, Liu, Roeder, Zhang, Song and Fisher2008; Monteys et al. Reference Monteys, Spengler, Wan, Tecedor, Lennox, Xing and Davidson2010). Therefore, to maximize our power, we have chosen to analyze both sets of SNPs as a single unit; however, as there might be distinct biological implications for the genes targeted by the intergenic v. intragenic miRNAs, thus we drew a clear distinction between these two classes of miRNAs when performing the pathway analysis.
Quantile–quantile (QQ) plot of the genome-wide association studies signals enrichment among the miRNA expression quantitative trait loci in schizophrenia (SZ) and bipolar disorder (BD). The expected –log10 p values under the null hypothesis are represented on the x axis, while the observed values are represented on the y axis. (a) Shows the enrichment for SZ single nucleotide polymorphisms (SNPs) and (b) for BD SNPs.

A master table showing pertinent information to the detection of 32 eQTLs and the miRNAs to which they are linked

eQTL, Expression quantitative trait loci; miRNA, microRNA; MAF, minor allele frequency; SZ, schizophrenia; BD, bipolar disorder.
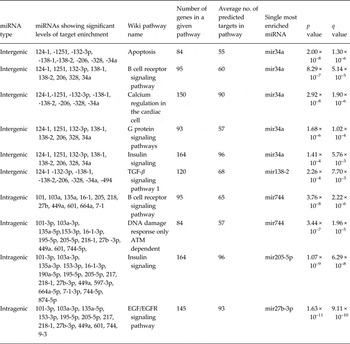
Of the 632 human pathways currently listed on WikiPathways, 588 showed significant enrichment of the genes predicted to be targets for the 32 miRNAs (q < 0.01). The pathways that demonstrated significant enrichment for intergenic miRNAs involved: (1) apoptosis, (p = 2.00 × 10⁻⁸, q = 1.30 × 10⁻⁶), (2) B cell receptor signaling pathway (p = 8.29 × 10⁻⁷, q = 5.14 × 10⁻⁵), (3) calcium signaling in cardiac cells (p = 2.92 × 10⁻⁸, q = 1.90 × 10⁻⁶), (4) G protein signaling (p = 1.68 × 10⁻⁶, q = 1.02 × 10⁻⁴), (5) insulin signaling (p = 1.41 × 10⁻⁴, q = 5.76 × 10⁻³), and (6) transforming growth factor beta (TGF-β) signaling (p = 2.26 × 10⁻⁴, q = 7.70 × 10⁻³). The pathways that demonstrated significant enrichment for intragenic miRNAs involved: (1) B cell receptor signaling (p = 3.76 × 10⁻⁸, q = 2.22 × 10⁻⁶), (2) DNA damage dependent ataxia telangiectasia, mutated (ATM) only (p = 3.44 × 10⁻⁷, q = 1.96 × 10⁻⁵), (3) insulin signaling (p = 1.07 × 10⁻⁹, q = 6.29 × 10⁻⁸) and (4) epidermal growth factor (EGF)/epidermal growth factor receptor (EGFR) signaling (p = 1.63 × 10⁻¹¹, q = 9.11 × 10⁻¹⁰). Table 2 provides information describing all of the significantly enriched pathways.
A summary table showing the enriched pathways predicted to be targeted by the 32 miRNAs

miRNA, MicroRNA; TGF-β, transforming growth factor beta; ATM, ataxia telangiectasia, mutated; EGFR, epidermal growth factor receptor.
eQTL mapping surrounding miRNAs
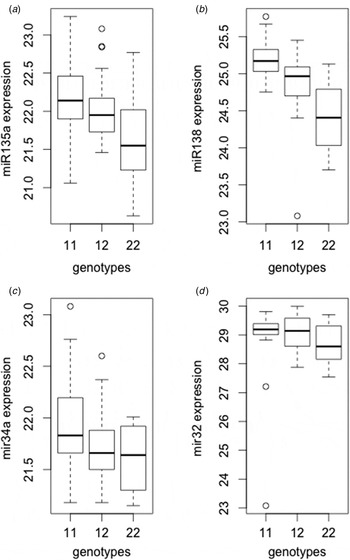
Within our enriched group of SNPs used in stage 1, we identified 116 SNPs to act as miRNA eQTLs at the nominal p ≤ 0.05 of which 32 eQTLs remained significant following FDR correction at 10%. Of these 32 miRNA eQTLs, all were found to relate to SZ and 11 overlapped with BD. Our most significant SZ eQTL, rs3733047 (p = 1.68 ×10⁻⁶, q = 0.001876; Fig. 2a ) was shown to affect the expression of hsa-miR-135a, which in a recent study was shown to be differentially expressed during the normal brain development (Moreau et al. Reference Moreau, Bruse, Jornsten, Liu and Brzustowicz2013). Rs3733047 is located in a transcription factor binding site for GATA2 which regulates neuronal differentiation and has been found upregulated in the prefrontal cortex of SZ subjects (Miller et al. Reference Miller, Zeier, Xi, Lanz, Deng, Strathmann, Willoughby, Kenny, Elsworth, Lawrence, Roth, Edbauer, Kleiman and Wahlested2013). The second most significant SZ eQTL finding (rs6788142, p = 2.16 × 10⁻⁶, q = 0.006754; Fig. 2b ) affects the expression of hsa-mir-138-1 (miR-138). miR-138 has been shown to decrease the amplitude of postsynaptic currents, negatively regulating spine size in mouse and rat studies (Olsen et al. Reference Olsen, Klausen, Helboe, Nielsen and Werge2009). The most significant BD eQTL, rs12119878 (p = 0.001549, q = 0.010845; Fig. 2c ) was shown to affect the expression of hsa-miR-34a (miR-34a). An increased level of this miRNA was recently identified in the postmortem cerebellar tissue of BD patients (Bavamian et al. Reference Bavamian, Mellios, Lalonde, Fass, Wang, Sheridan, Madison, Zhou, Rueckert, Barker, Perlis, Sur and Haggarty2015); increased miR-34a expression in human iPSC-derived neuronal progenitor cells impacts neuronal differentiation and morphology. The second most significant BD related finding was rs10114192 (p = 0.016858, q = 0.0118006; Fig. 2d ) that affected the expression of hsa-miR-32 and this miRNA was shown to be differentially expressed in post-mortem brains exclusively between BD patients and controls and not in SZ patients (Miller et al. Reference Miller, Zeier, Xi, Lanz, Deng, Strathmann, Willoughby, Kenny, Elsworth, Lawrence, Roth, Edbauer, Kleiman and Wahlested2013).
Boxplots showing the relationship between single nucleotide polymorphism genotype and miRNA expression for the two most significant schizophrenia (SZ) and bipolar disorder (BD) expression quantitative trait loci (eQTLs). (a) and (b) show SZ-related eQTLs, while (c) and (d) show BD-related eQTLs.

Other notable individual eQTLs include rs10993280 (p = 0.00062592, q = 0.09213) on chromosome 9 and rs7338471 (p = 0.000116, q = 0.030872) and rs4773657 (p = 0.000437, q = 0.05369) on chromosome 13. Rs10993280 is an eQTL for the hsa-miR-23b, -24-1, and -27b cluster on chromosome 9, while rs7338471 affected the expression of the hsa-miR-15a, and -16 cluster and rs4773657 is an eQTL for the hsa-19b-1, -17, -18a, -20a, and -92a cluster on chromosome 13.
Four eQTLs, rs4389575 (p = 0.000622, q = 0.001036), rs35930 (p = 0.000676, q = 0.010133), rs4661040 (p = 0.005786, q = 0.098362) and rs1422021 (p = 0.000438, q = 0.065754) were associated with the expression of four intragenic miRNAs; these miRNAs (hsa-mir-218-1, -449a, -9-1, and -103-1) have been experimentally shown to target their respective host genes (Wilfred et al. Reference Wilfred, Wang and Nelson2007; Bazzoni et al. Reference Bazzoni, Rossato, Fabbri, Gaudiosi, Mirolo, Mori, Tamassia, Mantovani, Cassatella and Locati2009; Lize et al. Reference Lize, Pilarski and Dobbelstein2010; Fish et al. Reference Fish, Wythe, Xiao, Bruneau, Stainier, Srivastava and Woo2011). A list of all 32 eQTLs affecting the expression of their respective miRNAs is given in Table 1. To further ensure the validity of our results as true signals, we compared our eQTLs against the Brain eQTL Almanac (Ramasamy et al. Reference Ramasamy, Trabzuni, Guelfi, Varghese, Smith, Walker, De, Coin, de Silva, Cookson, Singleton, Hardy, Ryten and Weale2014); we found 82.1% of our eQTLs to be also reported in this database.
Discussion
In this paper, we present results from a two-stage study that attempts to determine whether SNPs located in close proximity to miRNAs could be enriched for a SZ and BD association signal and whether these SNPs could function as eQTLs for the miRNAs to which they are co-localized. Our approach used the enrichment we detected in the PGC results as guidance for further fine mapping of the same variants in an eQTL analysis of postmortem brain samples from SZ and BD subjects. Our goal with the eQTL analysis in this study is to generate specific testable hypotheses that address the relationship between the observed GWAS signals and the miRNAs location, suggesting the potential impact this relationship might have on the targeted mRNA gene pathways.
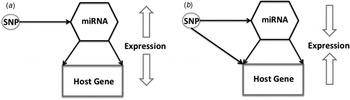
Among these eQTLs, we speculate about two potential pathways by which a GWAS variant can interact with a miRNA in SZ and/or BD (pictured in Fig. 3). We show that SZ and BD significant SNPs could directly influence miRNA expression; however, the manner in which the SNP interacts with the miRNA might differ depending on the miRNA's origin. miRNAs in the intergenic category might be more strongly affected by an eQTL that would result in detectable levels of differential expression in postmortem expression studies because of the absence of other involved factors mediating this relationship. Of the miRNAs that fell into this group, it is important to note that hsa-miR-132, -34a, -124, -206 and -328 have been reported previously by other researchers to be associated with SZ/BD (Guo et al. Reference Guo, Sun, Jia and Zhao2010; Kim et al. Reference Kim, Reimers, Maher, Williamson, McMichael, McClay, van den Oord, Riley, Kendler and Vladimirov2010; Lai et al. Reference Lai, Yu, Hsieh, Chen, Chen, Wen, Huang, Hsiao, Hsiao, Liu, Yang, Hwu and Chen2011; Miller et al. Reference Miller, Zeier, Xi, Lanz, Deng, Strathmann, Willoughby, Kenny, Elsworth, Lawrence, Roth, Edbauer, Kleiman and Wahlested2013; Sun et al. Reference Sun, Lu, Zhang, Song, Zhao, Fan, Zhong, Niu, Guo, Dai, Chen, Ding and Zhang2015) in either postmortem expression studies or through genetic association. Furthermore, miRNAs within this class have been reported to be highly expressed in the brain, with miR-124 and -138 both being neurally specific and responsible for the differentiation of neural stem cells into neurons (Banerjee et al. Reference Banerjee, Neveu and Kosik2009; Akerblom et al. Reference Akerblom, Sachdeva, Barde, Verp, Gentner, Trono and Jakobsson2012; Petri et al. Reference Petri, Malmevik, Fasching, Akerblom and Jakobsson2014). Finally, hsa-miR-34a and -206, have also been noted to be responsive to mood stabilizers such as lithium and sodium valproate that provide support for their roles in SZ and BD (Hunsberger et al. Reference Hunsberger, Fessler, Chibane, Leng, Maric, Elkahloun and Chuang2013; Wang et al. Reference Wang, Zhang, Huang, Yuan, Hong, Chen, Yu, Xu, Gao and Fang2014). The significantly enriched gene pathways unique to this group of miRNAs include the G protein signaling pathway and TGF-β signaling. Both of these pathways have been implicated in SZ and BD through risk genes in association studies, namely the G-protein-coupled receptors (GPCRs) (Funk et al. Reference Funk, Haroutunian, Meador-Woodruff and McCullumsmith2014) and ZNF804 (Umeda-Yano et al. Reference Umeda-Yano, Hashimoto, Yamamori, Okada, Yasuda, Ohi, Fukumoto, Ito and Takeda2013; Pietersen et al. Reference Pietersen, Mauney, Kim, Lim, Rooney, Goldstein, Petryshen, Seidman, Shenton, McCarley, Sonntag and Woo2014). GPCRs represent nearly half of the therapeutic drug targets in neuropsychiatric research today (Bridges & Lindsley, Reference Bridges and Lindsley2008). Both, hsa-miR-328 and some of its gene targets belonging to the TGF-β signaling pathway were also recently shown to be differentially expressed in laser-captured pyramidal neurons found in SZ subjects (Pietersen et al. Reference Pietersen, Mauney, Kim, Lim, Rooney, Goldstein, Petryshen, Seidman, Shenton, McCarley, Sonntag and Woo2014). Other enriched pathways of miRNAs in the intergenic class are involved in immune function and the regulation of signaling through calcium channels; both of these pathways have been implicated in SZ and BD (Hinze-Selch, Reference Hinze-Selch2002; de Baumont et al. Reference de Baumont, Maschietto, Lima, Carraro, Olivieri, Fiorini, Barreta, Palha, Belmonte-de-Abreu, Moreira Filho and Brentani2015) with respect to etiology and treatment course.
A schematic diagram depicting the hypothesized relationship between expression quantitative trait loci, miRNAs, and mRNA genes. (a) Depiction of ‘coherent’ feed forward loop (FFL) and (b) depiction of ‘incoherent’ FFL. See text for more details. SNP, single nucleotide polymorphism.

The second way in which SZ and BD significant SNPs could influence the expression of a miRNA is by affecting both the miRNA and its host gene in a regulatory loop, although it is unclear at present whether the effect of the SNP within the loop is equally shared between the miRNA and the host or not. The potential for regulatory loops involving miRNAs is nonetheless quite interesting with respect to SZ and BD disease etiology (Guo et al. Reference Guo, Sun, Jia and Zhao2010; Li et al. Reference Li, Liang, Easterbrook, Luo and Zhang2014; Shenoy & Blelloch, Reference Shenoy and Blelloch2014). Several types of regulatory loops have been described; a feed forward loop (FFL), for instance, involves a transcription factor (TF) that binds to a cis-regulatory element upstream of the promoter for a miRNA and its mRNA target. In ‘coherent’ FFLs where the TF activates the miRNA that represses the mRNA gene, the controlling element in the loop is the TF and the relationship between all three elements is relatively balanced. In ‘incoherent’ FFLs, however, the TF activates both the miRNA and the mRNA; the relationship becomes more difficult to parse out because the action of the miRNA compensates against the activity of the TF on the mRNA gene. Several regulatory loops involving miRNAs have been described in connection to brain development and neuronal differentiation (Zhao et al. Reference Zhao, Sun, Li and Shi2009; Sun et al. Reference Sun, Ye, Murai, Lang, Li, Zhang, Li, Fu, Yin, Wang, Ma and Shi2011; Liu et al. Reference Liu, Teng, McQuate, Jobe, Christ, von Hoyningen-Huene, Reyes, Polich, Xing, Li, Guo and Zhao2013). In this study, we found eQTLs for four miRNAs (hsa-miR-218-1, -449a, -9-3, and -103-1) for which there was experimental validation of the relationship between the host and the miRNA gene and instances of FFLs involving these same miRNAs (Wilfred et al. Reference Wilfred, Wang and Nelson2007; Bazzoni et al. Reference Bazzoni, Rossato, Fabbri, Gaudiosi, Mirolo, Mori, Tamassia, Mantovani, Cassatella and Locati2009; Lize et al. Reference Lize, Pilarski and Dobbelstein2010; Fish et al. Reference Fish, Wythe, Xiao, Bruneau, Stainier, Srivastava and Woo2011). We believe that with additional experimental validation of the relationship between the miRNAs in this class and their predicted targets, we will see additional examples of FFLs.
The enriched pathways targeted by the intragenic miRNA group were insulin signaling, B cell receptor signaling, DNA damage response only ATM dependent, and EGF/EGFR signaling. Two of these pathways, involving insulin signaling and B cell receptor signaling, overlapped with the intergenic group of miRNAs due to sequence similarities in hsa-miR-449a and -34a. The other enriched pathways that were unique to the intragenic miRNAs were the DNA damage response only ATM dependent and the EGF/EGFR signaling pathways. Of these, the EGF/EGFR signaling pathway has the most significant implications for neuropsychiatric disorders like SZ. The ligands for this pathway, in the ErbB families and neuregulin (NRG) families, are found in abundance in GABAergic and dopaminergic neurons and in glial cells. ErbB1 ligands, in particular, have been shown to negatively regulate GABAergic development in the neocortex and influence activity of glutamate receptor channels (Nagano et al. Reference Nagano, Namba, Abe, Aoki, Takei and Nawa2007). In addition, genetic and candidate gene studies have implicated both ErbB1-4 and NRG1-6 in SZ (Barnes et al. Reference Barnes, Isohanni, Barnett, Pietilainen, Veijola, Miettunen, Paunio, Tanskanen, Ridler, Suckling, Bullmore, Jones and Murray2012; Deng et al. Reference Deng, Pan, Engel and Huang2013; Nawaz et al. Reference Nawaz, Asif, Khan, Ishtiaq, Shad and Siddiqui2014).
By integrating eQTL analysis with the association signal seen in the PGC GWAS dataset, we can offer general hypotheses about the role of miRNAs in SZ and BD. First, due in large part to their location and the lack of other apparent factors directly mediating expression, the influence of intergenic miRNAs may be more readily apparent and directed in SZ/BD subjects than in intragenic miRNAs. The influence of intragenic miRNAs in SZ/BD might, in turn, be easily missed if they participate in regulatory loops and focus is only given to the miRNA and not the other loop ‘participants’.
We acknowledge several limitations to this study. First, there are significant challenges posed by working with postmortem brain samples that may lead to inconsistencies in study replication and reduced power (McCullumsmith et al. Reference McCullumsmith, Hammond, Shan and Meador-Woodruff2014). Factors such as age at death, PMI, brain PH, and prior exposure to specific medicines are potential confounders that, even when attempted to adjust for, may still confound the results from different expression studies when these are compared. In addition, although in recent years the numbers of postmortem brain samples have been steadily increasing, the sample size of currently available postmortem brain studies is still small, thus reducing statistical power and replicability. Furthermore, the composition of postmortem brain samples is often a mixture of tissues and cell types making it difficult to ascertain with certainty the exact source of the finding. The use of postmortem brains, nevertheless, offers the best possible substrate for studying complex human behavior simultaneously on a genetic and molecular level and provides a way in which to generate specific testable hypotheses that animal models may not allow.
A second perceived limitation of our study is that we deliberately chose not to distinguish the level of SZ and/or BD association enrichment between intergenic and intragenic miRNAs. Instead, we chose to look at the differences between the miRNA groups in terms of the predicted targets of each group and their respective pathways. Indeed, while we cannot unequivocally state that the level of enrichment did not result from the influence of the protein coding genes that hosted the intragenic miRNAs, we would still suggest that the effect is nonetheless present and inextricably linked to miRNAs. What our study does suggest is that certain classes of miRNAs may be more directly connected to genetic factors and that these may be the ones for whom neuronal cell signaling and fate might be a key function. In that regard, our study provides a successful approach to breach the gap between purely genetic (associations) and molecular (expression) studies conducted in neuropsychiatric disorders such as SZ and BD.
Supplementary material
For supplementary material accompanying this paper visit http://dx.doi.org/10.1017/S0033291715000483.
Acknowledgements
This work was supported by the Stanley Medical Research Institute (V.I.V., no. 08R-1959), the National Institute of Mental Health (S.A.B, MH100560) and the National Institute on Alcohol Abuse and Addiction (S.A.B. and V.I.V., AA02271). The summary statistics of PGC schizophrenia were obtained from https://pgc.unc.edu/Sharing.php#SharingOpp. We are grateful to the PGC investigators who produced and analyzed these datasets.
Declaration of Interest
None.