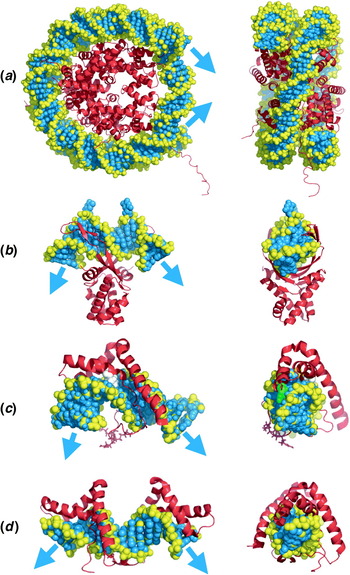
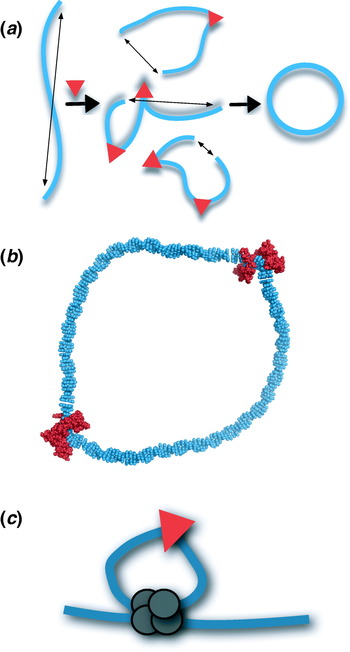
1. Introduction
1.1 Biological and engineering relevance of DNA stiffness
Duplex DNA is the genetic material of all cells and some viruses. Genome management begins with DNA management. Amazingly, eukaryotic genome size ranges over three orders of magnitude from 29 million base pairs (bp) to 130 billion bp (Bennett & Leitch, Reference Bennett, Leitch and Gregory2005; Gregory, Reference Gregory and Gregory2005), and the smallest prokaryotic endosymbiont genome is a mere 160 000 bp (160 kb; Nakabachi et al. Reference Nakabachi, Yamashita, Toh, Ishikawa, Dunbar, Moran and Hattori2006). Viral DNA content can also vary from coding capacity for 1–1000 genes, with packaging pressures as high as 50 atm in bacteriophage heads with ultra-compressed double-stranded DNA genomes (Gelbart & Knobler, Reference Gelbart and Knobler2009). Packaging the extremely long, information-rich double helix is therefore a fundamental problem in biology, and DNA stiffness is what really makes packaging difficult.
Moreover, the genome is not simply cargo to be stowed. Extracting the information encoded in DNA requires control of promoters, the entry sites for the RNA polymerases that transcribe genes. From the earliest examples of bacterial gene control in the Escherichia coli lactose operon (Jacob & Monod, Reference Jacob and Monod1961), to gene control by recombination (Paull et al. Reference Paull, Haykinson and Johnson1993), to the most complex cases of locus control in animal cell development (Zhou et al. Reference Zhou, Xin, Song, Di, Liu, Wu, Liu and Liang2006), DNA looping appears to play a significant role. Sites separated along DNA by various distances must physically interact, through solution, to facilitate such looping (Allemand et al. Reference Allemand, Cocco, Douarche and Lia2006; Rippe, Reference Rippe2001; Rippe et al. Reference Rippe, Von Hippel and Langowski1995). Thus, DNA function requires both compression for packaging and accessibility for looping.
Given the interesting requirements placed on DNA as a coding biopolymer, it is important to understand how the physical properties of the double helix relate to function. To what extent is auxiliary machinery needed to make the inherent properties of DNA compatible with biological requirements? How do DNA sequence and protein binding modify the shape and flexibility of DNA? These are among the questions addressed in this review.
In fact, DNA is among the stiffest of natural polymers. The resistance of DNA to bending exceeds that of amino acid polymers polyglycine, polyalanine, and polyproline by 80-, 25-, and 2-fold, respectively (Cantor & Schimmel, Reference Cantor and Schimmel1980). This means that DNA stiffness is a potential obstacle to processes requiring bending, twisting, and looping. As described above, such processes include DNA compaction in precipitating agents, tight wrapping around histone octamers in chromatin, and loading into virus particles, and DNA looping in gene regulation and recombination.
Apart from appreciating the impact of DNA shape and stiffness on biological function, DNA is also increasingly considered as an engineering material for nanofabrication (Rothemund, Reference Rothemund2006; Seeman, Reference Seeman2006). Such applications require an understanding of local and long-range polymer characteristics of the double helix. Manipulation of DNA stiffness may therefore become an important requirement in nanotechnology. The ability to artificially condense and package DNA is also of great interest to facilitate gene delivery to cells for gene therapy applications.
1.2 The worm-like chain (WLC) model of DNA
The classic framework for understanding long-range DNA shape and resistance to bending is embodied in the WLC model of DNA flexibility (Kratky & Porod, Reference Kratky and Porod1949; Rippe et al. Reference Rippe, Von Hippel and Langowski1995; Shimada & Yamakawa, Reference Shimada and Yamakawa1984). The development of this model for DNA and other semi-flexible (semi-stiff) chains has been a crucial contribution of polymer theory. The WLC model describes behavior intermediate between a rigid rod and a random coil to account for the striking local stiffness but long-range flexibility of DNA. Evolution of the WLC model proceeded by sequentially constraining more features of a random polymer chain.
A brief tutorial of the development of the WLC model is instructive. First, a discrete polymer chain is constructed by connecting successive steps in a random walk to yield a random flight chain or random coil. Constraining this chain so that all segments have the same length yields a freely jointed chain. As the name indicates, there are no restrictions on the bend or torsion angles between chain segments. Constraining the valence angles of this new chain, i.e. adding short-range interference, results in a freely rotating chain. Again, the name suggests that no restrictions are placed on torsion angles between chain segments so that rotations are permitted. Consider a freely rotating chain consisting of n segments of length a (not related to base pairs) joined linearly with valence angle θ, where free rotation about every segment is permitted. The contour length of the chain is given by the product na. The first segment r1 can be placed in the direction of the z-axis. If ez is a unit vector in the direction of the z-axis, then the average of the z-component of the end-to-end vector R is given by
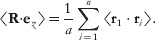
It is evident that 〈r1⋅r2〉 is the scalar projection of r2 onto r1 given by

since the angle between r1 and r2 is π−θ and cos (π−θ)=−cos θ. The value of 〈r1⋅r3〉 can be found by projecting r3 onto r2 and then projecting the result onto r1. This iterative process can be applied to each chain segment, so that, upon repeating scalar projections, the scalar products r1⋅ri are given by

Therefore, the desired sum is a geometric series  so that the sum of the first n terms is given by
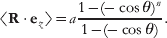
In the limit n→∞

The length P is the persistence length of this chain, i.e. a measure of the ‘persistence’, or the memory, of the initial chain direction.
The Kratky–Porod WLC is defined as a limiting continuous chain formed from this discrete chain by letting n→∞, a→0, and θ→π under the restriction that na≡l, the chain contour length, and a/(1+cos θ)≡P remain constant. The WLC model can be used to express the mean-squared end–end distance of DNA fragments in terms of persistence length and contour length:

Because of the biological significance of action at a distance along DNA, this kind of prediction is particularly important. Under physiological conditions, conventional values for P are near 50 nm or ~150 bp. For contour lengths l≫P, DNA can be described as a flexible polymer (essentially, a self-avoiding freely jointed chain) whose entropic component of energy is dominant. In contrast, for contour lengths l⩽P, DNA can be imagined as more rod-like with an elastic-dominated energy.
1.3 The j-factor
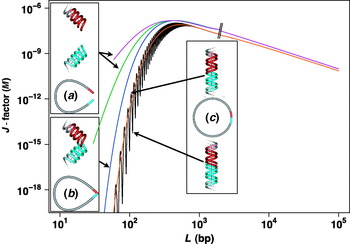
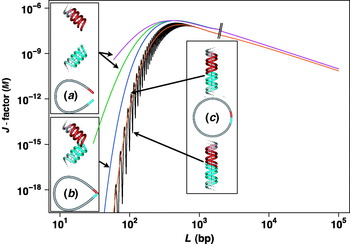
The ring-closure probability for a given DNA length, an experimentally accessible measure of polymer stiffness, is an extremely useful parameter. The different regimes of DNA flexibility predicted by the WLC model are captured well in plots of the relative concentrations of two sites on DNA (j-factor) as a function of the length of the intervening DNA tether. Such plots (Fig. 1) have two domains. For DNA tether lengths less than a few multiples of the persistence length, the j-factor is low, reflecting rod-like behavior, and climbs dramatically with DNA length. Reaching a maximum value (optimal cyclization probability) near 500 bp, the plot then drops gradually with DNA length, reflecting dilution of DNA termini and coil-like behavior. Beyond these general features, details of the predicted j-factor depend on how interaction between the two specified sites is defined (Allemand et al. Reference Allemand, Cocco, Douarche and Lia2006; Rippe, Reference Rippe2001; Rippe et al. Reference Rippe, Von Hippel and Langowski1995). If the sites are considered to interact when they reach some finite separation (as in the case of bridging proteins, neglecting the issue of helical face requirements), the length dependence of the j-factor is least extreme (Fig. 1a). If the two sites interact by direct contact (neglecting helical face or axial alignment requirements), the length dependence of the j-factor is much stronger (Fig. 1b). If interaction requires helix axis alignment (as in the case of ligation of cohesive DNA termini or contact between two particular helix faces), the length dependence of the j-factor is most extreme (Fig. 1c). When torsional alignment of helical termini is considered, the j-factor oscillates through maxima and minima for every ~10 bp of increased length, due to DNA torsional inflexibility (Fig. 1c, top versus bottom). Experimental assessment of the j-factor is most commonly made using ligase-dependent DNA cyclization assays (Fig. 1c) based on the altered electrophoretic gel mobility of cyclized DNA.
Depiction of the theoretical j-factor (predicted from the WLC model of DNA) as a function of DNA length and the nature of interaction between the two DNA sites. Note that both axes are plotted on logarithmic scales. Curves show behavior predicted for DNA with persistence length 46·5 nm, torsional constant 2·4×10−19 erg cm, and helical repeat 10·48 bp. (a) Sites are considered to interact when they are separated by distances of 20 nm (purple) or 10 nm (green). Helical face requirements are neglected. (b) Sites are considered to interact upon direct contact, with no requirement for helix axis alignment or specification of helical face (blue). (c) Sites are considered to interact when they collide and share a common helix axis. Consideration of the energy of DNA twisting to allow proper torsional alignment of DNA termini (as required for enzymatic ligation) results in an oscillating curve (black). Neglecting torsional alignment would result in a smooth curve (orange). Hatch marks indicate transition between fitting equations using expansions of the rod or coil limit. Curves were generated using formulas of Shimada & Yamakawa (Reference Shimada and Yamakawa1984) as well as Douarche & Cocco (Reference Douarche and Cocco2005) as discussed by Rippe (Reference Rippe2001), Rippe et al. (Reference Rippe, Von Hippel and Langowski1995), and Allemand et al. (Reference Allemand, Cocco, Douarche and Lia2006).
1.4 Organization of review
This review will focus on intrinsic DNA curvature and flexibility and perturbations by sequence non-specific architectural proteins. DNA bending by histone octamers and sequence-specific DNA-binding proteins will not be discussed in detail. Our strategy will be to provide sufficient historical context to illuminate the significance of recent progress and explore controversy in this field. An intentional theme of this presentation is the persistence of fundamental uncertainty and debate even after more than five decades of intense theoretical and experimental research.
At any given time, the shape of a DNA molecule is determined by sequence-dependent DNA curvature and sequence-dependent DNA deformability (flexibility or ‘softness’) driven by thermal energy or external force. This review will continue to use the conventional terminology of Hagerman (Reference Hagerman1988, Reference Hagerman1990, Reference Hagerman1992) : the sequence-dependent ensemble of DNA shapes in a hypothetical thermal bath without external forces is termed DNA ‘curvature’. Sequence-dependent DNA deformation driven by an external force is termed ‘bending’.
There are at least five outstanding questions related to the biophysics of DNA curvature and flexibility: (i) Why is DNA stiff? (ii) How adequate is the WLC model for describing DNA in vitro? (iii) What causes sequence-dependent DNA curvature and flexibility? (iv) Can sequence-dependent DNA curvature and flexibility be predicted? (v) How do cells manage the DNA stiffness problem? After summarizing relevant experimental methods, the remainder of this review will be organized around these questions.
2. Experimental methods for studying DNA stiffness in vitro and in vivo
A variety of experimental tools can be applied to measure intrinsic DNA curvature, flexibility, and the changes in DNA shape and flexibility caused by sequence non-specific architectural proteins. The following discussion is not exhaustive but highlights the primary tools presently utilized. Particular attention is paid to recently developed methods and new applications of existing methodologies. These approaches can be broadly divided into three categories: passive methods (no applied force), methods involving exertion of an external force on DNA, and in vivo assays of DNA flexibility.
2.1 Passive methods
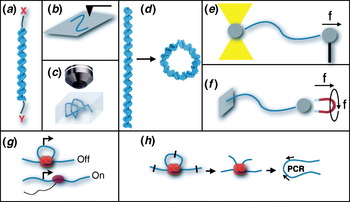
Optical spectroscopies measure equilibrium DNA conformations. These methods often assess DNA dynamics by virtue of end labeling (Fig. 2a). Fluorescence resonance energy transfer (FRET) measurements monitor the distance between fluorescent donor and acceptor dyes attached along a DNA duplex (Kuznetsov et al. Reference Kuznetsov, Sugimura, Vivas, Crothers and Ansari2006; McDonald et al. Reference Mcdonald, Dragan, Kirk, Neff, Privalov and Maher2007; Morgan et al. Reference Morgan, Okamoto, Kahn and English2005; Williams et al. Reference Williams, Parkhurst and Parkhurst2006). Distance-dependent resonance interaction between the two fluorophores results in the direct transfer of the excited state energy from the donor to the acceptor. Since the rate of energy transfer varies according to the inverse sixth power of distance between the fluorophores, the emission of the fluorophores is very sensitive to fluctuations in DNA helix geometry. The rotational dynamics of DNA have also been assessed using steady-state and time-resolved fluorescence polarization anisotropy experiments (Noothi et al. Reference Noothi, Kombrabail, Kundu, Krishnamoorthy and Rao2009). Small-angle X-ray scattering (SAXS) interference between gold nanoparticles has also been utilized to measure the mean end-to-end lengths of short DNAs (and variance of these distributions) (Mastroianni et al. Reference Mastroianni, Sivak, Geissler and Alivisatos2009; Mathew-Fenn et al. Reference Mathew-Fenn, Das and Harbury2008). For these experiments, gold nanocrystals (with radii of a few Å) are site-specifically attached to the ends of DNA via coupling to a deoxycytidine residue with a 3′-thiol modification.
Schematic illustration of some experimental methods applied to the measurement of DNA flexibility. (a) Analysis of DNA re-orientation (electric dichroism), or interaction of tethered [X,Y] probes (FRET and EPR) or scattering agents (SAXS). (b) AFM on a surface. (c) Single-molecule imaging in solution in an ABEL trap. (d) DNA ligase-mediated cyclization kinetics assay in vitro. (e) Single-molecule force spectroscopy in optical tweezers. (f) Single-molecule force spectroscopy in magnetic tweezers. (g) In vivo assay of genetic switches (e.g. lac operon) involving DNA repression loops. Repressor is shown in red and RNA polymerase in purple. (h) Chromosome conformation capture assay involving in vivo protein/DNA cross-linking, restriction digestion, DNA ligation, deproteination with cross-link reversal, and analytical polymerase chain reaction. DNA looping proteins are shown in red. Molecular models were rendered with PyMOL (DeLano Scientific).

Electron paramagnetic resonance (EPR) spectroscopy is a method for studying species that have one or more unpaired electrons. EPR is analogous to nuclear magnetic resonance (NMR), but excitation involves electron spins rather than nuclear spins. Thus, EPR has the requirement that the species being studied are paramagnetic. While this requirement limits the applicability of this technique, it also means that EPR has greater specificity. For example, site-specific EPR-active spin probes have been utilized to study the internal dynamics of DNA in solution and to measure a dynamic persistence length for DNA (Okonogi et al. Reference Okonogi, Reese, Alley, Hopkins and Robinson1999).
In the technique of transient electric birefringence (TEB), a brief (~1 μs) electric field is pulsed in a solution containing DNA. DNA and other charged molecules become partially (and transiently) oriented so that the solution becomes optically anisotropic (birefringent). In the absence of the electric field there is a return to a state of rotational isotropy and decay of birefringence. The measured rotational decay times of this process are very sensitive to changes in DNA conformation, with more elongated molecules having longer decay times (Hagerman, Reference Hagerman1981; Mills & Hagerman, Reference Mills and Hagerman2004).
Atomic force microscopy (AFM; also known as scanning force microscopy (SFM)) is an imaging technique that has been applied to study DNA shape and flexibility (Scipioni et al. Reference Scipioni, Anselmi, Zuccheri, Samori and De Santis2002a, Reference Scipioni, Zuccheri, Anselmi, Bergia, Samori and De Santisb) (Fig. 2b). This method of imaging can be applied to both trapped and dynamic DNA molecules. Operation takes place in either aqueous or ambient environments. Samples are deposited on a surface (commonly mica, graphite, or gold) with or without activation by surface reactive cations such as Mg2+, Ni2+, or (3-aminopropyl)triethoxysilane (APTES). There are three primary modes of AFM: contact, non-contact, and tapping. In each AFM mode, a tip at the end of an oscillating cantilever scans across the surface of the sample. The cantilever is typically oscillated at or near its resonance frequency, and changes in the deflection of the cantilever are measured by the displacement of a laser beam (detected using a photodiode detector) reflected from the cantilever. A feedback loop maintaining a constant signal to the photodiode detector is established in each mode by vertically adjusting the position of the scanning apparatus. Critical issues in AFM are the effects of different deposition methods, DNA geometry, and possible effects of the tip on the relatively soft samples.
Cryo-electron microscopy (cryo-EM) can also provide topographic images and three-dimensional (3D) reconstructions of DNA molecules (Bednar et al. Reference Bednar, Furrer, Stasiak, Dubochet, Egelman and Bates1994; Demurtas et al. Reference Demurtas, Amzallag, Rawdon, Maddocks, Dubochet and Stasiak2009). For this technique, DNA samples are loaded in micron-size holes on an electron microscope grid and immersed into liquid ethane at −160°C for rapid cooling (vitrification) that avoids the freezing damage associated with the formation of ice crystals. The DNA samples, which are almost instantly immobilized, are then transferred to a cryo-specimen holder in a pre-cooled electron microscope where they can be observed. The modest contrast between the electron density of the DNA sample and the surrounding solution allows multiple images from different incident angles that can be combined to allow 3D reconstructions of the sample.
Recently, a new means of trapping and measuring biological molecules was developed (Cohen & Moerner, Reference Cohen and Moerner2005). This technique, the anti-Brownian electrophoretic (ABEL) trap, can gently and sensitively trap individual nanoscale objects that acquire a charge in solution (Fig. 2c). The ABEL trap consists of four electrodes on a glass slide. The electrodes can be individually controlled to generate an arbitrary electric field. By monitoring the Brownian motion of a small object with fluorescence microscopy, a time-dependent feedback voltage is applied so that induced electrophoretic drift cancels the Brownian motion of the object. A computer interfaced with a charge-coupled device (CCD) camera and fluorescence microscope provides real-time images of the object diffusing among the electrodes. Using position information for the particle in the previous video frame, the computer generates a feedback voltage to return the object to a target position in the subsequent frame. The unique advantage of this approach is that it allows estimation of DNA conformational properties and dynamics in a state without physical tethering.
Detection of DNA curvature in the absence of external force has been achieved by X-ray crystallography and NMR spectroscopy. Implications of crystallographic precipitants and co-solvents such as 2-methyl-2,4-pentanediol (MPD) have been actively debated in the literature (Dickerson et al. Reference Dickerson, Goodsell and Kopka1996; Harvey et al. Reference Harvey, Dlakic, Griffith, Harrington, Park, Sprous and Zacharias1995). It has been argued that dehydrating agents and crystal packing forces, i.e. the tendency of DNA molecules to make coaxial stacks through the crystal, may limit the ability of X-ray crystallography to illuminate sequence-directed curvature and flexibility. X-ray results are particularly problematic for A-tract sequences where results disagree with other methods. The applicability of NMR spectroscopy has advanced with the application of residual dipolar coupling information, making more confident long-range structural models built from NMR constraints (MacDonald et al. Reference Macdonald, Herbert, Zhang, Pologruto and Lu2001). The exquisite shape dependence of duplex DNA mobility in native polyacrylamide gel electrophoresis (PAGE) has been exploited for semi-quantitative measurement of DNA curvature. Because curved DNAs migrate more slowly, native PAGE has been utilized to detect DNA curvature or protein-induced bending in ligation ladders, circular permutation, and phasing assays (Crothers & Drak, Reference Crothers and Drak1992; Crothers et al. Reference Crothers, Haran and Nadeau1990, Reference Crothers, Drak, Kahn and Levene1992; Kahn & Crothers, Reference Kahn and Crothers1992; Kahn et al. Reference Kahn, Yun and Crothers1994; Koo & Crothers, Reference Koo and Crothers1988; Koo et al. Reference Koo, Wu and Crothers1986, Reference Koo, Drak, Rice and Crothers1990; Ross et al. Reference Ross, Den, Hardwidge and Maher1999; Strauss & Maher, Reference Strauss and Maher1994; Zinkel & Crothers, Reference Zinkel and Crothers1987). It is often difficult or impossible to distinguish the effects of DNA curvature versus anisotropic flexibility in such experiments (Kahn et al. Reference Kahn, Yun and Crothers1994).
By exploiting the altered gel mobility of circular DNA, ring closure kinetics measure j-factors by sampling extreme DNA conformations. For a stiff chain like a double-stranded DNA of ~200 bp, conformations susceptible to ligation into circles (Fig. 2d) are exceedingly rare. Ligase-catalyzed DNA cyclization has received widespread theoretical and experimental consideration (Crothers et al. Reference Crothers, Drak, Kahn and Levene1992; Du et al. Reference Du, Smith, Shiffeldrim, Vologodskaia and Vologodskii2005; Hagerman & Ramadevi, Reference Hagerman and Ramadevi1990; Kahn & Crothers, Reference Kahn and Crothers1992; Podtelezhnikov et al. Reference Podtelezhnikov, Mao, Seeman and Vologodskii2000; Shore et al. Reference Shore, Langowski and Baldwin1981; Taylor & Hagerman, Reference Taylor and Hagerman1990; Vologodskaia & Vologodskii, Reference Vologodskaia and Vologodskii2002; Zhang & Crothers, Reference Zhang and Crothers2003). The extreme sensitivity of this technique for measuring intrinsic or induced DNA flexibility is practically unmatched. However, details of experimental conditions and key assumptions can be crucial, as will be discussed later (Cloutier & Widom, Reference Cloutier and Widom2004; Du et al. Reference Du, Smith, Shiffeldrim, Vologodskaia and Vologodskii2005). Accordingly, the theoretical framework underlying analysis of ligase-catalyzed DNA cyclization kinetics is presented now in some detail along the lines of the original derivation of Shore and Baldwin (Shore & Baldwin, Reference Shore and Baldwin1983; Shore et al. Reference Shore, Langowski and Baldwin1981). Cyclization converts a linear DNA molecule (L) with cohesive termini into a circular substrate (S c) for DNA ligase (E). The ligation reaction produces a covalently closed DNA circle as product (P c). Cyclization is proposed to proceed through the following kinetic mechanism:

The subscripts on the rate constants indicate which sets of species are being converted. For example, kab indicates a conversion from species a to species b.
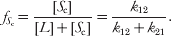
If the concentrations of S c and E are small, the dissociation of cohesive ends is fast compared to ligase-catalyzed ring closure, which involves the bimolecular formation of an enzyme–substrate complex (ES c). Since the formation of ES c is slow relative to end dissociation (i.e. there exists a rapid pre-equilibrium between L and S c), the rate of ligase-catalyzed covalent ring closure (k C) is directly proportional to the equilibrium fraction of cyclized molecules  given by
An equation for k C can be derived by applying the steady-state approximation to the kinetic mechanism given in Eq. (7). First, the rate of change for the concentration of each species is written according to mass action as follows:
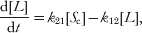



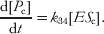
It is assumed that the fraction of cyclized molecules is small  , so that the steady-state approximation can be applied to both cyclized DNA (S c) and to the enzyme–substrate complex (ES c):


Expressions for the steady-state concentrations of S c and ES c can then be found using Eqs. (10) and (12) and the steady state Eqs. (14) and (15):
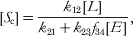
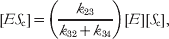
with f 34 defined as the efficiency of ligation of the ES complex

The rate of appearance of product d[P c]/dt equals the rate of disappearance of unreacted DNA, i.e. the sum of the concentrations of linear and circular DNA:
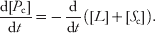
The measured rate constant for the formation of covalently closed circles k C is then defined as the (first-order) rate constant for the disappearance of L+S c:
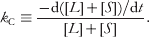
It can be shown from Eqs. (13), (14), and (17)–(19) that

Additionally, it follows from the rearrangement of (16) that

so that from Eqs. (20)–(22)
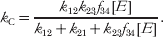
On imposing the requirement for a rapid pre-equilibrium (L↔S c) preceding the formation of ES c,

Equation (23) simplifies to

Experimentally it is desirable to relate k C to the total enzyme concentration (E 0). From Eq. (17) it can be shown that

where K m is the Michaelis constant for ES c given by

It follows from Eq. (26) that
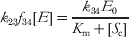
so that for a fast pre-equilibrium
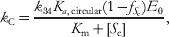
where Ka ,circular is the equilibrium constant for cyclization (L↔S c) given by
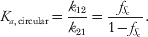
It should be noted that for  and K m≫[S c], Eq. (29) becomes k C=(k 34/K m) Ka ,circularE 0, which is a standard Michaelis–Menten expression for an enzyme-catalyzed reaction at low substrate concentration.
A similar approach can be applied to the kinetics of bimolecular joining of linear DNA molecules to form dimers (subscript d) with the same complementary cohesive ends:

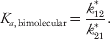
For simplicity, it is assumed that each half molecule is distinguishable and has a single cohesive end (and one blunt end). A discussion of the case of indistinguishable half molecules will come later. In the derivation that follows, it is shown that the second-order rate constant for covalent bimolecular end joining (k D) is proportional to the equilibrium constant for bimolecular association (Ka ,bimolecular) given by
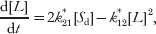
Analogous rate equations, distinguished with subscript ‘d’ and superscript * (as necessary), can be written for Eqs. (11)–(13) as before, but rate equations for L and S d are now

Steady state Eqs. (14) and (15) (and therefore Eq. (17)) are analogous to before, so the steady-state concentration of S d is
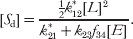
Imposing the requirement (analogous to Eq. (24)) for a rapid pre-equilibrium (2L↔S d), this equation becomes
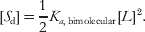
The measured rate constant for the formation of covalently closed linear dimer k D is defined as the (second-order) rate constant for the disappearance of unreacted DNA (L+2S d):
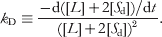
From equations analogous to Eqs. (13), (14), (17), and

it follows that

and since
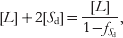
with
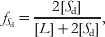
it follows from Eqs. (37), (39), and (40) that

and using the analogue of Eq. (28) this becomes
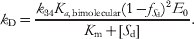
Earlier, it was assumed that each half molecule is distinguishable and has a single cohesive end (and one blunt end). However, in the case of dimerization of (distinguishable or indistinguishable) DNA molecules with two cohesive ends, the apparent rate constant for dimerization is given by 4k D, where an expression for k D is given in Eq. (43). Taking the ratio of Eqs. (29) to (43)
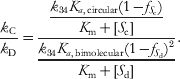
If  and
 are negligible compared to 1 and K m≫[S c] and [S d], then
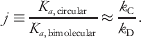
It should be noted that there is an implicit assumption that k 34/K m for ligase is independent of the nature of the substrate, which conceivably is not true if there is significant local curvature or if the binding of ligase can alter curvature.
This is the key result of the derivation. Equation (45) illustrates that, subject to the specified assumptions, the j-factor (defined as a ratio of equilibrium constants) is given by a ratio of experimentally measurable rate constants. It should be noted that the rate constants defined here (k C and k D) are taken to be functions of DNA length and of temperature. However, for DNA lengths between 126 and 4361 bp, k D has been shown to be essentially independent of DNA length (Shore et al. Reference Shore, Langowski and Baldwin1981). Thus, the length dependence of j reflects k C. Several factors affect k C, including the energy required to bend the DNA to form a small circle and the energy required to twist the DNA upon cyclization so that 3′ and 5′ termini lie opposite to each other and the opposed phosphodiester backbones (though nicked) follow a geometrically continuous path (along the co-linear helix axes) with the proper torsional alignment. This twist requirement is energetically costly for DNA fragments less than ~500 bp in length (Fig. 1).
Of recent interest are key assumptions required for the validity of Eq. (45). These assumptions include the requirements for rapid pre-equilibria (Eq. (24)), K m≫[substrate], and that the fraction of substrate is small (for each substrate type). The former is necessary so that the rate of product formation is proportional to ligase concentration. This requirement is met when the rate of substrate decay is much higher than the rate of ligase binding to the (nicked but) joined substrate ends. The latter assumptions are necessary so that the two reactions can be accurately compared. The requirement K m≫[substrate] must be met for both circular and bimolecular substrates (which are likely at different concentrations) so that the relative equilibrium populations of each are faithfully reported. The implications of unmet assumptions are discussed in a later section.
2.2 Active methods: force spectroscopies
Investigations of the behavior of DNA under the influence of an applied force (particularly single-molecule methods) have significantly enhanced our understanding of the energetic, elastic, mechanical, and structural properties of the DNA double helix (Baumann et al. Reference Baumann, Smith, Bloomfield and Bustamante1997; Bustamante et al. Reference Bustamante, Smith, Liphardt and Smith2000; McCauley et al. Reference Mccauley, Hardwidge, Maher and Williams2005; Podesta et al. Reference Podesta, Indrieri, Brogioli, Manning, Milani, Guerra, Finzi and Dunlap2005; Rouzina & Bloomfield, Reference Rouzina and Bloomfield2001a, Reference Rouzina and Bloomfieldb; Scipioni et al. Reference Scipioni, Anselmi, Zuccheri, Samori and De Santis2002a, Reference Scipioni, Zuccheri, Anselmi, Bergia, Samori and De Santisb; Tinoco et al. Reference Tinoco, Li and Bustamante2006; Van Noort et al. Reference Van Noort, Verbrugge, Goosen, Dekker and Dame2004; Wiggins et al. Reference Wiggins, Van Der Heijden, Moreno-Herrero, Spakowitz, Phillips, Widom, Dekker and Nelson2006). Single-molecule nanomanipulations utilize the technology of optical or magnetic traps and tweezers, microfibers, or AFM cantilevers to exert a range of forces on DNA molecules. In particular, experiments involving DNA stretching can be achieved with all of these methods. These technologies can also be combined with a buffer-flow system to examine hydrodynamic forces (drag) and to probe distinct buffer conditions, e.g. ionic strength. These techniques all employ the same basic principle. One terminus of a DNA molecule is anchored and a force sensor (viz. a trapped bead or a cantilever) is used to measure the applied force via displacement of the other terminus. Typically, DNA termini are specifically attached to the mobile and immobile components of a given system using tight associations of either biotin and streptavidin or digoxigenin (DIG) and anti-DIG.
In an optical trap or tweezer (Fig. 2e), a DNA molecule is tethered between two micron-sized polystyrene beads. One (immobile) bead is optically ‘trapped’ in a focused laser beam or ‘tweezed’ in the overlap of two convergently directed counter-propagating laser beams, while the other bead is held on the tip of a glass micropipette mounted on a piezoelectric stage. Movement of the micropipette tip (and possibly flow cell) relative to the trap causes the tethered DNA molecule to be stretched between the two beads, and the magnitude of extension is determined from the bead separation distance in simultaneous images of the micropipette tip and laser beams acquired from CCD cameras. As the beams leave the trap, the light is directed into lateral effect (position-sensitive) photodetectors that determine the deflection of each beam to within a few microns. The magnitude of the applied force exerted on the DNA is inferred from this displacement, as the refraction of rays within a focused laser results in a restoring force. Whereas optical tweezers immobilize an object (typically spherical) within an optical trap, as their name suggests magnetic tweezers trap a micron-sized superparamagnetic bead using small magnets (Fig. 2f). Again, one end of a DNA molecule is immobilized on a glass surface (e.g. the bottom of a capillary tube that can again be linked to a buffer-flow system) while the other end is attached to a mobile magnetic bead. By controlling the position and rotation of the external permanent magnets, the bead can be pulled and/or rotated, thus stretching and/or twisting the tethered DNA molecule. The applied force is measured by video analysis of the Brownian fluctuations of the magnetic bead.
In the microfiber system, an optical fiber fed by a laser serves as the immobile component (Cluzel et al. Reference Cluzel, Lebrun, Heller, Lavery, Viovy, Chatenay and Caron1996). A micron-sized polystyrene bead held on the tip of a glass micropipette mounted on a piezoelectric stage is the mobile component. Movement of the micropipette tip causes the DNA molecule tethered between the optical fiber and the bead to be stretched. The deflection (bending) of the optical fiber is detected by a position-sensitive photodiode. For a microfiber of known stiffness, the applied force is proportional to the measured bending. Similarly, the force necessary to stretch a DNA tethered between a mobile piezoelectric stage and an immobile AFM cantilever is proportional to the deflection of the cantilever detected by the displacement of a laser beam reflected from the cantilever.
2.3 In vivo methods
In vivo assays provide approaches to measuring DNA flexibility and looping propensity in the cellular context. Genetic assays reveal DNA flexibility through cooperativity at a distance (Fig. 2g). One particularly well-studied example is the lac looping system (Becker et al. Reference Becker, Kahn and Maher2005, Reference Becker, Kahn and Maher2007, Reference Becker, Kahn and Maher2008; Bellomy et al. Reference Bellomy, Mossing and Record1988; Kramer et al. Reference Kramer, Niemoller, Amouyal, Revet, Von Wilcken-Bergmann and Müller-Hill1987; Law et al. Reference Law, Bellomy, Schlax and Record1993; Mossing & Record, Reference Mossing and Record1986; Muller et al. Reference Muller, Oehler and Müller-Hill1996; Oehler et al. Reference Oehler, Eismann, Kramer and Müller-Hill1990). The general biophysical principles embodied in this example have recently been elegantly reviewed (Oehler & Müller-Hill, Reference Oehler and Müller-Hill2009). In this system, one operator (O2) overlaps with the promoter of the lacZ reporter gene and serves as a very weak lac repressor binding site. The lacZ gene is poorly repressed by repressor occupancy of this operator alone. Repression is dramatically enhanced by placement of a strong operator (Osym) upstream of the promoter. The bidentate lac repressor tetramer occupying this upstream site creates a local concentration at the weaker downstream operator O2 that is higher than the concentration of free repressor, increasing the probability of binding at O2. This enhances the degree of saturation of the downstream operator through DNA looping. The need for DNA twisting, when the operators are out-of-phase, causes looping to be less energetically favorable. Analysis of lacZ repression as a function of operator spacing distance is a highly sensitive assay of the bending and twisting flexibility of DNA in vivo (Becker et al. Reference Becker, Kahn and Maher2005, Reference Becker, Kahn and Maher2007, Reference Becker, Kahn and Maher2008; Bellomy et al. Reference Bellomy, Mossing and Record1988; Garcia et al. Reference Garcia, Grayson, Han, Inamdar, Kondev, Nelson, Phillips, Widom and Wiggins2007; Zhang et al. Reference Zhang, Mcewen, Crothers and Levene2006a, Reference Zhang, Mcewen, Crothers and Leveneb). The E. coli lac looping system allows for quantitative analysis of repression as a function of operator spacing via β-galactosidase (the product of the lacZ reporter gene) activity extracted from living cells. Cells are analyzed for β-galactosidase activity in the absence (uninduced) or presence (induced) of isopropyl β-D-1-thiogalactopyranoside (IPTG), a lactose analogue that reduces the affinity of lac repressor for DNA. The repression ratio (induced relative to repressed activity) serves as a gauge of DNA deformation energetics within cells. Thermodynamic modeling is also possible and allows for identification of subtle trends in the data (Becker et al. Reference Becker, Kahn and Maher2005, Reference Becker, Kahn and Maher2007, Reference Becker, Kahn and Maher2008; Bellomy et al. Reference Bellomy, Mossing and Record1988; Law et al. Reference Law, Bellomy, Schlax and Record1993; Zhang et al. Reference Zhang, Mcewen, Crothers and Levene2006a, Reference Zhang, Mcewen, Crothers and Leveneb).
DNA looping propensity has also been estimated in vivo through recombination assays (Ringrose et al. Reference Ringrose, Chabanis, Angrand, Woodroofe and Stewart1999). Site-specific recombination was first used to measure the ease of DNA looping in vitro by construction of a series of flip recombinase (FLP) excision substrates with intervening DNA lengths ranging from 74 bp to 15 kb between flip recognition target (FRT) sites. Purified FLP recombinase was added at known concentrations, aliquots were removed at specified time points, and percent recombination was measured. Percent recombination (plotted as a function of distance between FRTs) was shown to be proportional to the j-factor. This recombination assay was further adapted in this study to measure the looping of chromatin in vivo by stable integration of FLP excision substrates in human cell lines.
Relative DNA looping propensity is also estimated in vivo through the chromosomal conformation capture (3C) assay (Fig. 2h). Looped chromatin segments in intact cells are first covalently linked by formaldehyde cross-linking. The cross-linked chromatin is then solubilized, digested with a restriction enzyme, and ligated. Intramolecular ligation of the crossed-linked fragments measures the proximity of the free termini, and produces a large collection of products that serve as template for quantitative polymerase chain reaction (PCR). Since each ligation product results from the interaction of two sites, the abundance of each product reflects the frequency of interaction between the given sites in the 3D cross-linked state. The 3C assay and the more recent Hi-C variation capture and quantify looping among chromatin sites both in cis and in trans. This technique has been applied to study the looping propensity of DNA in protein complexes (Dekker et al. Reference Dekker, Rippe, Dekker and Kleckner2002; Gondor et al. Reference Gondor, Rougier and Ohlsson2008; Lieberman-Aiden et al. Reference Lieberman-Aiden, Van Berkum, Williams, Imakaev, Ragoczy, Telling, Amit, Lajoie, Sabo, Dorschner, Sandstrom, Bernstein, Bender, Groudine, Gnirke, Stamatoyannopoulos, Mirny, Lander and Dekker2009; Zhou et al. Reference Zhou, Xin, Song, Di, Liu, Wu, Liu and Liang2006).
3. Why is DNA stiff?
3.1 The forces responsible for DNA stiffness are not understood
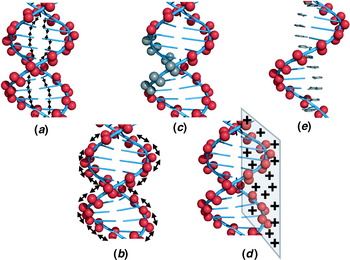
As predicted by the WLC model, DNA exhibits a profound local stiffness but global flexibility. Consequently, over nanometer length scales DNA is among the stiffest biopolymers. Why is DNA so stiff? Surprisingly, this simple question remains controversial. The most likely contributors to DNA stiffness are favorable base pair stacking interactions that contract the double helix (Fig. 3a) or mutual phosphate diester charge repulsions that expand it (Fig. 3b). At present, it remains disputed which of these two factors is the dominant contributor to DNA stiffness. It remains possible that each contributes significantly to a balance of forces explaining the unique stiffness of the DNA polymer.
Schematic illustration of concepts and experimental approaches to exploring the basis for DNA stiffness. DNA stiffness may involve compressive base pair stacking forces (a) and/or electrostatic stretching forces along the negatively charged sugar–phosphate backbone (b). See discussion of terms in text. (c) Asymmetric phosphate neutralization by targeted methylphosphonate substitution to measure induced DNA bending toward the neutralized helix face. (d) AFM study of apparent DNA stiffness on cationic surfaces. (e) Hemi-charged meroduplex model for measuring DNA stiffness when free bases stack onto a single helix without a second sugar–phosphate backbone.

The roles of local and long-range electrostatic effects in DNA structure and stiffness are not resolved. In his 1978 theory, Manning made predictions concerning residual DNA charge after counterion condensation (Manning, Reference Manning1978). In this model, the high negative charge density of DNA induces a concentrated layer of mobile and hydrated cationic counterions along the DNA surface. The extent to which this ‘condensed’ layer of counterions neutralizes DNA charge is governed by the valence of the counterions present in solution and, surprisingly, not by the bulk counterion concentration. The enthalpic attraction of the counterion to the DNA balances the entropic cost of localizing the ion even at very low bulk concentration. In particular, the parameter ξ governs counterion binding to DNA, and is defined as follows:

where e is the charge of an electron, ∊ is the bulk dielectric constant of the solvent, k B is the Boltzmann constant, T is the absolute temperature, and b is the average axial charge spacing of the DNA. The quantity e 2/(∊k BT)=ℓB is the Bjerrum length for the pure solvent, the separation distance at which the electrostatic interaction between two elementary charges (e) is comparable in magnitude to the thermal energy scale (k BT). According to the theory, counterion condensation occurs when

where Z is the (unsigned) valence of the counterion. The saturated charge fraction r, that is, the fractional charge of DNA remaining after counterion condensation, in this theory is given by

It is important to restate this key result. Counterion condensation theory predicts that effective phosphate charge is controlled by counterion valence rather than concentration. Accordingly, DNA is predicted to carry some counterion-dependent residual charge that cannot be quenched by increasing bulk salt concentration. Although increased bulk salt may screen long-range interactions among phosphate charges, local electrostatic stretching interactions persist and make a constant local contribution to DNA stiffness for a given counterion. Manning theory predicts that monovalent cations neutralize ~76% of DNA phosphate charge, divalent cations ~88%, and trivalent cations ~92%. In short, Manning's counterion condensation theory predicts that DNA stiffness should depend on counterion valence because counterions of increasing valence should decrease the residual thermodynamic charge fraction on DNA and thus reduce the electrostatic contribution to DNA stiffness via phosphate screening. This trend has been observed in optical tweezers experiments where the persistence length was fit to force–extension data as a function of counterion valence. Decreasing DNA persistence length was observed for increasing counterion valence (Baumann et al. Reference Baumann, Smith, Bloomfield and Bustamante1997). Additionally, Schurr and co-workers have contributed considerably to the theoretical treatment of experimental polyelectrolyte effects (Fujimoto & Schurr, Reference Fujimoto and Schurr1990; Rangel et al. Reference Rangel, Fujimoto and Schurr2008; Schurr & Allison, Reference Schurr and Allison1981; Schurr & Fujimoto, Reference Schurr and Fujimoto2002), as recently reviewed (Schurr, Reference Schurr and Hud2009).
Manning counterion condensation theory also predicts favorable entropy for the binding of cationic molecules to DNA, which releases condensed counterions into bulk solution. This prediction has been studied in detail by Record and co-workers (deHaseth et al. Reference deHaseth, Lohman and Record1977; Lohman et al. Reference Lohman, Dehaseth and Record1980; Record et al. Reference Record, Dehaseth and Lohman1977, Reference Record, Anderson and Lohman1978).
Manning has recently expanded this analysis to address the contribution of phosphate charge to DNA stiffness (Manning, Reference Manning2006). In this model, bare DNA charge (not residual charge after condensation) produces an electrostatic stretching force (internal tension) on DNA due to phosphate–phosphate repulsions. To quantitatively investigate the effects of this force, Manning devised the notion of a ‘null’ isomer of DNA, the hypothetical structure that would be adopted by a DNA if its electrostatic charge were set to zero (without affecting solvation). This model for null DNA consists of fully charged DNA supplemented by an applied compression force that is equal but oppositely directed to the internal electrostatic tension present in charged DNA. The key result of this model is a prediction for the relationship between the DNA persistence length P and the persistence length of its null isomer P*. This prediction invokes quantities already identified as well as the Debye screening length for the solution, 1/κ, the separation distance beyond which charges are screened (the only term dependent on ionic strength), and the polymer radius, R:

Thus, through κ there exists a dependence of the persistence length of DNA on salt concentration. Although Eq. (49) has no adjustable parameters, it is shown to give a reasonable value and counterion dependence for P. A key result of this prediction is that the relationship between the bending persistence length of DNA and the persistence length of its null isomer is multiplicative, not additive. In contrast to other theories (Skolnick & Fixman, Reference Skolnick and Fixman1977) there is no ‘electrostatic persistence length’. That is to say, there is no additive electrostatic component. Importantly, the model quantitatively predicts how charge spacing (b) or its reciprocal (linear charge density) governs DNA persistence length. This prediction may be subject to experimental verification. For example, the charge dependence of DNA persistence length and the role of electrostatics in mediating DNA stiffness can be addressed by novel chemistries coupled with traditional assays of DNA stiffness.
Several other theoretical studies have explored whether charge should contribute significantly to DNA stiffness. Results have been mixed. While calculations of charge crowding in bent DNA suggested a strong electrostatic opposition to deformation (Hardwidge et al. Reference Hardwidge, Pang, Zimmerman, Vaghefi, Hogrefe, Maher, Stellwagen and Mohanty2009; Range et al. Reference Range, Mayaan, Maher and York2005), other analyses suggest negligible effects of DNA charge on stiffness under physiological conditions (Ariel & Andelman, Reference Ariel and Andelman2003; Guo et al. Reference Guo, Taubes, Oh, Maher and Mohanty2008; Nguyen & Shklovskii, Reference Nguyen and Shklovskii2002; Skolnick & Fixman, Reference Skolnick and Fixman1977).
There is experimental evidence that DNA shape depends on charge balance (Williams & Maher, Reference Williams and Maher2000). Both theoretical and experimental investigations of asymmetric charge neutralization have been conducted (Kosikov et al. Reference Kosikov, Gorin, Lu, Olson and Manning2002; Manning et al. Reference Manning, Ebralidse, Mirzabekov and Rich1989; Okonogi et al. Reference Okonogi, Alley, Harwood, Hopkins and Robinson2002; Rouzina & Bloomfield, Reference Rouzina and Bloomfield1998). DNAs with one helical face partially modified by incorporation of neutral phosphate analogues have been created (Fig. 3c). These modified DNAs are spontaneously deformed toward the neutralized surface, as would be predicted from Manning electrostatic theory (Strauss & Maher, Reference Strauss and Maher1994). Moreover, in an X-ray crystallography experiment involving tethering of cations (directed radially outward) in the major groove of DNA, it was demonstrated that the bound cations interacted electrostatically with the DNA to induce collapse of the major groove around the bound cations (Moulaei et al. Reference Moulaei, Maehigashi, Lountos, Komeda, Watkins, Stone, Marky, Li, Gold and Williams2005). Crucially, no other apparent structural changes were induced by the bound cations, suggesting that the tethered cations mediated their effect through electrostatics and did not disrupt base stacking. Thus, both phosphate neutralization and cation adduction induce spontaneous DNA bending (Williams & Maher, Reference Williams and Maher2000), and they may cause DNA bending through a common mechanism.
More recently, experiments using AFM of DNA deposited on mica coated with positively charged molecules suggest that surfaces with increasing positive charge densities increase the flexibility of DNA (Podesta et al. Reference Podesta, Imperadori, Colnaghi, Finzi, Milani and Dunlap2004, Reference Podesta, Indrieri, Brogioli, Manning, Milani, Guerra, Finzi and Dunlap2005) (Fig. 3d). Additions of divalent and multivalent cations known to more completely neutralize the phosphate backbone with the potential to condense duplex DNA (Bloomfield, Reference Bloomfield1997; Gosule & Schellman, Reference Gosule and Schellman1978; Hud et al. Reference Hud, Downing and Balhorn1995) enhance the rotational dynamics of DNA, as evidenced by rotational correlation times from steady-state fluorescence anisotropy experiments (Noothi et al. Reference Noothi, Kombrabail, Kundu, Krishnamoorthy and Rao2009). Furthermore, studies have shown that DNA is more compact when complexed with an oppositely charged amphiphile in organic solvent (Sergeyev et al. Reference Sergeyev, Pyshkina, Lezov, Mel'nikov, Ryumtsev, Zezin and Kabanov1999). The hypothesis is that DNA in a DNA–surfactant complex behaves as though it was electrically neutralized and, as a result of enhanced flexibility, assumes a more compact state. These studies suggest dominant effects of DNA charge in modulating DNA flexibility and shape.
Fueling the controversy, there is experimental evidence that DNA stiffness is dominated by base stacking rather than charge repulsion. TEB has been extensively developed to access DNA flexibility via persistence length, as it relates to base pair stacking (Hagerman & Hagerman, Reference Hagerman and Hagerman1996; Hagerman, Reference Hagerman1981; Mills et al. Reference Mills, Vacano and Hagerman1999; Vacano & Hagerman, Reference Vacano and Hagerman1997). In particular, TEB was utilized to explore the flexibility of the so-called ‘meroduplex’, an unstructured single-stranded polypyrimidine that attains duplex character upon addition of excess free purine base (Hagerman & Hagerman, Reference Hagerman and Hagerman1996) (Fig. 3E). A variant of the meroduplex was created with ~20 nucleotides of meroduplex flanked by double-stranded DNA at either end. This ‘gapped’ meroduplex was shown to be much more flexible than the equivalent full duplex, but upon addition of free N 6-methyladenine the flexibility became essentially indistinguishable from that of the full duplex, suggesting that base pair stacking is the dominant contributor to DNA stiffness (Mills & Hagerman, Reference Mills and Hagerman2004). There is also evidence that sequence-dependent differences in base stacking forces can measurably influence DNA persistence length (Caserta et al. Reference Caserta, Agricola, Churcher, Hiriart, Verdone, Di Mauro and Travers2009; Protozanova et al. Reference Protozanova, Yakovchuk and Frank-Kamenetskii2004; SantaLucia, Reference Santalucia1998; Virstedt et al. Reference Virstedt, Berge, Henderson, Waring and Travers2004). However, the scale of these stacking effects has never been experimentally compared with electrostatic effects.
Thus, the force (or, likely, balance of forces) responsible for the bending stiffness of DNA remains unresolved. The issue remains of fundamental importance for at least three reasons. First, understanding the forces responsible for DNA stiffness might allow engineering of DNA-like polymers with altered stiffness properties that could be helpful in the creation of novel nanomaterials. Second, such an understanding would illuminate the mechanism responsible for eukaryotic DNA compaction by histone octamers in chromatin. Third, this understanding may suggest design principles for artificial DNA-bending proteins and devices.
4. How adequate is the WLC model for describing DNA in vitro?
The WLC model of Kratky and Porod was formulated in 1949 (Kratky & Porod, Reference Kratky and Porod1949), and has since been extensively scrutinized and modified (Shimada & Yamakawa, Reference Shimada and Yamakawa1984). The longevity and durability of the WLC model are remarkable. This coarse-grained approach treats DNA as an inextensible elastic rod lacking atomic detail. Despite its simplicity, the model has proven to be extremely accurate in describing DNA from thousands of base pairs down to fewer than one hundred. Recently, the validity of this model for short DNA molecules (less than one persistence length) has become controversial.
4.1 Challenges to the WLC model
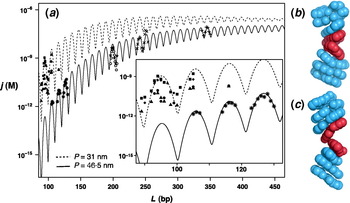
T4 DNA-ligase-mediated cyclization studies by Cloutier & Widom (Reference Cloutier and Widom2004, Reference Cloutier and Widom2005) suggested that ~100 bp DNA fragments formed circles at rates 3–5 orders of magnitude faster than predicted by the WLC model (Fig. 4a). In order to explain these unexpected findings, both theoreticians and experimentalists invoked the notion of DNA kinking (local base pair unstacking). Kinking of the DNA duplex would allow unusually large local bend angles as a possible means to explain these findings. DNA kinking is not a new idea. In 1975, Klug and Crick proposed that the energetic cost of forming small circles or loops could be reduced if DNA were to kink rather than uniformly distort (bend) throughout a looping region (Crick & Klug, Reference Crick and Klug1975). Later, experimental evidence for DNA kinking came from the nucleosome, in which a persistence length of DNA is wound nearly twice around a histone octamer (Hogan et al. Reference Hogan, Rooney and Austin1987; Luger et al. Reference Luger, Mader, Richmond, Sargent and Richmond1997). From the high-resolution nucleosome crystal structures it was shown that six of twelve 5′-CA-3′ steps exhibit kinking to narrow the minor groove toward the histone octamer, whereas the remainder of DNA bending in the nucleosome occurs smoothly without kinking (Richmond & Davey, Reference Richmond and Davey2003). The other preferred base step for kinking was 5′-TA-3′, which also exhibits low base stacking energy (Fig. 4b).
Controversy surrounding a report of spontaneous sharp bending of double-stranded DNA. (a) Data are taken from Shore & Baldwin (Reference Shore and Baldwin1983) (times signs), Taylor & Hagerman (Reference Taylor and Hagerman1990) (plus signs), Vologodskaia & Vologodskii (Reference Vologodskaia and Vologodskii2002) (open circles), and Rueter & Maher (unpublished results) (stars). Contrasting experimental findings for j-factors of short DNAs by ligase-catalyzed DNA cyclization kinetics where solid black symbols correspond to the data of Cloutier & Widom (Reference Cloutier and Widom2004) and asterisks correspond to the data of Du et al. (Reference Du, Smith, Shiffeldrim, Vologodskaia and Vologodskii2005) collected with particular attention to required assay assumptions (inset). Squares, circles, and triangles reflect data from the Widom group for different sequences. Both datasets have been modeled here using a DNA helical repeat of 10·54 bp/turn and a torsional rigidity of 2·4×10−19 erg cm. Best fits for the DNA persistence length are 31 nm (data of Cloutier and Widom) or 46·5 nm (data of Du et al.). (b) DNA kink that unstacks base pairs and widens the minor groove induced upon strong DNA bending in the X-ray crystal structure of the E. coli catabolite activator protein (Schultz et al. Reference Schultz, Shields and Steitz1991). (c) DNA kink that widens the major groove predicted from the MD simulations of strained DNA circles by Lankas et al. (Reference Lankas, Lavery and Maddocks2006).

Theorists therefore proposed alternative kink-prone models for DNA flexibility. These models suggested the transient appearance of localized weakly stacked segments in the DNA that might be prone to kinking. Such kinks might preserve base pairing but not base stacking, and be accompanied by ‘bubbling’ (local base unpairing to create a flexible hinge), base pair opening (disruption of both base pairing and stacking), or base flipping (where only a flipped base has disrupted base pairing and stacking). Two such models, the kinked WLC (KWLC) model and the single-stranded bubble model, both propose local distortions that could strongly enhance bending and bidirectional torsional flexibility (Wiggins et al. Reference Wiggins, Phillips and Nelson2005; Yan & Marko, Reference Yan and Marko2004). Consideration of the importance of short DNA loops in gene regulation, particularly in bacteria, also prompted models in which short DNA loops readily form with spontaneous kinking to relieve elastic strain, or alternatively that accessory kinking proteins facilitate such loops. At the same time a model including more microscopic detail to supplement the WLC model was shown to predict enhanced apparent flexibility of short DNAs, due to intrinsically curved sequences, without the necessity of kinks (Czapla et al. Reference Czapla, Swigon and Olson2006).
Computationally intense all-atom molecular dynamics (MD) simulations were also applied to determine if kinking could be justified as an explanation for the Cloutier and Widom result. Lankas and co-workers in 2006 predicted the formation of DNA kinks in 94 bp DNA circles, modeled both with and without torsional strain (Lankas et al. Reference Lankas, Lavery and Maddocks2006; Maher, Reference Maher2006) (Fig. 4c). Interestingly, the kinks most commonly occurred at 5′-CG-3′ steps rather than the predicted 5′-TA-3′ and 5′-CA-3′ steps. This simulation again suggested that kinks might be an inherent DNA response to strong bending and twisting strain. More modeling of DNA kinks ensued (Ghatak & Das, Reference Ghatak and Das2007; Popov & Tkachenko, Reference Popov and Tkachenko2005; Randall et al. Reference Randall, Zechiedrich and Pettitt2009). Results of these studies indicated that severe DNA distortions, such as the formation of circles smaller than ~85 bp in length, may require alteration of the WLC model to include sharp bending or kinking of DNA.
Controversy has continued in experiments based on AFM and SAXS. Results of some AFM experiments were interpreted as being consistent with unexpectedly flexible DNA (Wiggins et al. Reference Wiggins, Van Der Heijden, Moreno-Herrero, Spakowitz, Phillips, Widom, Dekker and Nelson2006), while others agreed well with standard persistence lengths (Witz et al. Reference Witz, Rechendorff, Adamcik and Dietler2008). Recent SAXS data examining the equilibrium end-to-end distance distributions of short DNA fragments with gold nanocrystal labels again challenged the WLC model at short DNA lengths (Mathew-Fenn et al. Reference Mathew-Fenn, Das and Harbury2008). In this work, the authors reported that stretching fluctuations were much larger than expected from WLC predictions, and that stretching was correlated over at least two turns of the DNA double helix. This interpretation suggested new flexibility regimes for DNA beyond WLC predictions. There have been further Technical Comments challenging and defending this work in the same journal.
4.2 The WLC model fights back
Amidst the flurry of theoretical and experimental work seeking support for new kink-prone models for DNA flexibility, there was renewed support for the applicability of the WLC model to sub-persistence length DNA. Vologodskii and co-workers revisited cyclization experiments of DNA fragments 105–130 bp in length and demonstrated that the WLC model remains adequate for predicting the cyclization probabilities of these fragments when assumptions of the assay are scrupulously met (Du et al. Reference Du, Smith, Shiffeldrim, Vologodskaia and Vologodskii2005). Their experimental study reported a technical flaw explaining the unusually high cyclization probabilities observed by Cloutier and Widom. Because cyclization becomes an increasingly rare event for short, stiff DNAs at low ligase concentration, addition of increasing ligase had been necessary. However, the requirement that formation of both circular and bimolecular ligation products is proportional to ligase concentration (Eq. (24) above) had not been substantiated for the dimerization reaction under the necessarily high T4 DNA ligase concentrations of the Cloutier and Widom study (Cloutier & Widom, Reference Cloutier and Widom2004). Du et al. showed that the rate of dimerization lacked a dependence on ligase concentration beyond a threshold value (~100 units/ml for their particular cohesive ends) (Du et al. Reference Du, Smith, Shiffeldrim, Vologodskaia and Vologodskii2005). Under conditions where assumptions of the fitting model could be shown to be valid, the WLC chain faithfully predicted the measured values of the j-factor from ligation experiments. Du et al. went on to perform experiments with DNA minicircles under high bending strain (but no twisting strain) using nuclease attack to detect kinks in continuous or gapped control DNAs (Du et al. Reference Du, Kotlyar and Vologodskii2008). Minicircles as small as 85 bp in length resisted kinking or other apparent bending deformations unless torsionally strained. Additionally, recent cryo-EM experiments with the exact sequences studied by Cloutier and Widom suggest that circle formation occurs through smooth bending without DNA kinks (Demurtas et al. Reference Demurtas, Amzallag, Rawdon, Maddocks, Dubochet and Stasiak2009). These results suggest that the WLC model is applicable to DNA lengths down to 85 bp.
Likewise, recent analysis of more extensive SAXS experiments led Mastroianni et al. to conclude that when care is taken to model DNA–gold linkages and to study a broad range of DNA lengths, the WLC model (with a conventional 50 nm persistence length estimate) is completely sufficient to explain the SAXS data (Mastroianni et al. Reference Mastroianni, Sivak, Geissler and Alivisatos2009). This study considers sequence and salt effects, reporting that they contribute negligibly to the conclusions. Monte Carlo simulation is combined with experimentation to carefully consider the implications of non-linear elasticity versus the classical WLC model. The authors find that the WLC model can adequately describe conformational fluctuations of double-stranded DNA in the range of 1/3 to 2/3 of one persistence length.
Thus, although recent high-profile cyclization and SAXS studies raised the provocative possibility that DNA molecules on the length scale of the persistence length (~150 bp) are unexpectedly flexible, both the cyclization and SAXS studies have been contradicted by subsequent clarifying experiments. The subject remains intriguing, controversial, and important. This is because the true character of local DNA behavior determines the energetics of nucleosome positioning, DNA looping, and transcriptional regulation.
5. What causes sequence-dependent DNA curvature and flexibility?
5.1 Sequence dependence of DNA curvature
One of the first observations suggesting sequence-dependent DNA curvature was anomalously slow electrophoretic mobility through native polyacrylamide gels for certain DNA molecules. A noteworthy example was a segment of protozoan kinetoplast DNA, part of a natural DNA minicircle chromosome. Sequence analysis and subsequent clever gel assays revealed that A4–6 tracts phased with the DNA helical repeat are responsible for the observed mobility effects (Hagerman, Reference Hagerman1985; Koo et al. Reference Koo, Wu and Crothers1986; Wu & Crothers, Reference Wu and Crothers1984). This result emphasized a challenging puzzle: what is it about phased A-tracts that causes a gel mobility anomaly? Are the sequences intrinsically curved or anisotropically flexible? Exactly what sub-sequences have the unusual property (the A-tracts or the intervening ‘non-A’-tracts)? What is the molecular basis for the anomaly? Why do phased 5′-A4T4-3′ sequences induce curvature, while 5′-T4A4-3′ sequences do not?
Work in this area led to classical models of DNA curvature that invoked either virtual wedges in dinucleotide stacks (Bolshoy et al. Reference Bolshoy, Mcnamara, Harrington and Trifonov1991; Cacchione et al. Reference Cacchione, De Santis, Foti, Palleschi and Savino1989; Calladine et al. Reference Calladine, Drew and Mccall1988) or helical axis deformation at junctions between different double-helical forms (Crothers et al. Reference Crothers, Haran and Nadeau1990; Koo & Crothers, Reference Koo and Crothers1988; Koo et al. Reference Koo, Wu and Crothers1986, Reference Koo, Drak, Rice and Crothers1990; Nadeau & Crothers, Reference Nadeau and Crothers1989). The concept of DNA curvature at such junctions had been predicted earlier (Selsing et al. Reference Selsing, Wells, Alden and Arnott1979). The development of these classic models (reviewed by Hagerman, Reference Hagerman1985, Reference Hagerman1990, Reference Hagerman1992) and recent approaches to predict DNA curvature are addressed in the next section. Discussion here will focus on the possible physical basis for sequence-dependent DNA curvature. It is important to note that all of these models were essentially empirical, assigning microscopic properties to junctions or wedges that would explain the experimental data.
5.2 Electrostatic effects in DNA curvature and flexibility
It is evident that different DNA sequences commonly adopt polymorphic geometries in solution over the range of B, B*, and A double helices. Is this polymorphism due only to base pair stacking preferences, or could counterions play a role (Williams & Maher, Reference Williams and Maher2000)? The role of counterions in controlling DNA structure is not understood. As described in section 3 (above), Manning's influential counterion condensation theory expresses the notion that highly charged polyelectrolytes, such as DNA, essentially condense counterions from the diffuse bathing solution into a layer of ~1 M local concentration near the polymer surface (Manning, Reference Manning1978). The concentration of this condensed counterion ‘phase’ is predicted to be essentially independent of the bulk counterion concentration. Substantial (but not complete) polyelectrolyte charge screening accompanies counterion condensation, but the magnitude of stretching forces between residual unscreened nearest-neighbor phosphate anion charges along DNA remains poorly understood. Furthermore, NMR experiments have detected counterion distributions that are asymmetric and sequence dependent (Hud & Feigon, Reference Hud and Feigon1997, Reference Hud and Feigon2002; Hud et al. Reference Hud, Schultze and Feigon1998, Reference Hud, Sklenar and Feigon1999). Related results have been observed using X-ray crystallography (Hamelberg et al. Reference Hamelberg, Mcfail-Isom, Williams and Wilson2000, Reference Hamelberg, Williams and Wilson2001; Howerton et al. Reference Howerton, Sines, Vanderveer and Williams2001; McFail-Isom et al. Reference Mcfail-Isom, Sines and Williams1999; Shui et al. Reference Shui, Mcfail-Isom, Hu and Williams1998a, Reference Shui, Sines, Mcfail-Isom, Vanderveer and Williamsb; Sines et al. Reference Sines, Mcfail-Isom, Howerton, Vanderveer and Williams2000; Williams & Maher, Reference Williams and Maher2000), free electrophoresis (Dong et al. Reference Dong, Stellwagen and Stellwagen2009; Lu & Stellwagen, Reference Lu and Stellwagen2008; Stellwagen et al. Reference Stellwagen, Magnusdottir, Gelfi and Righetti2001), and simulation (Beveridge et al. Reference Beveridge, Young, Sprous, Leontis and Santa Lucia1998; McConnell & Beveridge, Reference Mcconnell and Beveridge2000; Sprous et al. Reference Sprous, Young and Beveridge1998; Young & Beveridge, Reference Young and Beveridge1998; Young et al. Reference Young, Jayaram and Beveridge1997a, Reference Young, Ravishanker and Beveridgeb). This has raised stimulating discussion about the degree to which sequence-dependent asymmetric counterion recruitment into the DNA grooves could alter groove geometry and cause double-helix polymorphism by unbalancing charge repulsions across the groove (McConnell & Beveridge, Reference Mcconnell and Beveridge2000; McFail-Isom et al. Reference Mcfail-Isom, Sines and Williams1999; Williams & Maher, Reference Williams and Maher2000) or across the double helix (Strauss & Maher, Reference Strauss and Maher1994).
These interesting results suggest strong correlations between asymmetry in cation localization, DNA groove geometry, and DNA curvature. However, the cause/effect role of counterion distribution remains both unknown and controversial. Does the asymmetry in counterion distribution arise because preferred cation binding sites are specified by the sequence of base pair edges? Do these cation distributions then exert electrostatic forces that restructure DNA by asymmetrically neutralizing interphosphate stretching forces? Is polymorphism in groove geometry driven by base pair stacking, and counterions simply decorate these sequence-dependent features without influence on DNA structure? These fundamental questions remain unresolved, even in MD simulations.
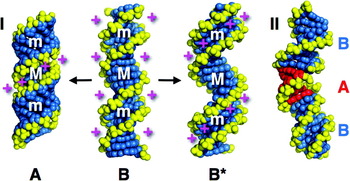
An important contribution to unifying the concepts of ion distributions, helical polymorphisms, and sequence-dependent DNA curvature has been formulated by Hud and co-workers (Hud & Plavec, Reference Hud and Plavec2003; Hud & Polak, Reference Hud and Polak2001). The revised junction model of Hud and Plavec invokes the correlation between groove polymorphism and counterion localization. The authors conceive of DNA sequences as participating in structural equilibria between different double-helical forms. In particular, they categorize DNA sequences into three groups (A-tracts, G-tracts, and generic DNA) with different equilibrium distributions between B, B*, and A forms (Fig. 5). According to this model, the A-tract group of sequences (length >4, AA, TT, or AT base steps with no TA steps) is more likely to adopt the B*-form with a narrow minor groove rich in counterions. G-tracts are defined as containing only G and C residues with prominent GG steps. These sequences are argued to be more likely to sample the A-DNA conformation featuring a narrow major groove rich in counterions. All other DNA sequences are considered ‘generic’ and most likely to assume B-form. The Hud–Plavec model then proposes a junction explanation for helix curvature. Simple conservation of base stacking between DNA segments with different helical forms alters the helix axis. The phasing of such junctions relative to the DNA helical repeat determines the global curvature of a DNA sequence. The Hud–Plavec model adds coherence to the interpretation of sequence-directed DNA curvature without resolving the cause/effect puzzle of cations and groove geometry.
Schematic depiction of the Hud–Plavec model linking counterion distributions, helix polymorphism, and sequence-directed DNA curvature at junctions. (I) Proposed sequence-dependent duplex DNA polymorphism between generic DNA (canonical B-form, center), G-tract sequences (propensity for A-form, left), and A-tract sequences (B*-form, right). Grooves (M, major; m, minor) and simplified cation (+) distributions (magenta) are shown. (II) Example of sequence-dependent DNA curvature due to junctions between B-form DNA and a 5 bp segment of A-form DNA (red). Helical structures were generated with 3DNA (Zheng et al. Reference Zheng, Lu and Olson2009). DNA backbones are shown in yellow.

5.3 Sequence dependence of DNA flexibility
DNA conformation has been shown to be sequence dependent. In fact, local DNA deformability (softness) with respect to bending and twisting is also sequence dependent. It remains unknown how sequence-dependent anisotropic deformability influences anomalous gel mobility. Protein recognition of DNA depends on the initial DNA structure (including groove shape and curvature). For protein–DNA complexes involving distorted DNA, the stability of the complex depends on the sequence-dependent pliability of the double helix. An early study suggested that the DNA persistence length could vary 4-fold between the relatively flexible poly(dA)•poly(dT) and the relatively rigid poly(dG)•poly(dC), and the torsional DNA stiffness could vary at least 40-fold (Hogan et al. Reference Hogan, Legrange and Austin1983). Subsequent work has explored relationships between stacking energy, thermal stability, and persistence length (Protozanova et al. Reference Protozanova, Yakovchuk and Frank-Kamenetskii2004; SantaLucia, Reference Santalucia1998; Sivolob & Khrapunov, Reference Sivolob and Khrapunov1995; Virstedt et al. Reference Virstedt, Berge, Henderson, Waring and Travers2004).
As will be discussed in greater detail below, packaging of eukaryotic DNA onto histone octamers in nucleosomes involves substantial DNA deformation. DNA sequences can be characterized or selected for their histone octamer affinity, thus presumably measuring flexibility rather than curvature (Lowary & Widom, Reference Lowary and Widom1998). Sequences with a high proclivity for nucleosome formation were shown by DNA cyclization analysis to have 2-fold increased longitudinal flexibility and one-third lower torsional constants (Roychoudhury et al. Reference Roychoudhury, Sitlani, Lapham and Crothers2000). Among such sequences, the flexibility of alternating A–T was one-third higher than mixed sequences (Zhang & Crothers, Reference Zhang and Crothers2003). Analysis of nucleosome positioning in genomic DNA has proven to be a fertile approach to deducing apparent sequence requirements for flexibility (Caserta et al. Reference Caserta, Agricola, Churcher, Hiriart, Verdone, Di Mauro and Travers2009; Drew & Travers, Reference Drew and Travers1985; Kaplan et al. Reference Kaplan, Moore, Fondufe-Mittendorf, Gossett, Tillo, Field, Leproust, Hughes, Lieb, Widom and Segal2009; Satchwell et al. Reference Satchwell, Drew and Travers1986; Segal et al. Reference Segal, Fondufe-Mittendorf, Chen, Thastrom, Field, Moore, Wang and Widom2006; Trifonov & Sussman, Reference Trifonov and Sussman1980; Widom, Reference Widom2001). To a first approximation, sequences favored for deformation in nucleosomes are over-populated by AA/TT/TA dinucleotides phased with the DNA helical repeat (i.e. occurring at intervals of ~10 bp), with GC dinucleotide steps phased 5 bp away. Such sequences appear not to be intrinsically curved, but anisotropically flexible (Lowary & Widom, Reference Lowary and Widom1997, Reference Lowary and Widom1998; Segal et al. Reference Segal, Fondufe-Mittendorf, Chen, Thastrom, Field, Moore, Wang and Widom2006). It should be noted, however, that it remains formally possible that the phased AA/TT/TA pattern favored in nucleosomal DNA is not predominantly due to enhanced bend flexibility. Instead, this sequence signature could endow the DNA with a particularly narrow minor groove that enhances local negative electrical potential in the groove, stabilizing histone binding by strengthening electrostatic contacts with protruding cationic arginines that engage the DNA minor groove at these positions (Rohs et al. Reference Rohs, West, Sosinsky, Liu, Mann and Honig2009).
Once assumed to be monotonous in structure, even fully base-paired DNA displays local sequence-dependent groove geometry, axial curvature, and flexibility. These features may be crucial in the energetics of DNA recognition and deformation by sequence-specific proteins. The importance of these properties for indirect DNA readout by sequence-non-specific proteins (including histone octamers) suggests that the DNA sequence also encodes chromatin packaging and gene expression signals (Segal et al. Reference Segal, Fondufe-Mittendorf, Chen, Thastrom, Field, Moore, Wang and Widom2006).
6. Can sequence-dependent DNA curvature and flexibility be predicted?
6.1 Base pair step models
Given the significance of sequence-dependent DNA curvature and flexibility, the prediction of such properties is an important challenge. A number of early models deduced or proposed sequence-dependent base pair twist, roll, and tilt values for each of the ten unique base pair steps. Examples of models include those involving curvature at non-A-tract sequences (Calladine et al. Reference Calladine, Drew and Mccall1988; Satchwell et al. Reference Satchwell, Drew and Travers1986), those involving curvature within A-tracts (Bolshoy et al. Reference Bolshoy, Mcnamara, Harrington and Trifonov1991; Cacchione et al. Reference Cacchione, De Santis, Foti, Palleschi and Savino1989), and those involving curvature at junctions between helical forms (Koo & Crothers, Reference Koo and Crothers1988). The various models have both strengths and weaknesses in their predictive power (Goodsell & Dickerson, Reference Goodsell and Dickerson1994). It is important to note that they sought empirically to predict DNA properties without the goal of explaining these properties.
Increasingly sophisticated dinucleotide step models allow the prediction of both DNA curvature (Liu & Beveridge, Reference Liu and Beveridge2001; Young et al. Reference Young, Ravishanker, Beveridge and Berman1995) and flexibility (Czapla et al. Reference Czapla, Swigon and Olson2006, Reference Czapla, Swigon and Olson2008; Matsumoto & Olson, Reference Matsumoto and Olson2002; Olson et al. Reference Olson, Gorin, Lu, Hock and Zhurkin1998, Reference Olson, Swigon and Coleman2004; Olson & Zhurkin, Reference Olson and Zhurkin2000; Swigon et al. Reference Swigon, Coleman and Olson2006; Zheng et al. Reference Zheng, Lu and Olson2009) from the growing databases of high-resolution DNA and DNA–protein structures. The impressive strategy implemented by Olson and co-workers mines average values and deviations for six base pair step parameters in known structures, allowing DNA structure prediction implemented in a web server tool (Lu & Olson, Reference Lu and Olson2003). Empirical energy functions are deduced, allowing specification of the expected range of thermal motion for each base pair step. These estimates substantiate many established features of duplex DNA deformability, including the conclusion that pyrimidine–purine base pair steps are especially flexible. Recent publications have extended the prediction of DNA stiffness to parameters based on trinucleotide step datasets (Gromiha, Reference Gromiha2000).
6.2 MD simulations and other models
Approaches to both understand and predict sequence-dependent DNA curvature and flexibility have also been undertaken using MD simulations. These strategies have grown in sophistication with increasingly facile parallel computing. MD simulations have been applied to sequence-directed DNA curvature. Initial studies were performed with unstrained DNA segments (Beveridge et al. Reference Beveridge, Young, Sprous, Leontis and Santa Lucia1998; Dixit et al. Reference Dixit, Beveridge, Case, Cheatham, Giudice, Lankas, Lavery, Maddocks, Osman, Sklenar, Thayer and Varnai2005; Flatters et al. Reference Flatters, Young, Beveridge and Lavery1997; Jayaram et al. Reference Jayaram, Sprous, Young and Beveridge1998; Sprous et al. Reference Sprous, Young and Beveridge1998; Young & Beveridge, Reference Young and Beveridge1998; Young et al. Reference Young, Ravishanker and Beveridge1997b). An international collaboration has resulted in extended MD simulations of DNA sequences representing multiple samples of the 136 possible unique tetranucleotide sequences in duplex DNA (Beveridge et al. Reference Beveridge, Barreiro, Byun, Case, Cheatham, Dixit, Giudice, Lankas, Lavery, Maddocks, Osman, Seibert, Sklenar, Stoll, Thayer, Varnai and Young2004). Such efforts have allowed the creation of reference datasets from which to deduce trends and compare results with flexibility parameters extracted from crystal structures. The work also firmly addresses issues of reproducibility, sampling, ion fluctuations, and convergence.
More recent simulations have modeled DNA under various bending and twisting forces to explore induced conformational changes (Harris, Reference Harris2006). Forces include bending in small minicircles (Curuksu et al. Reference Curuksu, Zacharias, Lavery and Zakrzewska2009; Lankas et al. Reference Lankas, Lavery and Maddocks2006; Maher, Reference Maher2006), stretching (Harris et al. Reference Harris, Sands and Laughton2005), protein-mediated DNA looping (Balaeff et al. Reference Balaeff, Mahadevan and Schulten2004; Czapla et al. Reference Czapla, Swigon and Olson2008; Swigon et al. Reference Swigon, Coleman and Olson2006; Villa et al. Reference Villa, Balaeff and Schulten2005), and supercoiling (Harris et al. Reference Harris, Laughton and Liverpool2008; Liverpool et al. Reference Liverpool, Harris and Laughton2008). Even more complex challenges to predictive modeling include DNA deformed into loops by proteins or bent onto the surface of proteins.
As discussed in the next section, loop structures are involved in transcriptional repression in bacteria. In eukaryotic cells, DNA commonly exists wrapped tightly onto the histone octamer surface and DNA looping may be important in eukaryotic gene regulation as well. Approaches to modeling these structures and dynamics of such assemblages include several interesting approaches. A statistical mechanical treatment of DNA polymer behavior (Zhang et al. Reference Zhang, Mcewen, Crothers and Levene2006b) has been applied to rationalize length-dependent in vivo DNA looping data in the lac operon (Zhang et al. Reference Zhang, Mcewen, Crothers and Levene2006a). Multiscale modeling and simulation of the same complex were presented by Schulten and co-workers (Balaeff et al. Reference Balaeff, Mahadevan and Schulten2004; Villa et al. Reference Villa, Balaeff and Schulten2005). This approach coupled MD for all-atom models of the protein components with a continuous polymer model of the DNA. Modeling and prediction of lac DNA looping were also undertaken by Olson and co-workers (Swigon et al. Reference Swigon, Coleman and Olson2006) using a theory of sequence-dependent DNA elasticity based on the base pair step sequence. It remains to be seen if tri- or tetranucleotide step data will enrich this approach (Dixit et al. Reference Dixit, Beveridge, Case, Cheatham, Giudice, Lankas, Lavery, Maddocks, Osman, Sklenar, Thayer and Varnai2005). The complexity of even this simplest of bacterial gene regulatory switches represents a daunting challenge for simulation. This is an expansive area for collaboration to generate experimental data that distinguish between the predictions of the different models. It is crucial that highly accurate in vivo gene regulation data are available in order to create meaningful quantitative models of gene regulation.
6.3 Predicting DNA shape
An important recent contribution to the prediction of sequence-dependent DNA structure has come through cataloging patterns of base pair accessibility to damage by hydroxyl radicals. This reactive species is similar in size to water, and hydrogen abstraction reaction rates report solvent accessibility of the DNA grooves. It has been demonstrated that hydroxyl radical reactivity patterns measured for a collection of test sequences can then be used to accurately predict reaction patterns for new sequences through di- and trinucleotide matches. This approach to prediction of DNA ‘topology’ (shape accessible to solvent) has sufficient accuracy to allow a survey of genome-wide protein binding site conservation, even when sequence conservation is difficult to detect (Parker et al. Reference Parker, Hansen, Abaan, Tullius and Margulies2009).
Careful bioinformatics analysis of the 3D structures of protein–DNA complexes has also recently led Honig and co-workers to propose that minor groove negative electrostatic potential is a key recognition element for some proteins (Rohs et al. Reference Rohs, West, Sosinsky, Liu, Mann and Honig2009). This study suggests that minor groove narrowing is a feature of focused electrostatic potential that may be predicted from sequence–structure correlation.
7. How do cells manage the DNA stiffness problem?
7.1 DNA softening in vivo
There have been hints that the apparent stiffness of DNA is lower in living cells than would be predicted from in vitro measurements. This is an intriguing result. Apparent softening of DNA with respect to both bending and twisting is observed in vivo. Initial results came from classic studies of E. coli lactose (lac) operon transcriptional regulation (Fig. 2g) where a DNA repression loop forms in the presence of lac repressor tetramer (Becker et al. Reference Becker, Kahn and Maher2005; Eismann & Müller-Hill, Reference Eismann and Müller-Hill1990; Kramer et al. Reference Kramer, Niemoller, Amouyal, Revet, Von Wilcken-Bergmann and Müller-Hill1987, Reference Kramer, Amouyal, Nordheim and Müller-Hill1988; Mossing & Record, Reference Mossing and Record1986; Muller et al. Reference Muller, Oehler and Müller-Hill1996; Oehler et al. Reference Oehler, Eismann, Kramer and Müller-Hill1990). Early estimates suggested enhanced DNA softness to bending (7-fold) and twisting (2-fold) relative to naked DNA studied in solution (Bellomy et al. Reference Bellomy, Mossing and Record1988; Law et al. Reference Law, Bellomy, Schlax and Record1993; Mossing & Record, Reference Mossing and Record1986). Using a statistical–mechanical model of DNA bending and protein–DNA looping, recent revised estimates for the bending and twisting anomalies are 1·6-fold and 3-fold, respectively (Zhang et al. Reference Zhang, Mcewen, Crothers and Levene2006a). The DNA flexibility mystery also applies to eukaryotic DNA organized into chromatin. The spooling of DNA onto histone octamers to form nucleosomes should not, in principle, change its inherent flexibility. The naked ‘linker’ segments of DNA between nucleosomes might be expected to determine the flexibility of the resulting fiber. However, careful comparison of DNA persistence length estimates based on genetic recombination in vitro and in vivo suggests a 2-fold reduction in the DNA bending persistence length (from 50 to 27 nm) in vivo (Ringrose et al. Reference Ringrose, Chabanis, Angrand, Woodroofe and Stewart1999).
7.2 Architectural DNA-binding proteins
It has been hypothesized that cellular DNA, both prokaryotic and eukaryotic, displays unexpected apparent flexibility because of negative supercoiling and DNA bending proteins that are abundant in cells. Sequence-non-specific architectural DNA bending proteins have been proposed to decrease the apparent persistence length of DNA by introducing random and transient sites of kinking and bending (Crothers, Reference Crothers1993; Paull et al. Reference Paull, Carey and Johnson1996; Paull et al. Reference Paull, Haykinson and Johnson1993; Paull & Johnson, Reference Paull and Johnson1995; Travers et al. Reference Travers, Ner and Churchill1994). This may be a universal property of architectural DNA-binding proteins including the eukaryotic high mobility group B (HMGB) non-histone chromatin proteins and the heat unstable (HU) protein of bacteria (Bianchi, Reference Bianchi1994; Thomas & Travers, Reference Thomas and Travers2001). A dramatic increase in apparent DNA cyclization propensity was observed when linear DNAs were ligated in the presence of crude heat-treated nuclear extract from human cells, demonstrating the profound capabilities of these proteins (Ross et al. Reference Ross, Hardwidge and Maher2001).
High mobility group (HMG) proteins are small, abundant eukaryotic chromatin-associated proteins of three unrelated families (Bustin, Reference Bustin2001; Grosschedl et al. Reference Grosschedl, Giese and Pagel1994; Hock et al. Reference Hock, Furusawa, Ueda and Bustin2007). HMGA proteins contain AT-hook motifs, HMGN proteins have nucleosome binding domains, and HMGB proteins contain one or two tandem ‘HMG box’ motifs. Structures and DNA bending properties of bacterial HU and eukaryotic HMGB proteins are compared to each other and the histone octamer in Fig. 6. Although all have unrelated structures, HMGB monomers and HU dimers cause strong DNA bending through a combination of minor groove intercalation (by amino acid side chains) and electrostatic interactions involving cationic amino acids that asymmetrically neutralize the DNA double helix.
Sequence-non-specific architectural protein complexes with bent DNA. (a) Top and side views of the nucleosome core particle (pdb 1AOI) in which the histone octamer (red) bends 146 bp of DNA by 600°. (b) Bacterial HU protein (red) bending DNA (pdb AHU2). (c) Yeast Nhp6A (pdb 1J5N), a single-box HMGB protein (red) bending DNA through partial minor groove intercalation of amino acid side chains (white and green) and asymmetric charge neutralization (magenta). (d) Two-box mammalian HMGB construct bending DNA (pdb 2GZK). DNA backbones are shown in yellow.

The role of architectural proteins in enhancing the apparent flexibility of DNA and chromatin is under study. Architectural proteins appear to influence DNA looping in bacterial gene control. HU has been shown to participate in bending and kinking DNA in the repression loop of the gal operon in vitro (ensemble and single-molecule experiments) and in vivo (Aki & Adhya, Reference Aki and Adhya1997; Lewis & Adhya, Reference Lewis and Adhya2002; Lia et al. Reference Lia, Bensimon, Croquette, Allemand, Dunlap, Lewis, Adhya and Finzi2003). Despite decades of study it had not been known if HU might be involved in DNA looping at other repression loops such as lac. New evidence raises this possibility. In vivo assays of lac looping have been performed in several variations (Becker et al. Reference Becker, Kahn and Maher2005, Reference Becker, Kahn and Maher2007, Reference Becker, Kahn and Maher2008; Bellomy et al. Reference Bellomy, Mossing and Record1988; Kramer et al. Reference Kramer, Niemoller, Amouyal, Revet, Von Wilcken-Bergmann and Müller-Hill1987; Law et al. Reference Law, Bellomy, Schlax and Record1993; Mossing & Record, Reference Mossing and Record1986; Muller et al. Reference Muller, Oehler and Müller-Hill1996; Oehler et al. Reference Oehler, Eismann, Kramer and Müller-Hill1990). Classic studies by Record and Müller-Hill showed that promoter repression by a weak downstream lac operator is dramatically strengthened by a strong upstream lac operator. Repression as a function of inter-operator distance gives a sensitive readout of the unfavorable energetics associated with DNA (and protein) bending and twisting (Fig. 7a). Repression is leaky when operators are positioned on opposite DNA faces because DNA looping also requires unfavorable DNA twisting. The result is an oscillating dependence of repression looping on inter-operator DNA length, with a period near 10 bp, the helical repeat of DNA (Fig. 7b). Repression is enhanced for properly phased operators because DNA looping increases the effective repressor concentration experienced by the downstream operator by including collisions with repressor tetramers bound upstream. This in vivo looping system can be analyzed quantitatively (for example, Fig. 7b). Data in the lower panels show reporter gene expression as a function of DNA loop size in the absence or presence of IPTG inducer. It was both interesting and unexpected that faint oscillations in repression were observed even in the presence of saturating IPTG inducer concentrations. Data in the upper panels show the +IPTG/−IPTG (induced/repressed) ratio.
Experimental model of DNA looping in the control of the lactose operon in E. coli. (A) Control states of the promoter. Strong (Osym) and weak (O2) operators for binding lac repressor tetramer (red) flank the lac promoter. Unfavorable operator positions that require DNA bending or twisting strain are poorly repressed (‘on’), while operator spacings compatible with DNA looping allow gene repression (‘off’). (B, C) Example data (Becker et al. Reference Becker, Kahn and Maher2005) comparing repressed and induced lac promoter expression for different operator spacings. (b) Wild-type cells under induced (IPTG) or repressed conditions showing lac promoter activity as normalized reporter activities (bottom), or their ratio (top). (c) Results for E. coli cells lacking the sequence non-specific protein, HU, showing DNA looping disability.

Thermodynamic modeling of lac looping data has been performed in several ways, all based on the notion that the probability of proximal operator occupancy by repressor is inversely proportional to transcription (Becker et al. Reference Becker, Kahn and Maher2005, Reference Becker, Kahn and Maher2007, Reference Becker, Kahn and Maher2008; Bellomy et al. Reference Bellomy, Mossing and Record1988; Bintu et al. Reference Bintu, Buchler, Garcia, Gerland, Hwa, Kondev and Phillips2005; Law et al. Reference Law, Bellomy, Schlax and Record1993; Zhang et al. Reference Zhang, Mcewen, Crothers and Levene2006a). Fitting of the data in Fig. 7b led Zhang et al. (Reference Zhang, Mcewen, Crothers and Levene2006a) to conclude that the apparent in vivo persistence length of DNA was 95 bp (one-third lower than the in vitro value) and the twist constant was 0·7×10−19 erg cm (less than half of the in vitro value). Repression experiments were repeated in isogenic E. coli strains with disruption of the genes encoding HU (Becker et al. Reference Becker, Kahn and Maher2005) (Fig. 7c). DNA looping was strongly disabled. In fact, the fit value for the DNA bending persistence length in this strain (128 bp) is close to that expected based on in vitro analysis (Zhang et al. Reference Zhang, Mcewen, Crothers and Levene2006a). This study suggests that HU protein directly participates in lac repression loops, a hypothesis that is now under further investigation.
This in vivo result should not be interpreted as indicating that lac repressor cannot induce short DNA loops without architectural proteins. Indeed, such loops can be elegantly detected in vitro by single-molecule tethered particle motion and AFM experiments (Han et al. Reference Han, Garcia, Blumberg, Towles, Beausang, Nelson and Phillips2009; Wong et al. Reference Wong, Guthold, Erie and Gelles2008) and by classical methods (Kramer et al. Reference Kramer, Niemoller, Amouyal, Revet, Von Wilcken-Bergmann and Müller-Hill1987). Loop stability may be enhanced in vivo by architectural proteins.
Strikingly, expression of structurally unrelated eukaryotic HMGB architectural proteins can rescue DNA looping in E. coli cells lacking HU (Becker et al. Reference Becker, Kahn and Maher2005, Reference Becker, Kahn and Maher2008; Sebastian et al. Reference Sebastian, Bystry, Becker and Maher2009). This result suggests a fundamental mechanism of architectural proteins in altering DNA physical properties in vivo.
Repression loops comparable to those observed in prokaryotes have not been found in eukaryotic systems, but have been proposed (Zeller et al. Reference Zeller, Griffith, Moore, Kirchhamer, Britten and Davidson1995). Eukaryotic gene activation involves recruitment of both chromatin remodeling factors (Bhaumik & Green, Reference Bhaumik and Green2001) and basal transcription machinery (Buratowski, Reference Buratowski1994; Ptashne & Gann, Reference Ptashne and Gann1997; Tjian & Maniatis, Reference Tjian and Maniatis1994) to promoters. Models for eukaryotic promoter and enhancer function have often invoked DNA loops (Ptashne & Gann, Reference Ptashne and Gann1997; Rippe et al. Reference Rippe, Von Hippel and Langowski1995), but it has been unclear if the looped DNA is naked or assembled into nucleosomal chromatin. Long-range DNA looping in eukaryotes has been suggested by studies of telomeres, locus control regions, and yeast gene transcription termination (Ansari & Hampsey, Reference Ansari and Hampsey2005; Greider, Reference Greider1999; Zhou et al. Reference Zhou, Xin, Song, Di, Liu, Wu, Liu and Liang2006). Proof of short-range DNA looping in transcription activation is lacking, although there are intriguing data (Dobi & Winston, Reference Dobi and Winston2007). An alternative model is that enhancers function by recruiting chromatin remodeling agents that regionally loosen histone octamers, increasing the exposure of promoter DNA to basal transcription factors and RNA polymerase. On the other hand, powerful new mapping techniques such as the chromosome conformation capture (3C) method (Dekker et al. Reference Dekker, Rippe, Dekker and Kleckner2002; Gondor et al. Reference Gondor, Rougier and Ohlsson2008; Lieberman-Aiden et al. Reference Lieberman-Aiden, Van Berkum, Williams, Imakaev, Ragoczy, Telling, Amit, Lajoie, Sabo, Dorschner, Sandstrom, Bernstein, Bender, Groudine, Gnirke, Stamatoyannopoulos, Mirny, Lander and Dekker2009) (Fig. 2h) are being applied to monitor DNA folding and looping after cross-linking in living cells. These studies suggest long-range chromatin flexibility (Tolhuis et al. Reference Tolhuis, Palstra, Splinter, Grosveld and De Laat2002; Vernimmen et al. Reference Vernimmen, De Gobbi, Sloane-Stanley, Wood and Higgs2007; Zhou et al. Reference Zhou, Xin, Song, Di, Liu, Wu, Liu and Liang2006). It is interesting to ask whether the DNA flexibility required for these structures is supported by polymer theory or whether factors such as architectural proteins could play roles. Long-range looping should not be constrained by the stiffness of naked DNA (Allemand et al. Reference Allemand, Cocco, Douarche and Lia2006; Rippe et al. Reference Rippe, Von Hippel and Langowski1995). Short-range looping is a more challenging question.
Spooling onto histone octamers is not a priori expected to change the bend and twist flexibilities of the unbound linker DNA segments that control the overall flexibility of the chromatin fiber. However, single-molecule force–extension studies of reconstituted chromatin fibers have allowed flexibility studies in vitro (Brower-Toland et al. Reference Brower-Toland, Smith, Yeh, Lis, Peterson and Wang2002; Kruithof et al. Reference Kruithof, Chien, Routh, Logie, Rhodes and Van Noort2009). For example, it was found that the stretch behavior of chromatin was not consistent with the classical WLC model, but showed Hookian spring behavior where linear force–extension plots were obtained at low forces.
Constraints on DNA looping in living eukaryotic cells have also been measured. As described above, the rates of site-specific recombination by FLP recombinase have been measured as a function of site separation distance (Ringrose et al. Reference Ringrose, Chabanis, Angrand, Woodroofe and Stewart1999). The authors reported in vitro measurements consistent with WLC polymer theory for naked DNA (persistence length near 50 nm). In contrast, simple fits to data obtained in transfected mammalian cells were interpreted as evidence for a 2-fold shorter apparent in vivo persistence length (~27 nm). If true, this result is reminiscent of DNA behavior in bacteria. The result is striking because of the predominance of nucleosomal DNA packaging in vivo. It remains possible that architectural proteins influence DNA looping in eukaryotes by altering the apparent flexibility of the ~50 bp segments of internucleosomal linker DNA.
A particularly interesting study was a genetic approach to understand what factors limit transcription regulation to a local phenomenon in the compact genome of budding yeast (Dobi & Winston, Reference Dobi and Winston2007). In this organism, long-range effects of cis-regulatory elements could be deleterious. The authors identified mutations that conferred longer-range transcription activation. Interestingly, one of the mutants inactivated the sequence non-specific architectural DNA-binding protein Spt2p. This result raises the intriguing possibility that average DNA loop size might be governed by the concentration of architectural proteins in vivo. On the other hand, Johnston and co-workers found that removal of yeast HMGB proteins Nhp6A/B did not influence the distance dependence of transcription activation, but the potency of the activators themselves (Paull et al. Reference Paull, Carey and Johnson1996). Thus, it remains unclear whether and how enhanced apparent DNA flexibility is required in eukaryotes, and the role played by architectural DNA-binding proteins in eukaryotes versus prokaryotes (Fig. 8).
Architectural DNA-binding protein effects on naked DNA. (a) The locally stiff DNA double helix (left) adopts more compact conformations (center) in the presence of randomly bound architectural DNA-binding proteins (red triangles), decreasing the average end–end distance (double-headed arrows) as detected by enhanced cyclization rate (right) in the presence of DNA ligase. (b) Example of ~200 bp circular protein–DNA complex facilitated by HMGB protein Nhp6A (red) in Monte-Carlo simulation. (c) Potential role of architectural protein (e.g. HU, red triangle) in stabilizing bacterial repression loops.

8. Future challenges
Five questions were posed in this review: Why is DNA stiff? How adequate is the WLC model for describing DNA in vitro? What causes sequence-dependent DNA curvature and flexibility? Can sequence-dependent DNA curvature and flexibility be predicted? How do cells manage the DNA stiffness problem? Although progress continues to be made toward answering each of these questions, it is exciting (and sobering) that much remains to be learned. Some particularly fundamental problems remain unresolved. Some future challenges and opportunities in understanding DNA curvature and bending are described here.
Although their roles remain unresolved after more than 50 years, electrostatic effects on the physical properties of DNA clearly deserve further study. The common view that interphosphate repulsions are effectively screened under physiological conditions predicts a small effect of bulk salt concentration on DNA persistence length. This leaves unresolved the question of whether (and to what extent) residual phosphate charges after counterion condensation contribute to a stretching tension in double-helical DNA. As described in section 3, there are arguments on both sides of the issue. A convergence of theory, experiment, and simulation is needed. Our own experimental approach has been to perturb DNA electrostatics using chemical or biochemical methods, and to measure resulting changes in DNA shape. Because each kind of perturbation has both electrostatic and non-electrostatic consequences, any given strategy may yield misleading results due to unforeseen non-electrostatic effects. We have sought a consistent pattern (such as DNA bending toward its asymmetrically neutralized surface) that appears to be independent of the neutralization method. Additional experimental approaches are needed to test theories of DNA stiffness. Furthermore, fundamental electrostatic effects ought to be amenable to MD simulations. Current limitations include the proper treatment of ions, the length of simulation, and the need to simulate DNA molecules of sufficient length to deduce bending fluctuations and persistence length. Improved computational methods may provide new opportunities (Materese et al. Reference Materese, Savelyev and Papoian2009).
The WLC model has proven to be remarkably effective at predicting aspects of DNA behavior over a wide length range. This review has touched on current efforts to define the lower length limit for applicability of the WLC model. There is now evidence that the WLC model will apply well even to tightly bent and twisted DNA molecules below 100 bp in length. The classic method of DNA ligase-catalyzed cyclization kinetics remains a central tool. There are opportunities for new single-molecule or bulk experimental methods to collect DNA flexibility data more rapidly across a wide range of lengths in solution.
Improved prediction of sequence-dependent DNA conformation and flexibility is needed. The mining of knowledge-based dinucleotide and trinucleotide helical parameters from databases of structures and simulations has been impressive. These approaches provide a framework for understanding many cases of sequence-dependent curvature. Similar approaches applied to nucleosome positioning sequences are addressing the problem of predicting sequence-dependent deformability (Caserta et al. Reference Caserta, Agricola, Churcher, Hiriart, Verdone, Di Mauro and Travers2009). These approaches have not reached consensus (Caserta et al. Reference Caserta, Agricola, Churcher, Hiriart, Verdone, Di Mauro and Travers2009; Kaplan et al. Reference Kaplan, Moore, Fondufe-Mittendorf, Gossett, Tillo, Field, Leproust, Hughes, Lieb, Widom and Segal2009; Segal et al. Reference Segal, Fondufe-Mittendorf, Chen, Thastrom, Field, Moore, Wang and Widom2006). There remains uncertainty about the forces and processes that cause the properties detected when sequence and structure are correlated. Structural databases could be biased, and simulation databases could be inadequate. Many future opportunities exist for the accurate prediction of sequence-dependent DNA curvature and flexibility.
Even as new approaches are required to monitor DNA curvature and flexibility over tens to thousands of base pairs in vitro, this is even more true for measuring these properties in vivo. As described in this review, proteins both spool and kink DNA, yielding a material (bacterial or eukaryotic chromatin) whose properties appear different from naked DNA. Powerful qualitative assays such as chromatin conformation capture have created new opportunities. Improvements are needed in our ability to measure in vivo chromatin flexibility and dynamics, whether by functional, optical, or spectroscopic means. Such tools may allow us (finally) to understand how the properties of DNA measured by the biophysicist in dilute solution are managed, exploited, and manipulated by the cell to enable genome packaging, replication, and expression as measured by the biologist.
Acknowledgements
The authors acknowledge the important contributions of present and past students (Joe Azok, John Paul Bida, Laura Bond, Laura Cassiday, Tessa Davis, Robert Den, Phil Hardwidge, Anne Keating, Bob McDonald, Andy Rodrigues, Eric Ross, Nadia Sebastian, and Julie Soukup), staff scientists (Matt Ferber, Claudia McDonald, Emily Rueter, and Jeff Zimmerman) and collaborators (Anjum Ansari, Luke Czapla, Michael Fried, Barry Gold, Nathan Israeloff, Jason Kahn, Bill Kirk, Stephen Levene, Gerald Manning, Luis Marky, Udayan Mohanty, Wilma Olson, Yuan Ping Pang, Larry Parkhurst, Rob Phillips, Peter Privalov, Ivan Rasnik, Chris Switzer, Yitzhak Tor, Alex Vologodskii, Loren Williams, Mark Williams, and Darrin York). The important contributions of Nicole Becker are especially noted. Jason Kahn and Nick Hud provided extremely helpful comments on the manuscript. Work on HMGB proteins in the authors' lab is funded by the Mayo Foundation for Medical Education and Research and by NIH grant GM75965.