Introduction
Socioeconomic status is well recognised as a critically important factor in health. Many studies link lower socioeconomic status with worse health outcomes across various medical conditions. Reference Federico, McFarlane, Szefler and Abrams1–Reference Cockrell, Barry, Dick and Greenberg5 Recent studies in CHD have similarly identified an important association between lower socioeconomic status and minority race with worse outcomes. Reference Nashed and O’Neil6–Reference Anderson, Fieldston, Newburger, Bacha and Glied13 Studies specifically looking at single ventricle CHD have associated lower socioeconomic status with longer length of stay, increased early and late mortality, and worse transplant-free survival following Norwood palliation Reference Vashist, Dudeck, Sherfy, Rosenthal and Chaves14–Reference de Loizaga, Schneider and Beck16 and worse six-year neurodevelopmental outcomes in patients with hypoplastic left heart syndrome. Reference Bucholz, Sleeper and Goldberg17 As more studies investigate the relationship between socioeconomic status and health outcomes, the role of an individual’s environment or neighbourhood has also been identified to affect patients’ health, which can be accounted for by using community or area-based socioeconomic deprivation indices, such as the social deprivation index. To our knowledge, there are no studies that have investigated the association between a community-based deprivation index and Glenn outcomes. Only one single institution study has investigated the association between a community-based deprivation index and Fontan outcomes, which found that patients with lower Child Opportunity Index have lower exercise capacity in adolescent and young adult Fontan patients. Reference Karolcik, Wang and Ragavan18 Thus, in this study, we sought to investigate the effects of socioeconomic factors on short and medium-term health outcomes and healthcare utilisation in patients following Glenn and Fontan palliation. We hypothesised that as a patient’s social deprivation index score increased (more severe deprivation of their community), they would have worse short and medium-term health outcomes and decreased health care utilisation following their Glenn and Fontan palliations.
Methods
Study population
This is a single-institution retrospective study including patients who underwent Glenn or Fontan palliations from 2007 to 2024 at Children’s Wisconsin. These dates were chosen to ensure the accuracy of demographic data and zip code in the electronic medical record. We excluded patients if they did not have a documented zip code to calculate their social deprivation index score. All data were extracted from the electronic medical record used at Children’s Wisconsin. In addition to basic demographics, socioeconomic data included race, ethnicity, preferred language, primary insurance type, and last documented zip code to calculate the social deprivation index score. The data were used to create two cohorts, referred to as the Glenn and Fontan cohorts. The Glenn cohort included all patients who underwent Glenn palliation at Children’s Wisconsin and had a documented zip code. The Fontan cohort included all patients who underwent a Fontan palliation at Children’s Wisconsin and had a documented zip code. Patients were included in both cohorts if they had both palliations at Children’s Wisconsin. This study was approved by the local Institutional Review Board with the wavier of informed consent.
Social deprivation index score
The primary socioeconomic factor of interest was the social deprivation index score, which is a community-based deprivation index. The score was calculated using the last known address and the 2015–2019 American census survey data. The social deprivation index is composed of seven demographic characteristics that were collected in the American Community Survey and include percent living in poverty, percent with less than twelve years of education in adults 25 years or older, percent single parent households, percent living in rented housing units, percent living in overcrowded housing unit, percent of households without a vehicle, and percent of unemployed adults under 65 years of age. 19 We selected social deprivation index due to the inclusion of transportation, given the lack of easily accessible public transportation within the surrounding communities of our hospital, as well as the exclusion of race, which we looked at separately. The social deprivation index score ranges from 0–100, where 0 represents the least deprived areas and 100 represents the most deprived areas within the United States. 19
Outcome measures
To identify whether patients’ social deprivation index scores impact short and medium-term health outcomes and health care utilisation after Glenn or Fontan surgery, we collected outcomes one year after Glenn and one and five years after Fontan. Our primary outcome for health was weight and weight percentile as a surrogate for growth and nutrition. Secondary health outcomes included post-operative length of stay, number of hospitalisations, transplant, and mortality. Our outcomes for health care utilisation were the number of attended cardiology appointments and the calculated no show rate of cardiology appointments. We did not include health care utilisation for non-cardiology services, including primary care or emergency department visits, because the electronic medical record precluded complete follow-up data for patients seen by outside physicians.
Data analysis
Data were presented as n (%) or median and interquartile range. Spearman correlation coefficient (ρ) was calculated to examine the relationship between social deprivation index score and continuous variables. Fisher’s Z transformation was applied to construct an asymptotic confidence interval. Logistic regression was used to test the association between social deprivation index score and binary outcomes. Odds ratio and 95% confidence interval were generated. A general linear model was performed to examine the effect of social deprivation index score on various outcomes. Race and preferred language were included in the model as covariates in the multivariable analysis. Where necessary for parametric assumptions, a log transformation was done. A two-sided p-value < 0.05 was considered as the term of statistically significant. SAS version 9.4 (SAS Institute Inc., Cary, NC) was used for statistical analyses.
Results
Study population
A total of 292 patients were eligible for data analysis based on the inclusion criteria of Glenn or Fontan palliation between 2007 and 2024 at our institution, and documented zip code to calculate the social deprivation index score. Of these patients, 197 were included in both the Glenn and the Fontan cohorts. There were an additional 88 patients included in the Glenn cohort for a total of 285. There were an additional 7 patients included in the Fontan cohort for a total of 204 patients. The median social deprivation index score was 34 (interquartile range 16–59) in the Glenn cohort (Figure 1a) and 33.5 (interquartile range of 15–60.5) in the Fontan cohort (Figure 1b) which is lower than the reported national median score of 47 (21, 72) (p-value < 0.001) and higher than the reported Wisconsin median score of 20.5 (11.0, 29.5) (p-value < 0.001). 19 The majority of patients were white (76% Glenn cohort, 80% Fontan cohort), not Hispanic or Latino (83% Glenn cohort, 85% Fontan cohort), and spoke English (92% for both cohorts). There was an equal distribution between commercial insurance and state insurance (Glenn: commercial 56%, state 44%; Fontan: commercial 52%, state 48%). In both cohorts, the most common CHD diagnosis was hypoplastic left heart syndrome. A minority of patients were premature or had documented heterotaxy syndrome. All demographics are listed in Table 1.
Distribution of social deprivation index (SDI) scores in Glenn and Fontan cohorts. ( a ) Glenn cohort scatter plot showing SDI scores for all patients in the Glenn cohort. Bars indicate median and interquartile range. Median SDI score is 34 (16, 59). ( b ) Fontan cohort scatter plot showing SDI scores for all patients in the Fontan cohort. Bars indicate median and interquartile range. Median SDI score is 33.50 (15.00, 60.50).

Glenn and Fontan cohort demographics

Data were presented as median (IQR) or n (%). SDI = Social Deprivation Index; HLHS = hypoplastic left heart syndrome; DILV = double inlet left ventricle; TA = tricuspid atresia; CAVC = complete atrioventricular canal; PA + IVS = pulmonary atresia with intact ventricular septum.
Glenn outcomes
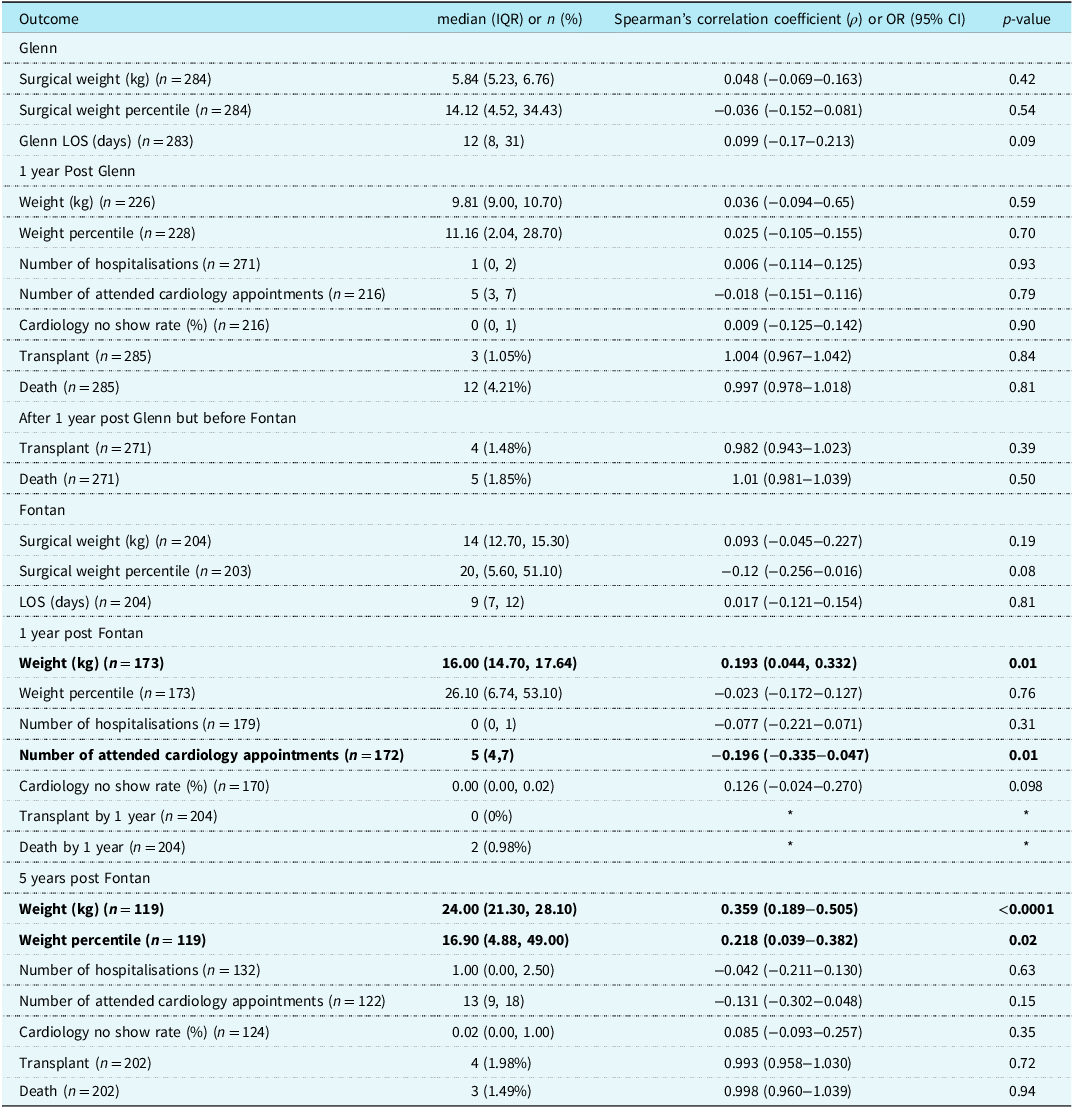
Primary outcome of growth was not associated with social deprivation index at the time of Glenn palliation (weight: p-value = 0.42, weight percentile: p-value = 0.54) or one year after Glenn (weight: p-value = 0.77, weight percentile: p-value = 0.70). There were no statistically significant secondary health outcomes including no increased risk of mortality (p-value = 0.81) or transplant (p-value = 0.84). Social deprivation index score was not associated with health care utilisation outcomes (number of attended cardiology appointments: p-value = 0.79, cardiology no-show rate: p-value = 0.89) (Table 2).
Glenn cohort (n = 285) and Fontan cohort (n = 204) outcomes

*Statistical analysis was not performed due to small sample size.
Fontan outcomes
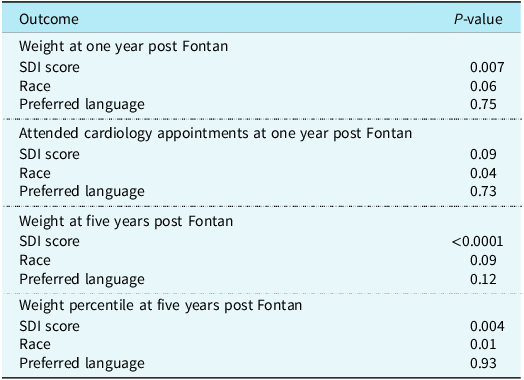
In the Fontan cohort, higher social deprivation index score (i.e. higher deprivation) was associated with higher weight at 1 year after Fontan (ρ = 0.19, 95% confidence interval 0.04–0.33, p-value = 0.01) (Figure 2a). Similarly, at 5 years after Fontan, higher social deprivation index score was significantly associated with higher weight (ρ = 0.36, 95% confidence interval 0.19–0.50, p-value < 0.01) and weight percentile (ρ = 0.22, 95% confidence interval 0.04–0.38, p-value = 0.02) (Figures 2b and 2c). Higher social deprivation index score was associated with fewer number of attended cardiology appointments at one year after Fontan (ρ = −0.20, 95% confidence interval −0.33–−0.05, p-value = 0.01). The remainder of the outcomes was not found to be statistically significant (Table 2). To further test the association between social deprivation index and significant associations identified with univariate analysis, we performed a multivariable analysis adjusting for race and preferred language. In our multivariable analysis, social deprivation index remained statistically significant for weight at one year after Fontan (p-value = 0.007) and weight and weight percentile at 5 years after Fontan (p-values < 0.0001 and p-value = 0.04, respectively). The number of attended cardiology appointments at one year after Fontan was no longer significant (p-value = 0.09) (Table 3).
Relationship between social deprivation index (SDI) scores and weight and weight and weight percentiles after Fontan palliation. ( a ) Scatter plot showing weight (kg) and SDI scores 1 year after Fontan (n = 173). Higher SDI scores were associated with higher weights at 1 year after Fontan (p-value = 0.01, Spearman’s correlation coefficient (ρ) = 0.19). Median weight was 16 kg (14.70, 17.64). ( b ) Scatter plot showing weight (kg) and SDI scores 5 years after Fontan (n = 119). Higher SDI scores were associated with higher weights at 5 years after Fontan (p-value < 0.01, Spearman’s correlation coefficient (ρ) = 0.36). Median weight was 24 kg (21.30, 28.10). ( c ) Scatter plot showing weight percentiles and SDI scores 5 years after Fontan (n = 119). Higher SDI scores were associated with higher weight percentiles at 5 years after Fontan (p-value = 0.02, Spearman’s correlation coefficient (ρ) = 0.22). Median weight percentile was 16.90 (4.88, 49.00).

Multivariable analysis of Fontan outcomes

Discussion
Building on previous studies that investigated the relationship between socioeconomic status and Norwood outcomes, to our knowledge, this is the first study to use a community-based deprivation index to investigate short- and medium-term outcomes after Glenn and Fontan palliations. We found a significant association between higher social deprivation index scores (i.e. higher deprivation) and higher weight one year after Fontan, and higher weight and weight percentile five years after Fontan.
The clinical implication of our findings is difficult to determine as these data can only determine association and not causation between social deprivation index scores and outcomes and because overall weight percentiles for age remained within the normal range. Thus, we cannot unequivocally determine if higher weight and weight percentile are a positive, negative, or neutral clinical difference. Similar to our findings, Hapuoja et al, found that patients with CHD and lower socioeconomic status had a higher BMI and weight at 10 years of age, with a linear increase over time, however, still within the normal range of z-scores. Reference Hapuoja, Kretschmar, Rousson, Dave, Naef and Latal20 Although Glenn and Fontan physiology is typically thought to be associated with lower growth parameters, a study that included 108 Fontan patients between 6 and 19 years of age found that 16% of patients were overweight or obese at the most recent follow-up. Reference Pinto, Marino and Wernovsky21 Our age range of patients for follow-up was younger than that of this study (median age at Fontan of our population was 3.5 years with one and five-year follow-up intervals in our study). Further analysis on longer-term weight points would be interesting to determine if the trend in higher weights associated with increasing social deprivation index scores found in our study would continue to be overweight or remain within the normal range. Another single-institution study found that Fontan patients with a lower childhood opportunity index had a lower exercise capacity and a higher rate of catheter-based intervention. Reference Karolcik, Wang and Ragavan18 While a direct line cannot be made between higher weight and cardiovascular health in the setting of lower socioeconomic status, it would be another interesting point of investigation.
We found that higher social deprivation index scores were associated with fewer number of attended cardiology appointments one year after Fontan, but this was no longer significant after multivariate analysis with race and preferred language. However, race was significantly associated with the number of attended cardiology appointments, indicating a potential multi-factorial socioeconomic influence in healthcare utilisation. A recent study by Zaidi et al found that a lower child opportunity index (which includes race) was associated with higher odds of a gap in care (≥3 years) in patients with CHD. Reference Zaidi, Alberts and Chowdhury22 It has also been demonstrated that in adults with CHD, a lapse in medical care is associated with adverse outcomes including the development of secondary cardiac abnormalities and the need for urgent intervention. Reference Yeung, Kay, Roosevelt, Brandon and Yetman23 While we did not specifically look at time intervals between attended cardiology appointments, the single ventricle population is one of the most complex populations in CHD, and scheduled office visits as recommended by the patients’ cardiologists are important for prevention and identification of single ventricle complications. Thus, there may be an association between higher social deprivation index score in childhood and longer-term health outcomes. Further research into socioeconomic factors, rates of missed cardiology appointments, and the presence of associated adverse events may provide a target for improving outcomes in our vulnerable populations.
Despite the univariate association of social deprivation index with fewer attended outpatient cardiology appointments, we did not identify an increase in hospitalisations after Glenn or Fontan. However, our data may be limited as we did not include hospitalisations that were in a hospital outside of our electronic medical record. Similar findings have been reported in medically complex patients, where an increase in area-level deprivation was associated with an increase in missed complex care clinic visits but not an increase in the number of emergency department visits or hospitalisations. Reference Thomson, Butts and Camara24 Although we cannot confirm this based on our study, this may reflect that those with greater area-level deprivation are less likely to seek medical care or less likely to be admitted.
There was no association between death or transplant and social deprivation index score after Glenn or Fontan during the short- and medium-term follow-up duration of our study. It is important to note, however, that there were only 22 (7.5%) total deaths and 11 (3.7%) total transplants in our study population. Interestingly, de Loziga et al found an increased odds of mortality and decreased transplant-free survival one year after Norwood in patients with lower socioeconomic status. Reference de Loizaga, Schneider and Beck16 Bucholz et al, using the Single Ventricle Reconstruction trial data, found that lower socioeconomic status was significantly associated with lower transplant-free survival within the first 6 years after Norwood, however, after adjusting for birth and Norwood characteristics the association remained significant for 1 year morality (p = 0.018) but was attenuated for the remaining 6 year period (p = 0.055). Similarly, they found no difference in mortality among socioeconomic status tertiles when they analysed patients who survived to 1 year post-Norwood without transplant. Reference Bucholz, Sleeper and Newburger25 Collectively, these data suggest that socioeconomic status may have the most significant effect on transplant-free survival within the first year. As our study did not account for pre-Glenn palliation clinical course, it is possible that socioeconomic status has a greater impact during the interstage period, and these patients may have a lower survival to Glenn or Fontan palliation.
It is important to note that our study population had a median social deprivation index score that was lower than the national median score. It is possible that more significant associations with social deprivation index score and short and medium-term outcomes following Glenn and Fontan palliations would be found in other study populations with higher median social deprivation index scores across the country. Our study population did, however, have a median social deprivation index score that was higher than the state of Wisconsin, indicating more community-level deprivation in our population than may be found in other areas within the state. This collectively highlights the importance of multi-centre collaboration to tease out how community-level deprivation affects the single ventricle population and if it may be a useful screening tool to ensure proper resources are provided to families.
As a single institution, retrospective study, there are inherent limitations including risk of type 1 error, inability to control for all confounding factors, missing follow-up data, and selection bias, limiting the generalizability of these results. Importantly, this study can only determine associations between social deprivation index scores and outcomes, not causation, which must be carefully taken into consideration when clinically interpreting these results. We calculated all social deprivation index scores using the 2015–2019 American census survey data and, therefore, cannot account for changes within the community for patients whose surgeries occurred prior to 2015 or after 2019. In addition, all social deprivation index scores were calculated using the last documented zip code in the chart under the assumption that has been demonstrated in studies, that if a patient were to move, it would likely be within the same deprivation level. Reference Knighton26 Lastly, as the social deprivation index score is a community-based metric being applied to individuals, it cannot account for outliers within a community, such as a wealthy family living in a more deprived neighbourhood.
Conclusion
Higher social deprivation index scores (i.e. higher community-level deprivation) were associated with higher weight and weight percentile, still within normal range, after Fontan palliation. It is possible that longer-term outcomes may reveal an unhealthy weight trend towards obesity. Multi-centre collaboration to assess longer-term outcomes should help provide insight into clinical significance.
Acknowledgements
This project was supported by the National Centre for Advancing Translational Sciences, National Institutions of Health, through Grant Number UL1TR001436. Its contents are solely the responsibility of the authors and do not necessarily represent the official views of the NIH.
Financial support
This research received no specific grant from any funding agency, commercial, or not-for-profit sectors.
Competing interests
None.
Ethical standard
This study was approved by the Medical College of Wisconsin Institutional Review Board (#13874) with waiver of informed consent.