In patients with single ventricle physiology, the presence and preservation of normal cardiac function is important for long-term survival. After the Fontan procedure, diastolic dysfunction has been shown to be more prevalent than systolic dysfunction.Reference Milanesi, Stellin and Colan1 Although various echocardiographic parameters are used to evaluate diastolic ventricular function, there is a paucity of data comparing these to invasive pressure measurements in infants with single ventricle physiology.
Studies in adults with two-ventricle hearts have demonstrated that several echocardiographic Doppler indices correlate with invasively measured left ventricular end-diastolic pressure.Reference Ommen, Nishimura and Appleton2–Reference Rossvoll and Hatle7 Studies comparing echocardiographic measures of diastolic function to invasive measurements in paediatric populations with biventricular circulation have shown mixed results.Reference Savage, Hlavacek, Ringewald and Shirali8–Reference Border, Michelfelder and Glascock10 In addition, concerns have been raised regarding the reproducibility of many of these measurements in children.Reference Colan, Shirali and Margossian11 Three studies have been performed in the single ventricle population evaluating the relationship of echocardiographic measures of diastolic function to invasive measures of ventricular function at cardiac catheterisation. While these studies demonstrated that the ratio of early to late diastolic pulsed Doppler atrioventricular valve inflow velocity, ratio of early filling velocity to early Tissue Doppler velocity, and ratio of early filling velocity to global longitudinal early diastolic strain rate correlate well with invasive measures of diastolic function (Tau and/or ventricular end-diastolic pressure), these studies are limited by overall sample size (13, 27, and 32 patients each) and the diverse group of patients who were studied at various stages of palliation and ages.Reference Menon, Gray and Tani12–Reference Husain, Gokhale, Nicholson, Cheatham, Holzer and Cua14
The Pediatric Heart Network Infant Single Ventricle trial was a randomised, double-blind, placebo-controlled trial designed to determine if enalapril improves somatic growth in infants with single ventricle physiology.Reference Hsu, Mital and Ravishankar15 The patient cohort from this multi-institutional study provides a unique opportunity to compare echocardiographic estimates of diastolic ventricular function to invasive measurements prior to superior cavopulmonary anastomosis. The purpose of the present study was to identify whether echocardiographic measurements of diastolic function correlate with ventricular end-diastolic pressure in infants with single ventricle physiology prior to superior cavopulmonary anastomosis.
Materials and methods
This is a retrospective study using the database from the Pediatric Heart Network Infant Single Ventricle trial which enrolled 230 patients aged 1 week to 45 days with single ventricle physiology and planned superior cavopulmonary anastomosis palliation. Patients were enrolled from August 2003 through May 2007. Details of the trial design and study population have previously been described.Reference Hsu, Mital and Ravishankar15,Reference Hsu, Zak and Mahony16 Standardised echocardiograms were performed at baseline (study entry, age less than 6 weeks), pre-superior cavopulmonary anastomosis, and 14 months of age and interpreted at a central core laboratory. Only the echocardiograms from the pre-superior cavopulmonary anastomosis time period were included in the analysis. Cardiac catheterisations prior to superior cavopulmonary anastomosis were not required as part of the trial protocol, but were performed in most patients. From the original trial cohort, we excluded patients without a pre-superior cavopulmonary anastomosis catheterisation (n = 57) and patients with mixed ventricular type (neither classifiable as right or left ventricular type, n = 17). Mixed ventricular type was excluded to have a more homogenous single ventricle cohort, since we hypothesised that the type of ventricular morphology may impact echo measurements and therefore the correlation of echocardiographic measurements with end-diastolic pressure. One outlier with a ventricular end-diastolic pressure of 32 was additionally excluded from the analysis as this was suspected to be a spurious value. Therefore, a total of 155 patients were included in the analysis.
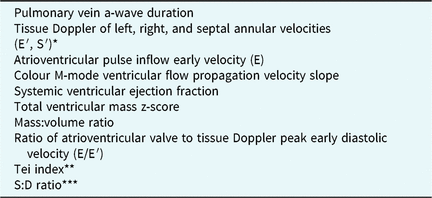
Table 1 lists the echocardiographic measures included in the analysis. In order to minimise bias and interobserver error, a single observer at a central core echocardiography laboratory performed all echo measurements. Since 47% of the 173 patients with echo and catheterisation data (n = 81) had a summation wave (fusion of early and atrial atrioventricular valve inflow and/or tissue Doppler wave), echo measurements involving pulse inflow Doppler and tissue Doppler atrial velocities were not included in the analysis. To calculate ventricular volumes, mass, and ejection fraction, apical and parasternal short-axis views were analysed using custom software (EchoTrace, Marcus Laboratories, Boston, Massachusetts, United States of America). Using the apical (ventricular long-axis) and parasternal short-axis views, the endocardial border was traced at end-diastole and end-systole. The epicardial border was traced at end-diastole in both planes. End-diastolic volume, as well as end-systolic volume, and ventricular mass were calculated using a biplane-modified Simpson’s rule. The ejection fraction was derived from these values. Ventricular mass was calculated as myocardial end-diastolic volume (epicardial volume−endocardial volume) × myocardial density (1.05 g/ml). This methodology, as well as interobserver and intraobserver variability of these methods in the single ventricle population, has been described in a previous publication by the Pediatric Heart Network.Reference Margossian, Schwartz and Prakash17 Two additional echocardiographic variables were derived from the existing tissue Doppler tracing measurements: the Tei indexReference Tei, Dujardin, Hodge, Kyle, Tajik and Seward18 and the systolic:diastolic duration ratio.Reference Cui, Roberson, Chen, Madronero and Cuneo19,Reference Friedberg and Silverman20 For the systolic:diastolic duration ratio, the isovolumic phases were excluded from the systolic and diastolic duration time measurement since some of the patients had right ventricle to pulmonary artery (Sano) shunts that lack true isovolumic phases. The systolic duration time was measured from the start to the end of the peak systolic annular velocity wave, and the diastolic duration time was measured from the start of the peak early diastolic annular velocity to the end of the peak late diastolic annular velocity. The systolic:diastolic duration ratio was then calculated as the ratio of the systolic and diastolic duration times (systolic duration time/diastolic duration time). If multiple site tissue Doppler tracing measurements were present for an individual subject (e.g. more than one lateral wall and/or septal wall), all available Tei and systolic:diastolic ratio measurements from the septum and lateral walls were averaged to create a single measurement for each subject. The Tei index and systolic:diastolic ratio measurements were also calculated using only lateral values of the dominant ventricle in a separate analysis. Otherwise, the tissue Doppler measurement from the single available site was used.
Echocardiographic variables

* E′ = early diastolic annular velocity; S′ = peak systolic annular velocity.
** Tei index = (isovolumic contraction time + isovolumic relaxation time)/ejection time.Reference Hsu, Zak and Mahony16
*** S:D = systolic duration time to diastolic duration time.Reference Margossian, Schwartz and Prakash17,Reference Tei, Dujardin, Hodge, Kyle, Tajik and Seward18
Statistical analysis
Data are described as frequencies, medians with 25th and 75th percentile values, and means with standard deviations as appropriate. Correlation analysis using Spearman’s rank correlation was performed between the echocardiographic variables and ventricular end-diastolic pressure at the pre-superior cavopulmonary anastomosis cardiac catheterisation. Correlation analysis was performed separately in patients with and without summation atrioventricular valve waves for peak early diastolic inflow or tissue velocity and the ratio of atrioventricular valve to tissue Doppler peak early diastolic velocity. In addition, linear regression analysis was performed testing the association of echo variables with end-diastolic pressure; non-linear fit was performed using generalised additive models. In an alternative analysis, the cohort was dichotomised based on ventricular end-diastolic pressure values: end-diastolic pressure ≥10 mmHg (elevated) versus the rest of the cohort (end-diastolic pressure < 10 mmHg; normal). A value of 10 mmHg or greater for an elevated end-diastolic pressure was chosen because this represented the upper quartile of end-diastolic pressure in this cohort. Logistic regression analysis was then performed testing the association of echocardiographic variables with an elevated end-diastolic pressure as the outcome variable of interest. Receiver operating characteristic analysis was done on those variables that showed a significant association with ventricular end-diastolic pressure.
To determine if dominant ventricular morphology impacted correlation of these echo variables with end-diastolic pressure, the patients were divided into two groups: systemic right versus systemic left ventricle and correlation between echocardiographic variables and end-diastolic pressure was compared between these two groups. Regression interaction testing was also performed to verify the impact of ventricular type on association between echocardiographic variables and end-diastolic pressure. Data analyses were performed using Statistical Analysis Software version 9.3 (SAS Institute Inc., Cary, North Carolina, United States of America). The plots are created using S-PLUS version 8.0 (Insightful Inc., Seattle, Washington, United States of America). A p-value less than 0.05 was considered statistically significant.
Results
As noted above, of the 230 enrolled patients in the trial, 156 patients met the inclusion criteria and an additional outlier suspected to have spurious catheter-based data was excluded, leaving a total of 155 patients in the analysis. Analysis of this group demonstrated that there was no significant correlation between end-diastolic pressure and any of the echocardiographic variables. As is common in clinical practice, many patients had different sedation types during the two procedures (catheterisation and echocardiogram) that could potentially alter loading conditions and myocardial function, thus impacting correlations. In order to infer whether loading conditions may differ due to different sedation types and the potential confounding effect of general anesthesia, we compared the ratio of systolic blood pressure recorded during the echo to that recorded during cath. The systolic and diastolic blood pressure ratio between the two measurements was higher in the patients with different sedation types during the two procedures (1.18 ± 0.27 and 1.37 ± 0.42, respectively), compared to those with similar sedation types (1.03 ± 0.23 and 1.17 ± 0.36) during the two procedures. Therefore, a separate analysis was performed on patients with similar sedation type during the two studies (either having general anesthesia for both studies or moderate sedation during both studies).
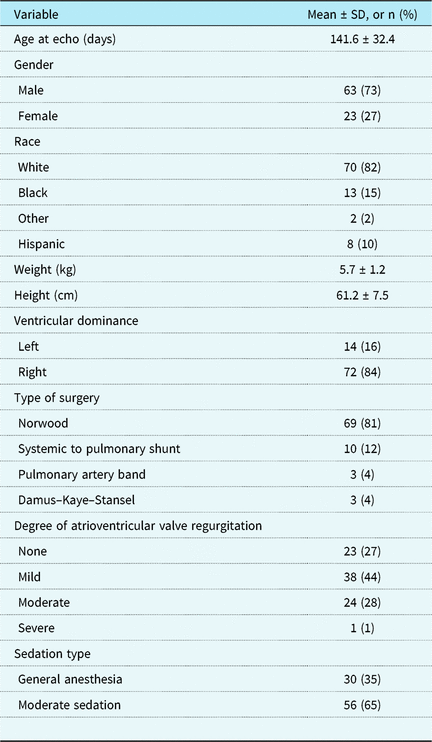
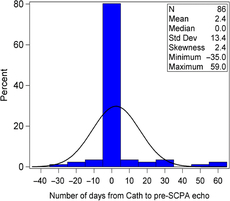
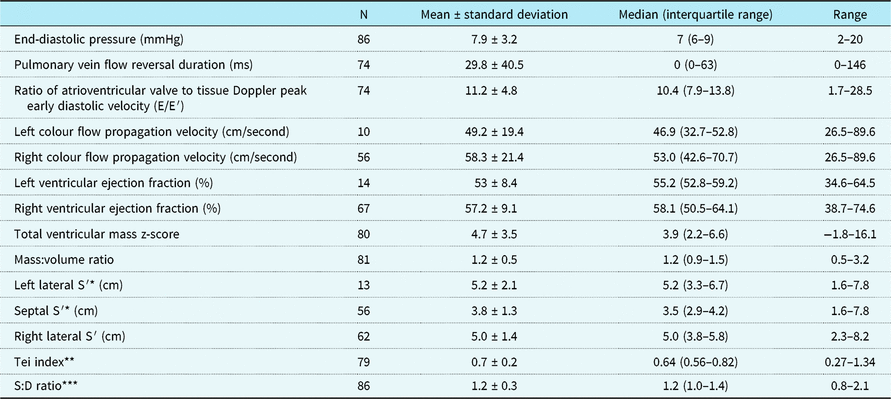
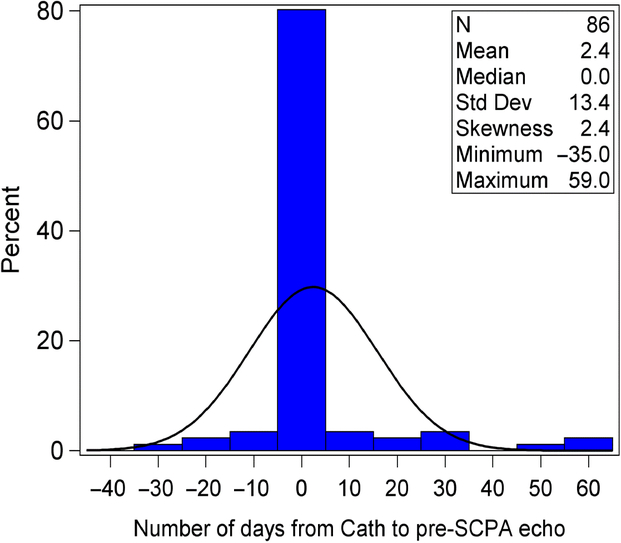
Eighty-six of the total 155 patients (66%) had the same sedation type for both the catheterisation and echocardiogram. Table 2 summarises baseline characteristics of the study population with similar sedation types. Mean age and weight at the time of echocardiogram were 141.6 ± 32.4 days and 5.7 ± 1.2 kg, respectively. Overall, 84% of the patients had right ventricular dominant morphology. Figure 1 shows the time between the echocardiogram and cardiac catheterisation. For most of these 155 patients (86%), the echocardiogram and catheterisation were performed within a 2-week period with 64% of the patients having the two studies on the same day. Echocardiographic and cardiac catheterisation data used in the analysis are summarised in Table 3. Of note, the early annular velocities mean and standard deviation values in the cohort are as follows: left 9.1 ± 3.1, septal 6.4 ± 2.6, and right 8.0 ± 2.7. Ventricular end-diastolic pressure ranged from 2 to 20 mmHg, with 76% of patients having an end-diastolic pressure less than 10 mmHg.
Study population characteristics at pre-superior cavopulmonary anastomosis echo

Days between echocardiogram and cardiac catheterization. This graph illustrates the distribution of the number of days between the echocardiogram and cardiac catheterization among subjects with similar sedation type. A negative value on the x-axis indicates that the catheterization occurred after the echo and a positive value indicates that the catheterization occurred before the echocardiogram. Most of the echocardiograms occurred on the same day (64%) with 86% of subjects having the two studies within a two week time period. Abbreviations: SCPA = superior cavopulmonary anastomosis.
Haemodynamic and echocardiographic variables for patients with similar sedation type

* S′ = peak systolic annular velocity.
** Tei index = (isovolumic contraction time + isovolumic relaxation time)/ejection time.Reference Hsu, Zak and Mahony16
*** S:D = systolic duration time to diastolic duration time.
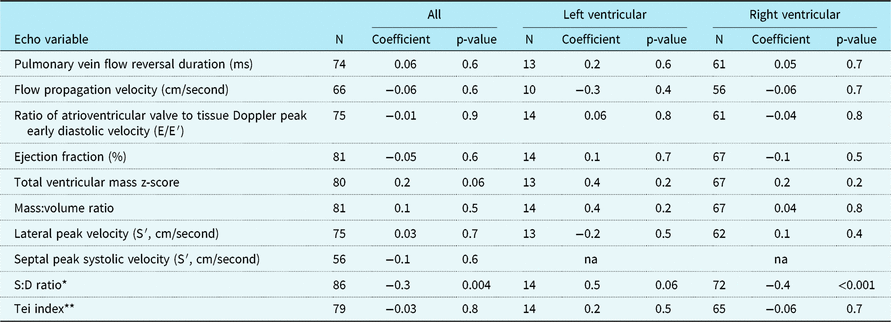
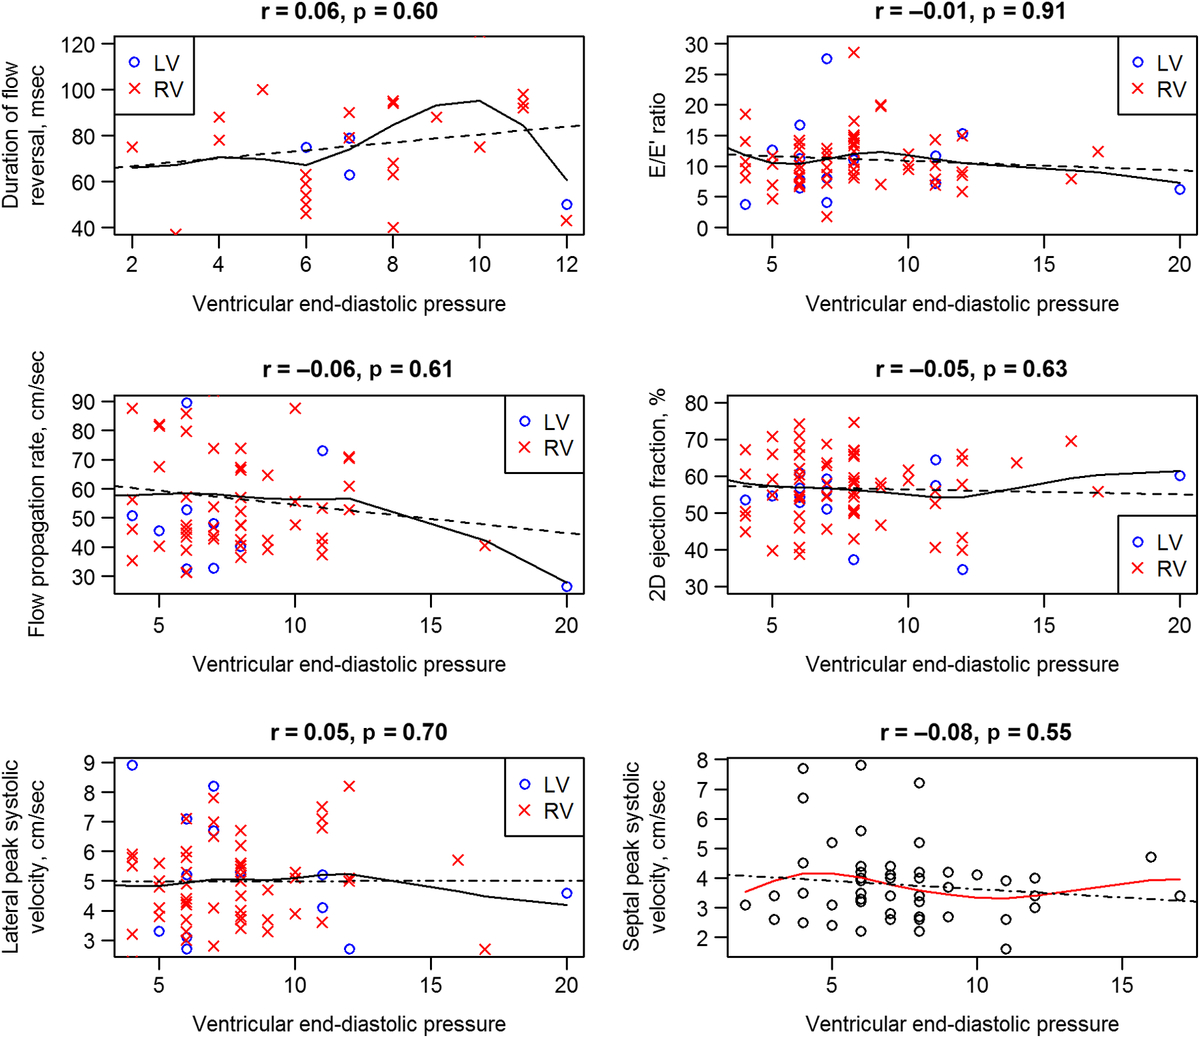
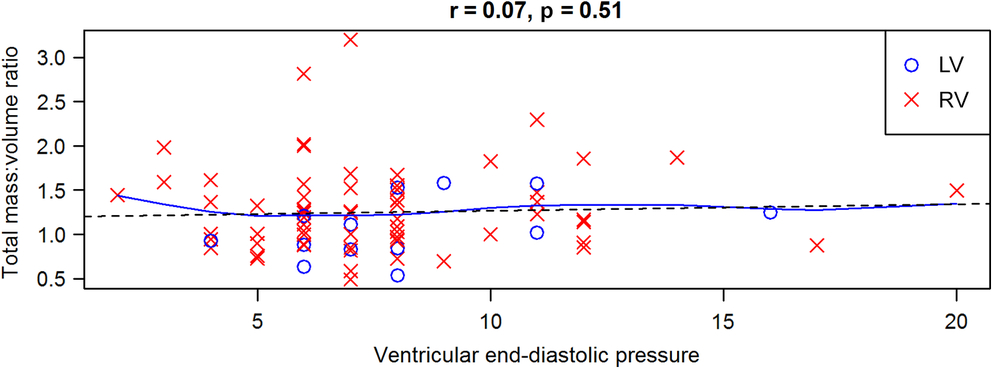
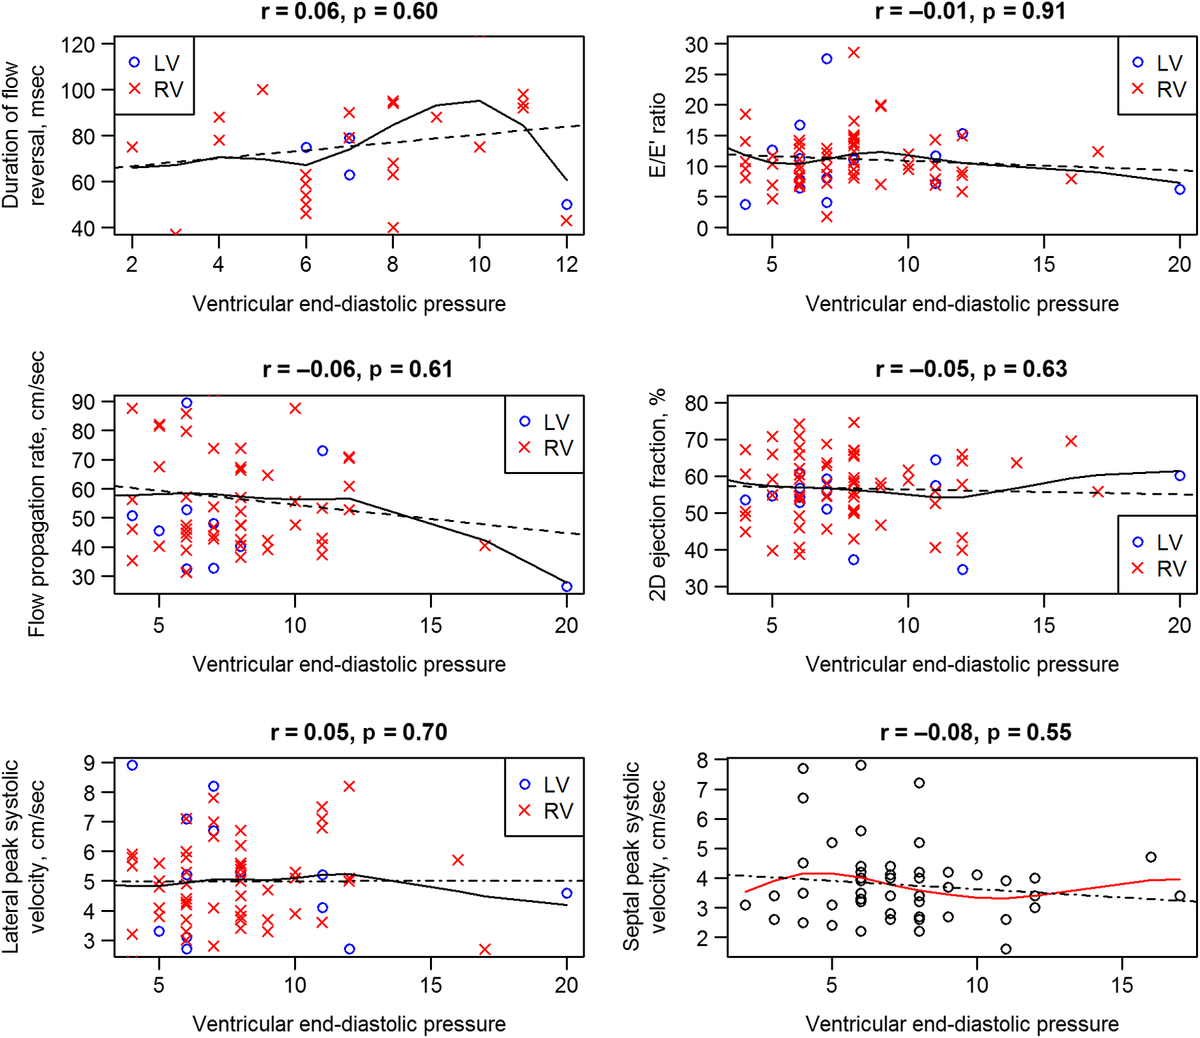
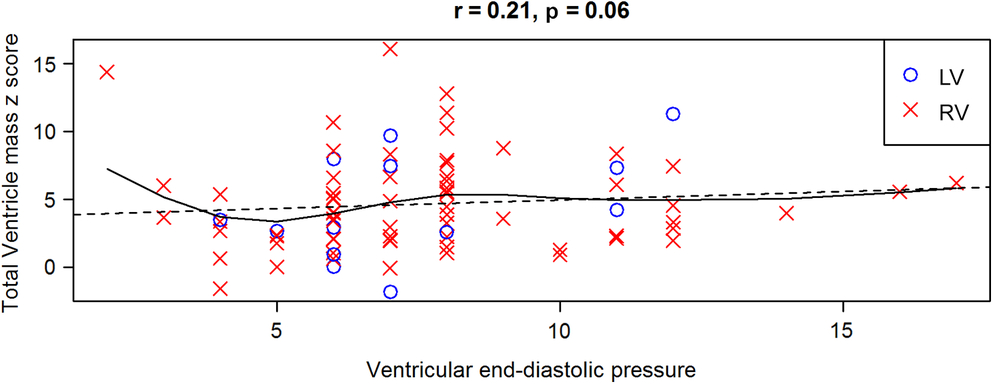
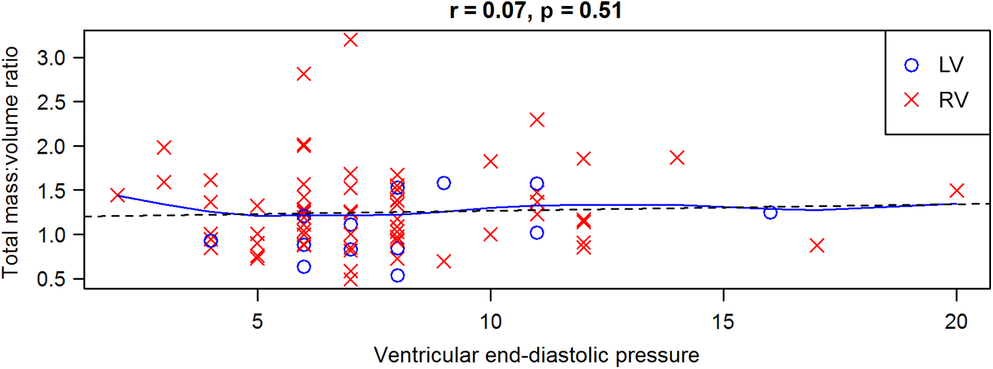
Table 4 summarises the results of the linear correlation analysis of echo parameters versus end-diastolic pressure for the patients with similar sedation type. Most of the echocardiographic variables did not have a statistically significant correlation with ventricular end-diastolic pressure except for systolic:diastolic duration ratio, which had a weak negative correlation with end-diastolic pressure. Duration of pulmonary vein flow reversal did not correlate with ventricular end-diastolic pressure, even when only those patients with a flow reversal duration greater than zero (n = 26) were included (r = 0.22, p = 0.06). In addition, the ratio of early atrioventricular valve inflow velocity to early diastolic annular velocity, peak systolic velocity by tissue Doppler, systemic flow propagation velocity, ventricular ejection fraction, mass:volume ratio, and ventricular mass z-score did not correlate significantly with ventricular end-diastolic pressure (Figs 2–4). Tei index did not correlate with end-diastolic pressure (Fig 5). Linear regression analysis did not show a significant association between any of the echocardiographic variables and end-diastolic pressure. Interaction regression testing of ventricular type on the association between echocardiographic variables and end-diastolic pressure was not significant for any of the echocardiographic variables.
Correlation between end-diastolic pressure and echo variables in patients with similar sedation type

* S:D = systolic duration time to diastolic duration time.Reference Margossian, Schwartz and Prakash17,Reference Tei, Dujardin, Hodge, Kyle, Tajik and Seward18
** Tei index = (isovolumic contraction time + isovolumic relaxation time)/ejection time.Reference Hsu, Zak and Mahony16
These figures illustrate the relationship between each echocardiographic measure (labeled in each graph on the y-axis) and the catheter-derived ventricular end-diastolic pressure (on the x-axis). The blue open circles represent those subjects with left ventricular type morphology (LV), and the subjects denoted by a red “X” represent those with a right ventricular type morphology (RV). The solid line represents the linear fit, and dashed line represents the non-parametric fit using the generalized additive model. None of these echocardiographic variables have significant correlation with ventricular end-diastolic pressure.
This figure illustrates the relationship between total ventricular mass z-score on the y-axis and catheter-derived end-diastolic pressure on the x-axis. The blue open circles represent those subjects with left ventricular type morphology (LV), and the subjects denoted by a red “X” represent those with a right ventricular type morphology (RV). The solid line represents the linear fit, and the dashed line represents the non-parametric fit using the generalized additive model. Notice that total ventricular mass z-score does not have a significant correlation with end-diastolic pressure.
This figure illustrates the relationship between total mass to volume ratio on the y-axis and catheter-derived end-diastolic pressure on the x-axis. The blue open circles represent those subjects with left ventricular type morphology (LV) and the subjects denoted by a red “X” represent those with a right ventricular type morphology (RV). The solid line represents the linear fit, and the dashed line represents the non-parametric fit using the generalized additive model. Notice that total mass to volume z-score does not have a significant correlation with end-diastolic pressure.
This figure illustrates the relationship between Tei index* on the y-axis and catheter-derived end-diastolic pressure on the x-axis. The blue open circles represent those subjects with left ventricular type morphology (LV), and the subjects denoted by a red “X” represent those with a right ventricular type morphology (RV). The solid line represents the linear fit, and the dashed line represents the non-parametric fit using the generalized additive model. Notice that Tei index does not have a significant correlation with end-diastolic pressure.
* Tei index = (isovolumic contraction time + isovolumic relaxation time)/ejection time [16].
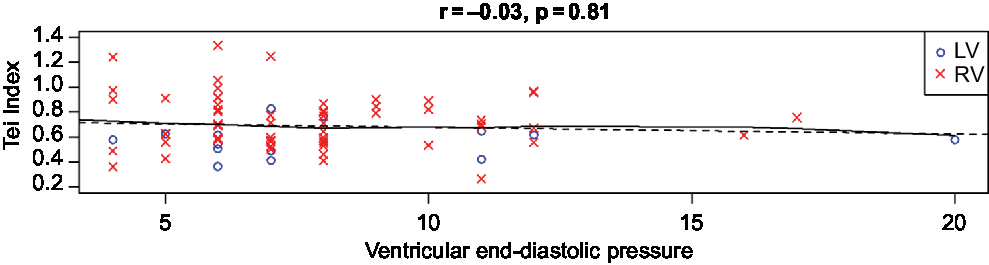
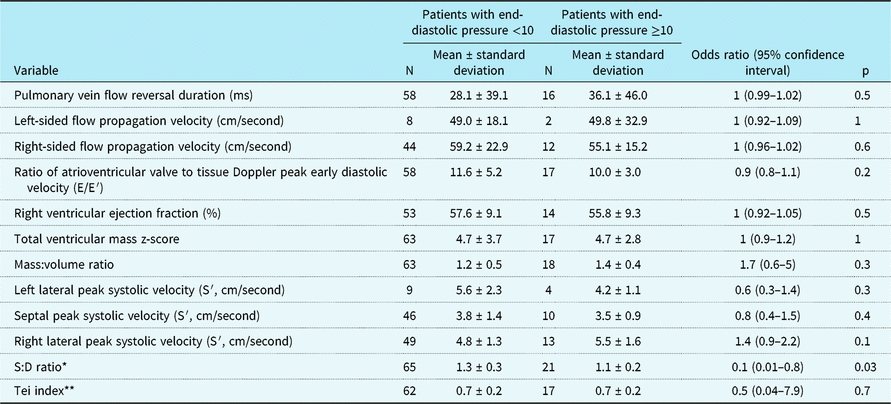
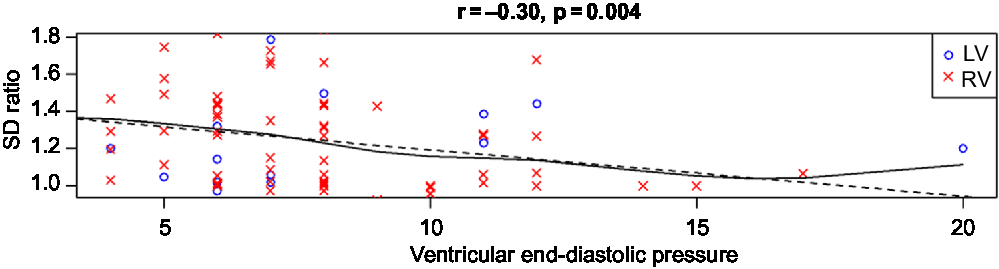
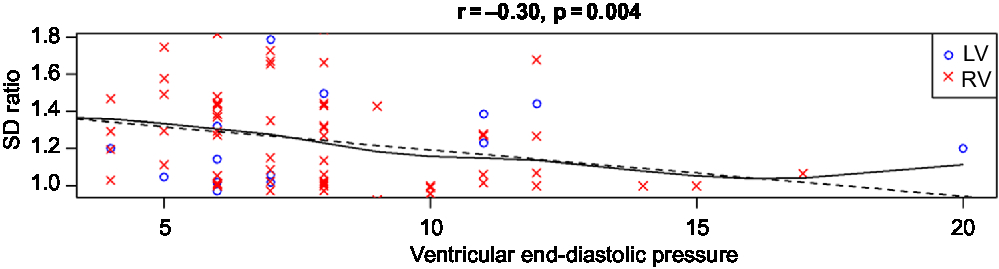
Table 5 describes results from logistic regression analysis testing the association of echocardiographic parameters with elevated end-diastolic pressure in the cohort with the same sedation type during the two studies. There was no significant association of any of the echo measures with an elevated end-diastolic pressure except for systolic:diastolic duration ratio. Systolic:diastolic duration ratio was found to have a weak but statistically significant negative association with end-diastolic pressure (Fig 6 and Table 5). This relationship held true even when controlling for heart rate using a multivariable regression model (p = 0.02). When only the lateral velocity measurements were included, only patients with right dominant ventricular type had statistically significant negative correlation with end-diastolic pressure (r = −0.32, p = 0.01). Left ventricular dominant patients had no significant correlation between systolic:diastolic duration ratio and end-diastolic pressure.
Comparison of echocardiographic variables between patients by end-diastolic pressure severity

* S:D = systolic duration time to diastolic duration time.Reference Margossian, Schwartz and Prakash17,Reference Tei, Dujardin, Hodge, Kyle, Tajik and Seward18
** Tei index = (isovolumic contraction time + isovolumic relaxation time)/ejection time.Reference Hsu, Zak and Mahony16
This figure illustrates the relationship between S:D ratio** on the y-axis and catheter-derived end-diastolic pressure on the x-axis. The blue open circles represent those subjects with left ventricular type morphology (LV), and the subjects denoted by a red “X” represent those with a right ventricular type morphology (RV). The solid line represents the linear fit, and the dashed line represents the non-parametric fit using the generalized additive model. Notice that S:D ratio has a weak correlation with ventricular end-diastolic pressure.
** S:D = systolic duration time to diastolic duration time. *LV = left ventricular type. **RV = right ventricular type.
Discussion
Based on our findings, most conventional 2D, pulsed wave, and tissue Doppler echocardiographic measures of diastolic ventricular function do not correlate with ventricular end-diastolic pressure at cardiac catheterisation in infants with single ventricle physiology prior to superior cavopulmonary anastomosis. Interestingly, systolic:diastolic duration ratio exhibited a weak negative correlation with end-diastolic pressure due to an increased duration of diastole in those patients with elevated end-diastolic pressure. This relationship held true even when we controlled for variability in heart rate. This relationship is the opposite of what has been demonstrated in other paediatric studies, which have shown that the duration of isovolumic relaxation and of ventricular filling would be expected to shorten with increased filling pressures.Reference Friedberg and Silverman20–Reference Friedberg and Silverman22 Possible explanations for the discrepancy between our findings and prior work include heterogeneity in ventricular morphology in our cohort, loading conditions and valve function, different methodology (use of tissue Doppler measurements, averaging of values, and exclusion of isovolumic times), and ventricular dyssynchrony. Single ventricles commonly exhibit dyssynchrony,Reference Moiduddin, Texter and Zaidi23 which, in turn, is associated with elevated end-diastolic pressure.Reference Stiver, Gokhale and Husain24 Ventricular dyssynchrony may have more of an effect on systolic time than on diastolic time, which may lead to a decrease in the systolic:diastolic duration ratio. As shown in Figure 5, the scatter around the regression line is relatively wide, the correlation is relatively weak, and four outliers with high end-diastolic pressure may have influenced results. These factors make it difficult to know if this finding is informative or spurious, but it warrants further evaluation.
These findings have important clinical implications. Single ventricle patients who manifest pre-Fontan diastolic dysfunction, as determined by invasive measures such as elevated Tau and end-diastolic pressure, have worse Fontan outcomes.Reference Williams, Sleeper and Colan25,Reference Border, Syed and Michelfelder26 Tau and end-diastolic pressure assess different aspects of diastole: Tau measures the speed of isovolumic pressure fall in the ventricle, reflecting the combined impact of impaired myocardial relaxation, elastic recoil, and synchrony of relaxation, while end-diastolic pressure reflects end-diastolic compliance and is influenced by volume status. If diastolic dysfunction predicts a worse outcome in the pre-superior cavopulmonary anastomosis population, then it is important for the clinical care of these patients to have a reproducible, easily calculated, non-invasive method of assessing diastolic dysfunction. Disappointingly, in this cohort, none of the standard echo measures of diastolic function correlated well enough with end-diastolic pressure to fulfill this role. Other studies in children with single ventricleReference Husain, Gokhale, Nicholson, Cheatham, Holzer and Cua14,Reference Friedberg and Silverman20 as well as other paediatric populationsReference Savage, Hlavacek, Ringewald and Shirali8,Reference Dragulescu, Mertens and Friedberg27 have also shown poor correlations between tissue Doppler echo measurements and catheter-derived ventricular end-diastolic pressure, in contrast to what the adult literature demonstrates.Reference Ommen, Nishimura and Appleton2,Reference Arteaga, Hreybe, Patel and Landolfo3 This may be because children do not commonly demonstrate impaired relaxation.Reference Dragulescu, Mertens and Friedberg27 It is possible that ventricular end-diastolic pressure is not a robust measure of diastolic function in pre-superior cavopulmonary anastomosis volume-loaded physiology, as volume-loaded ventricles are less stiff and more compliant than normal or pressure-loaded hearts.Reference Janicki and Brower28 Furthermore, the pre-superior cavopulmonary anastomosis population has an altered atrial and venous reservoir because the systemic and pulmonary venous systems drain into the systemic ventricle. The diastolic function indices that were evaluated in this study were originally derived from patients with a relatively small venous reservoir (pulmonary venous drainage only). It is unsurprising that these echo indices may not reflect end-diastolic compliance in single ventricle anatomy where there are significant alterations in the venous reservoir and, therefore, atrioventricular interaction. Other potential explanations for the lack of correlations include the use of fluid-filled catheters, which have limited fidelity when compared to conductance catheters, and the known volume dependence of ventricular end-diastolic pressure. Additional studies involving the comparison of echo measurements of diastolic function with alternative invasive measurements of diastolic function shown to correlate with outcomes, such as Tau or maximal rate of rise of ventricular pressure, would be useful. As these measurements and the use of conductance catheters were not standard of care in paediatrics at the time of this study, and the risks could impact study recruitment to answer the primary question of the trial, these measurements were not performed as a part of this study and could therefore not be a part of our ancillary analysis.
Three smaller studies of single ventricle patients have demonstrated good correlation between some tissue Doppler indices of ventricular function and invasive measurements of filling pressures.Reference Menon, Gray and Tani12,Reference Chowdhury, Butts and Buckley13,Reference Learn, Yates, Nicholson, Milton, Lloyd and Cua29 In comparison to these prior studies, strengths of our study include the larger, more homogenous patient population and the fact that the measurements were blinded. Our cohort was studied prior to the superior cavopulmonary anastomosis and these other studies incorporated patients at various stages of palliation (pre-superior cavopulmonary anastomosis, post-superior cavopulmonary anastomosis, and Fontan).
Approximately half of the patients in the study had a summation wave (fusion of the early and late diastolic inflow pulse wave Doppler), likely due to the higher heart rates typical for infants. As a result, Doppler measurement of the atrial contribution to diastole could not be evaluated. This highlights the practical limitations of using these echo variables to evaluate diastolic dysfunction in this age group.
Limitations
The echocardiograms and cardiac catheterisations in which the data were compared were not simultaneous. In 14% of the patients, 14–60 days elapsed between the echocardiograms and cardiac catheterisation. Therefore, the observed lack of association between echo variables and catheter-derived ventricular end-diastolic pressure may be related to having two points of comparison under differing conditions, although there were unlikely to be significant changes in myocardial properties in the relatively short interval between the studies.
While our study incorporates patients with a range of ventricular end-diastolic pressure that was normally distributed, there were few patients with clinically significant elevations of ventricular end-diastolic pressure. This may have decreased the power of our study to detect important correlations.
Our study included a population of single ventricle infants with heterogenous anatomical types, with only 13 left ventricular dominant patients and 62 right ventricular dominant patients. Analysis incorporating only lateral annular velocities was limited by power.
Conclusions
Conventional two-dimensional, pulsed wave and tissue Doppler echocardiographic measures of ventricular function do not correlate with ventricular end-diastolic pressure at cardiac catheterisation in infants with single ventricle physiology prior to superior cavopulmonary anastomosis. These limitations should be factored into the interpretation of quantitative echocardiographic data in this patient population.
Acknowledgements
None.
Financial Support
The pediatric Heart Network Infant Single ventricle trial was supported by U01 grants from the NIH National Heart, Lung, and Blood Institute (HL068269, HL068270, HL068281, HL068285, HL068292, HL068290, HL068288, HL085057) and the FDA Office of Orphan Products Development.
Conflicts of Interest
None.
Ethical Standards
The trial involved human subjects. The trial protocal was approved by an independent protocol review committee, a data and safety monitoring board, and by the institutional review board at each clinical center and at the data coordinating center. The trial was registered at http://www.cinicaltrials.gov/ct2/show/NCT00113087.