Introduction
Current mental illness classification systems, such as the Diagnostic and Statistical Manual of Mental Disorders (DSM-IV; APA, 2000), take an atheoretical approach to the etiology and pathophysiology of mental illness by relying upon phenomenological descriptions of symptom clusters and clinical course as diagnostic criteria (Hyman, Reference Hyman2007). One issue stemming from these nosological systems is that they identify categorical illnesses that are inherently heterogeneous. As an illustration, the DSM-IV requires that five of nine symptoms (with at least one symptom being depressed mood or anhedonia) must be endorsed to meet criteria for major depressive disorder (MDD); this produces 105 unique symptom combinations. Given that distinct disorder components are likely to be associated with different pathophysiologies, it is not surprising that this heterogeneity has hindered our ability to identify genetic, neurobiological and environmental factors contributing to depression (Hasler et al. Reference Hasler, Drevets, Manji and Charney2004). To overcome these challenges, researchers have suggested focusing on narrowly defined and quantifiable phenotypes, which arguably represent a more direct expression of biological and environmental influences than the overall disorder (e.g. Meyer-Lindenberg & Weinberger, Reference Meyer-Lindenberg and Weinberger2006).
Anhedonia, the loss of pleasure or lack of reactivity to pleasurable stimuli, is a promising depressive phenotype; it is a cardinal symptom of depression that has been associated with greater depression severity, poor treatment response, and reduced activity in reward-related brain regions (Kasch et al. Reference Kasch, Rottenberg, Arnow and Gotlib2002; Hasler et al. Reference Hasler, Drevets, Manji and Charney2004; Keedwell et al. Reference Keedwell, Andrew, Williams, Brammer and Phillips2005). Despite theories suggesting that anhedonia is a genetically influenced vulnerability factor for depression (e.g. Meehl, Reference Meehl1975), few studies have investigated the heritability of hedonic capacity. Furthermore, the limited research available has relied exclusively on self-report measures tapping a broad range of hedonic processes. Growing evidence suggests, however, that hedonic capacity is not a monolithic phenomenon but can instead be parsed into distinct psychological, neural and neurochemical subcomponents (e.g. Berridge & Kringelbach, Reference Berridge and Kringelbach2008). In light of these findings, it is perhaps not surprising that studies based on self-report assessments of anhedonia have yielded wide heritability estimates (from 27% to 82%; Dworkin & Saczynski, Reference Dworkin and Saczynski1984; Berenbaum et al. Reference Berenbaum, Oltmanns and Gottesman1990; Kendler et al. Reference Kendler, Ochs, Gorman, Hewitt, Ross and Mirsky1991; Heath et al. Reference Heath, Cloninger and Martin1994; Hay et al. Reference Hay, Martin, Foley, Treloar, Kirk and Heath2001; MacDonald et al. Reference MacDonald, Pogue-Geile, Debski and Manuck2001; Ono et al. Reference Ono, Ando, Onoda, Yoshimura, Momose, Hirano and Kanba2002; Linney et al. Reference Linney, Murray, Peters, MacDonald, Rijsdijk and Sham2003; Keller et al. Reference Keller, Coventry, Heath and Martin2005). In the present study, we used a probabilistic reward task to objectively assess a fundamental aspect of hedonic capacity, reward responsiveness, which can be conceptualized as an individual's ability to modify behavior according to reinforcement history.
Increased stress sensitivity has been identified as a further promising depressive phenotype (Hasler et al. Reference Hasler, Drevets, Manji and Charney2004). Animal research (e.g. Anisman & Matheson, Reference Anisman and Matheson2005) supported by limited human findings (e.g. Bogdan & Pizzagalli, Reference Bogdan and Pizzagalli2006) suggests that the depressogenic effects of stress may be partly attributable to stress-induced hedonic deficits. Surprisingly, with the exception of a recent study showing that the heritability of perceived stress ranges from 5% to 45% depending on self-report assessment (Federenko et al. Reference Federenko, Schlotz, Kirschbaum, Bartels, Hellhammer and Wust2006), little is known about the heritability of this important depressive phenotype.
The primary goals of the present study were to investigate (1) the feasibility of using a twin approach to assess the genetic contributions of a laboratory-based anhedonic phenotype that was recently shown to characterize MDD subjects (Pizzagalli et al. Reference Pizzagalli, Iosifescu, Hallett, Ratner and Fava2008b); (2) whether this objective measure of reward responsiveness is heritable; and (3) whether genetic and environmental influences are shared between reward responsiveness and perceived stress. A secondary goal was to replicate findings that perceived stress is heritable (Federenko et al. Reference Federenko, Schlotz, Kirschbaum, Bartels, Hellhammer and Wust2006). We hypothesized that both reward responsiveness and perceived stress would be moderately heritable and share genetic and environmental components.
Method
Participants
The final sample consisted of 20 monozygotic (MZ) (age 29.00±10.90 years; 90% female; 95% Caucasian) and 15 dyzogotic (DZ) (age 33.73±13.54 years; 87% female; 87% Caucasian) twin pairs who attended the 30th Annual Twins Days Festival in Twinsberg, OhioFootnote 1Footnote †. Zygosity groups did not differ in age, education, gender, ethnicity, income, or behavioral task performance (p's>0.12). All participants reported normal vision and no current or past psychiatric disorder, neurological illness or learning disorder. Participants received US$5 for their time and ‘won’ US$5 during the probabilistic reward task. All participants provided informed written consent prior to participation. The Committee on the Use of Human Subjects at Harvard University approved the study.
Procedure
Participants completed the probabilistic reward task on a computer in a research booth on festival grounds. The following paper-and-pencil measures were collected: (1) demographic information; (2) two zygosity questionnaires (Kasriel & Eaves, Reference Kasriel and Eaves1976; Ooki et al. Reference Ooki, Yamada, Asaka and Hayakawa1990); (3) the Mood and Anxiety Symptom Questionnaire (MASQ; Watson et al. Reference Watson, Weber, Assenheimer, Clark, Strauss and McCormick1995) to assess anxiety-specific symptoms (Anxious Arousal, AA), depression-specific symptoms (Anhedonic Depression, AD), and general distress (General Distress Anxious Symptoms, GDA; General Distress Depressive Symptoms, GDD); (4) the Beck Depression Inventory-II (BDI-II; Beck et al. Reference Beck, Steer and Brown1996) to assess depressive symptomatology; and (5) the Perceived Stress Scale (PSS; Cohen et al. Reference Cohen, Kamarck and Mermelstein1983) to assess subjective perception of life stress. In the present sample, Cronbach's α reliabilities for all questionnaires were excellent (0.83–0.94).
Probabilistic reward task
The reward task was adapted from Tripp & Alsop (Reference Tripp and Alsop1999) and has been described in detail and validated in multiple independent samples (e.g. Pizzagalli et al. Reference Pizzagalli, Jahn and O'Shea2005; Barr et al. Reference Barr, Pizzagalli, Culhane, Goff and Evins2006). In addition to standard measures of hit rate and reaction time (RT), this task allows for the computation of response bias, which reflects the participant's tendency to select one stimulus regardless of actual stimulus presentation. Unequal frequency of reward following correct identification of two stimuli produces a systematic preference (response bias) for the response paired more frequently with reward (Macmillan & Creelman, Reference Macmillan and Creelman2005). In the present study, response bias was used to assess how subjects modulated their behavior as a function of prior reinforcement history.
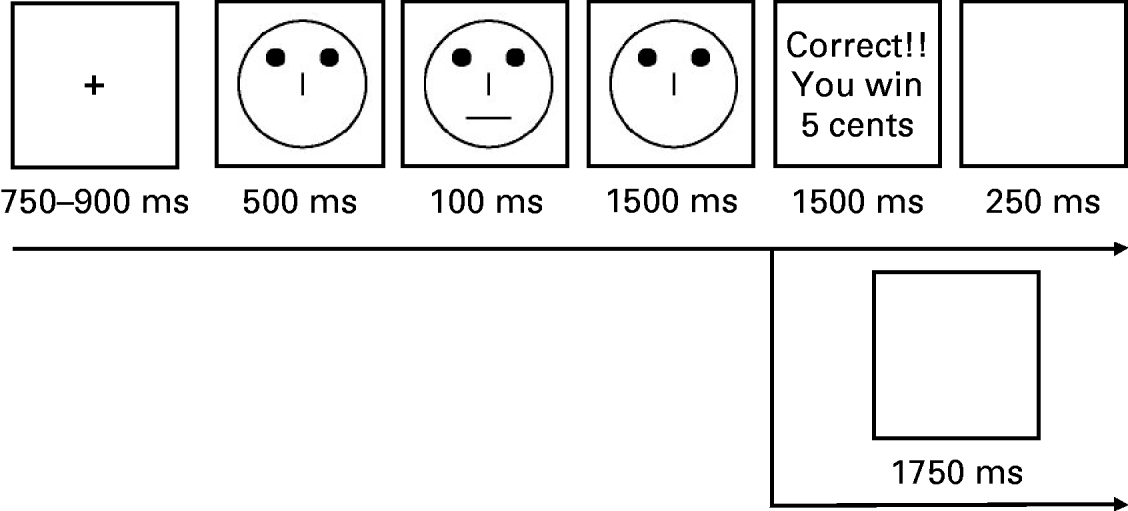
Participants completed three blocks of 80 trials in which they decided whether a mouth was either long (11 mm) or short (10 mm) by making an appropriate response on a computer keyboard (‘v’ or ‘m’; Fig. 1). Importantly, the small size difference between stimuli and the short exposure time made it difficult to ascertain which stimulus was presented. An asymmetric reward schedule between stimulus types was used to induce a response bias. Specifically, in each block, correct identification of one stimulus (‘rich stimulus’) was rewarded (‘Correct!! You won 5 cents’) three times more frequently (24 times) than the other (‘lean stimulus’; 8 times). Key assignment and stimuli were counterbalanced across pairs. Participants were informed that their goal was to win as much money as possible and that not all correct responses would be rewarded.
Schematic representation of the task design and trial presentation.

Data reduction
A two-step procedure was used to identify outlier responses (see Bogdan & Pizzagalli, Reference Bogdan and Pizzagalli2006). Next, hit rates [=(number of hits)/(number of hits+number of misses)] and RT scores were calculated for rich and lean stimuli separately. Response bias was computed as follows:

Statistical analyses
Twin analyses
Pearson correlation analyses provided MZ and DZ twin pair correlations. Model fitting can be used to estimate the extent of additive genetic (A), dominant genetic (D), common environment (C), and non-shared environment/measurement error (E) contributions (Purcell, Reference Purcell, Plomin, DeFries and McClearn2001; Rijsdijk & Sham, Reference Rijsdijk and Sham2002). The factor ‘A’ represents the sum of the effects of individual alleles at all loci, whereas ‘D’ captures interactions between alleles. ‘C’ represents environmental influences shared by family members, whereas ‘E’ captures individual-specific environment influences (and measurement error). In the present study, an ADE model was chosen based on the observations that (1) correlations involving block 3 response bias and MASQ GDD were more than twice as large in MZ than DZ twins, and (2) an ADE model provided a better fit than an ACE model (findings available upon request).
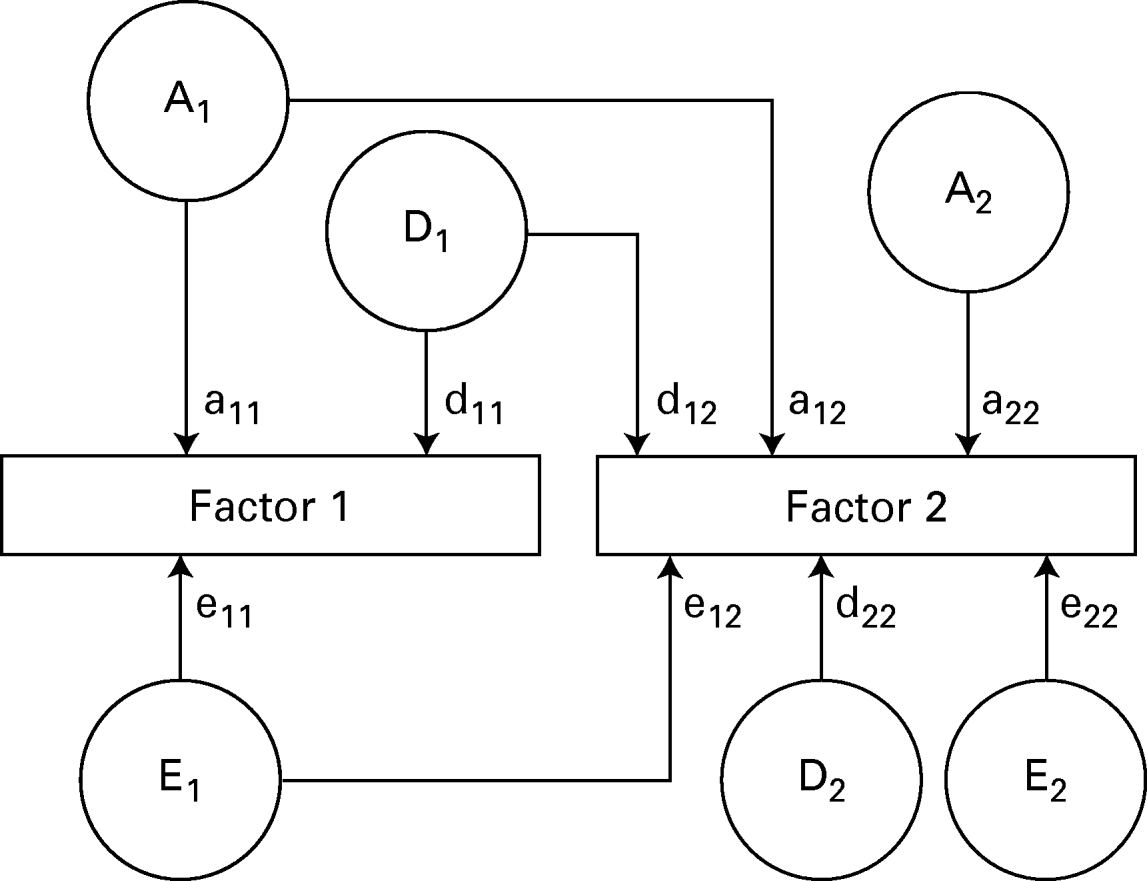
As both hedonic capacity and perceived stress have been associated with depression severity (e.g. Kasch et al. Reference Kasch, Rottenberg, Arnow and Gotlib2002; Candrian et al. Reference Candrian, Farabaugh, Pizzagalli, Baer and Fava2007), and stress diminishes reward responsiveness (e.g. Bogdan & Pizzagalli, Reference Bogdan and Pizzagalli2006), three independent bivariate ADE Cholesky decomposition models were applied to evaluate shared and residual A, D and E contributions to depression, reward responsiveness (block 3 response bias) and perceived stress. The first Cholesky model specified three latent factors (A1, D1 and E1) with pathways influencing both depression (MASQ GDD; a11, d11 and e11) and reward responsiveness (a12, d12 and e12), in addition to three factors (A2, D2 and E2) accounting for residual influences specific to reward responsiveness (Fig. 2). The second and third model were identical to the first, with the exception that perceived stress replaced reward responsiveness and perceived stress replaced GDD respectively. These bivariate models yielded correlations between additive genetic (r a), dominant genetic (r d), and individual-specific environment factors (r e) influencing the two phenotypes under investigation.
Path diagram for the bivariate Cholesky decomposition ADE model. The ‘A’ and ‘D’ components are correlated with r=1.00 between monozygotic (MZ) twins and 0.5 and 0.25 in dizygotic (DZ) twins respectively. Three independent bivariate models were run: Model 1: Factor 1=general distress depressive symptoms (GDD), Factor 2=block 3 response bias; Model 2: Factor 1=GDD, Factor 2=perceived stress; Model 3: Factor 1=perceived stress, Factor 2=block 3 response bias.

Full models were compared to nested submodels containing reduced parameters. Akaike's Information Criterion (AIC), which combines degrees of freedom with χ2 goodness of fit, was used to evaluate model fit; the model with the lowest AIC value not significantly departing from the full model was chosen as the best-fitting model as it provides the best balance between parsimony and exploratory power. Model-fitting analyses were performed with Mx (Neale et al. Reference Neale, Boker, Xie and Maes1999) following established procedures (e.g. Kendler et al. Reference Kendler, Gardner, Gatz and Pedersen2007; Orstavik et al. Reference Orstavik, Kendler, Czajkowski, Tambs and Reichborn-Kjennerud2007).
Analyses focused on response bias in block 3 because this variable fully captures overall reward responsiveness after contingencies have been learnedFootnote 2. The GDD scale of the MASQ was used as a measure of depression because this subscale, unlike the BDI-II scale, is relatively unrelated to anhedonic symptoms (Watson et al. Reference Watson, Weber, Assenheimer, Clark, Strauss and McCormick1995). This statistical non-overlap was important in light of prior findings linking decreased reward responsiveness to anhedonic symptoms (e.g. Pizzagalli et al. Reference Pizzagalli, Jahn and O'Shea2005).
Control analyses
An analysis of variance (ANOVA) with Block (1, 2, 3) was performed on response bias scores across all subjects. Stimulus Type (Rich, Lean) was added as a factor to hit rates and RT ANOVAs. Post-hoc Newman–Keuls tests evaluated significant ANOVA effects. Pearson correlations were calculated to investigate relationships between (1) response bias and (2) depressive/anxiety symptoms (MASQ and BDI) as well as perceived stress (PSS).
Results
Twin analyses
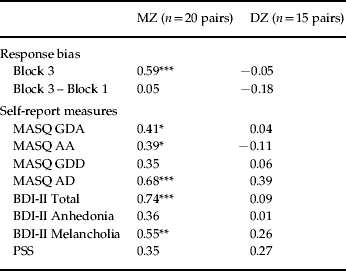
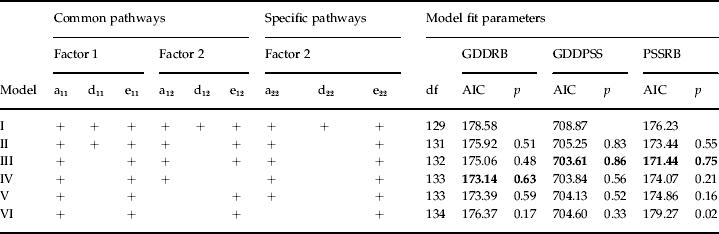
All MZ twin correlations were higher than corresponding DZ correlations (Table 1). Bivariate Cholesky ADE decomposition model-fitting results are shown in Table 2. The best-fitting model for GDD and reward responsiveness was model IV, which dropped all dominant genetic pathways (d11, d12, d22) and the common individual-specific environmental pathway (e12) from the model. This model estimated that additive genetic influences explained 46% [95% confidence interval (CI) 0.07–0.72] and 43% (95% CI 0.00–0.76) of the variance in reward responsiveness and GDD respectively, and individual-specific environment/measurement error accounted for the remainder. According to this model, reward responsiveness and GDD are influenced by some of the same genes (r a=0.29, 95% CI −0.28 to 1.00). Thus, the overall heritability estimate of reward responsiveness can be subdivided into a small portion that was attributable to genetic effects also acting on GDD (0.04) and also residual effects that were unique to reward responsiveness (0.42)Footnote 3.
Twin correlations for response bias and self-report measures

MZ, Monozygotic; DZ, dizygotic; MASQ, Mood and Anxiety Symptom Questionnaire (Watson et al. Reference Watson, Weber, Assenheimer, Clark, Strauss and McCormick1995; GDA, General Distress Anxious Symptoms; GDD, General Distress Depressive Symptoms; AA, Anxious Arousal; AD, Anhedonic Depression); BDI-II, Beck Depression Inventory-II (Beck et al. Reference Beck, Steer and Brown1996); BDI-II Anhedonia (Pizzagalli et al. Reference Pizzagalli, Jahn and O'Shea2005), sum of BDI items associated with anhedonic symptoms (item 4: loss of pleasure; item 12: loss of interest; item 15: loss of energy; item 21: loss of interest in sex); BDI-II Melancholia (Pizzagalli et al. Reference Pizzagalli, Jahn and O'Shea2005), sum of BDI items associated with melancholic symptoms (items 4, 12, 21; item 5: guilty feelings; item 11: agitation; item 6b: early morning awakening); PSS, Perceived Stress Scale (Cohen et al. Reference Cohen, Kamarck and Mermelstein1983).
*** p<0.01, ** p<0.05, * p<0.10.
Bivariate model fitting for block 3 response bias and perceived stress

a, Additive genetic factors; d, dominant genetic factors; e, non-shared environment/measurement error; df, degrees of freedom, +, included pathway; GDDRB, bivariate Cholesky model with general distress depression [Mood and Anxiety Symptom Questionnaire (MASQ) General Distress Depressive Symptoms (GDD)] (Factor 1) and block 3 response bias (Factor 2); GDDPSS, bivariate Cholesky model with MASQ GDD (Factor 1) and perceived stress (Factor 2); PSSRB, bivariate Cholesky with perceived stress (Factor 1) and block 3 response bias (Factor 2); AIC, Akaike's Information Criterion.
The lowest AIC value determined the best model fit. Best-fitting models are in bold.
The best-fitting model for GDD and perceived stress was model III, which dropped all dominant genetic pathways (d11, d12, d22). According to this model, genetic contributions accounted for 40% (95% CI 0.00–0.75) and 44% (95% CI 0.05–0.70) of the variance in GDD and perceived stress respectively; individual-specific environment/measurement error accounted for the remainder. The genetic correlation was estimated to be high (r a=0.67) but the CI was wide (95% CI −1.00 to 1.00). The individual-specific environment correlation was moderate (r e=0.33, 95% CI −0.10 to 0.66). Thus, the overall heritability estimate of perceived stress can be subdivided into a large portion that was attributable to genetic effects acting on GDD (0.20) and also a residual part that was unique to perceived stress (0.24). Similarly, the overall individual-specific environmental contribution can be subdivided into a small portion attributable to individual-specific environmental factors contributing to GDD (0.05) and unique contributions to stress perception (0.51).
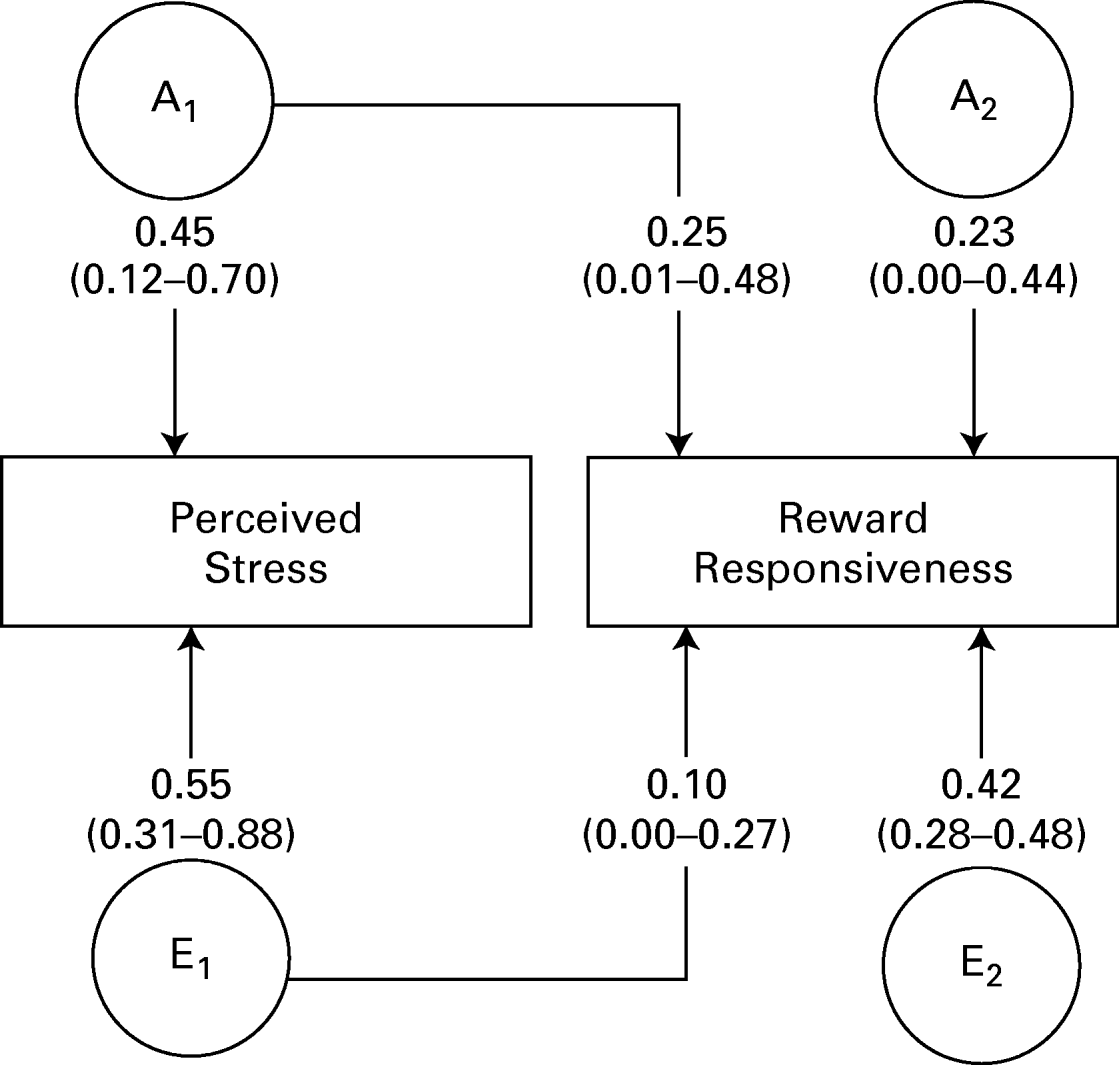
The best-fitting model for perceived stress and reward responsiveness was model III. According to this model, additive genetic factors contributed to 45% (95% CI 0.12–0.70) and 48% (95% CI 0.14–0.73) of variance in stress perception and reward responsiveness respectively; the majority of this genetic variance was shared between perceived stress and reward responsiveness (r a=0.72, 95% CI 0.11–1.00) whereas individual-specific environment/measurement error factors were negatively correlated (r e=−0.43, 95% CI −0.69 to −0.04; Fig. 3). Thus, the overall heritability estimate of reward responsiveness can be subdivided into a large portion that overlaps with genetic effects acting on stress perception (0.25) and also a residual component that was unique to reward responsiveness (0.23). Similarly, the overall individual-specific environmental contribution can be subdivided into a small portion attributable to factors contributing to perceived stress (0.10) and unique contributions to reward responsiveness (0.42).
The best-fitting bivariate Cholesky decomposition model for perceived stress and reward responsiveness. Numbers provided are percentage of variance.

Control analyses
Consistent with past research (e.g. Pizzagalli et al. Reference Pizzagalli, Jahn and O'Shea2005; Bogdan & Pizzagalli, Reference Bogdan and Pizzagalli2006), analyses on response bias produced a main effect of Block [F(2, 136)=3.51, p<0.05, partial η2=0.05] due to increases from block 1 (0.10±0.18) to block 2 (0.14±0.19) and block 3 (0.16±0.18; Newman–Keuls all p's<0.04). Control analyses on hit rates and RT data confirmed these results; the rich hit rate increased over time and was greater than the lean hit rate in each block and RT decreased over time, more so for the rich stimulus type (F's>3.50, p's<0.05; all Newman–Keuls p<0.03). Collectively, these findings suggest that the task elicited the intended effects; participants developed a behavioral preference towards the more frequently rewarded (rich) stimulus, as evident from the response bias, hit rate and RT findings. Contrary to previous studies (Pizzagalli et al. Reference Pizzagalli, Jahn and O'Shea2005; Bogdan & Pizzagalli, Reference Bogdan and Pizzagalli2006), however, no significant correlations emerged between self-report data and response bias (all |r|<0.19, all p's>0.12).
Discussion
The main goals of the present study were to (1) evaluate the feasibility of a twin approach to investigate genetic contributions to a laboratory-based anhedonic phenotype, (2) provide preliminary heritability estimates for reward responsiveness and perceived stress, and (3) assess the genetic and environmental correlation between perceived stress and reward responsiveness.
The present findings provide initial evidence that both reward responsiveness and perceived stress are heritable and influenced by individual-specific environmental factors. Consistent with previous literature assessing components of hedonic capacity (e.g. Loas, Reference Loas1996), findings revealed that additive genetic factors and individual-specific environment/measurement error contributed to 46% and 54% of the variance in reward responsiveness respectively. Moreover, replicating prior findings (Federenko et al. Reference Federenko, Schlotz, Kirschbaum, Bartels, Hellhammer and Wust2006), heritability estimates suggested that additive genetic factors contributed to 44% of the variance in stress perception and individual-specific environment contributed to the remainder. Of note, the genetic correlation between GDD and reward responsiveness was modest (r a=0.29). This finding is in line with conceptualizations suggesting that low positive affect and high negative affect are separate components of depression, with the former uniquely differentiating depression from anxiety and general negative affectivity being a non-specific factor linked to both disorders (Watson et al. Reference Watson, Weber, Assenheimer, Clark, Strauss and McCormick1995). More generally, this finding highlights the heterogeneity of depression and provides support for the endophenotypic research conceptualization (e.g. Hasler et al. Reference Hasler, Drevets, Manji and Charney2004). In contrast to GDD and reward responsiveness, the genetic overlap between perceived stress and GDD was large (r a=0.67); this overlap may be the result of robust associations between neuroticism, stress perception and depression (e.g. Federenko et al. Reference Federenko, Schlotz, Kirschbaum, Bartels, Hellhammer and Wust2006; Kendler et al. Reference Kendler, Gatz, Gardner and Pedersen2006).
Importantly, this study suggests substantive overlap between genetic and individual-specific environmental factors influencing stress perception and reward responsiveness. Thus, genes that enhance perceived stress also increase reward responsiveness (r a=0.72); conversely, individual-specific environmental factors that enhance perceived stress decrease reward responsiveness (r e=−0.43). Genetic overlap between stress perception and reward responsiveness is intriguing, particularly when considering a large body of animal and human work emphasizing links between increased stress sensitivity and vulnerability to addiction, including evidence that stress can enhance the rewarding properties of addictive drugs (Kreek et al. Reference Kreek, Nielsen, Butelman and LaForge2005; Hyman et al. Reference Hyman, Malenka and Nestler2006). The negative correlations between environmental factors influencing perceived stress and reward responsiveness, however, raise the possibility that life stressors increasing stress perception might have deleterious consequences on the ability to modulate behavior as a function of reinforcers. Although speculative, this interpretation is consistent with prior findings of (1) a negative relationship between perceived stress and reward responsiveness (Pizzagalli et al. Reference Pizzagalli, Bogdan, Ratner and Jahn2007) and (2) increased anhedonia when facing laboratory (Bogdan & Pizzagalli, Reference Bogdan and Pizzagalli2006) and naturalistic (Berenbaum & Connelly, Reference Berenbaum and Connelly1993) stressors. The positive genetic correlation and negative environment correlation between stress perception and reward responsiveness may account for the lack of a phenotypic correlation in the present study.
The limitations of this study warrant attention. First, although comparable to some prior twin studies (e.g. Berenbaum et al. Reference Berenbaum, Oltmanns and Gottesman1990; Kendler et al. Reference Kendler, Ochs, Gorman, Hewitt, Ross and Mirsky1991; Matthews et al. Reference Matthews, Simmons, Strigo, Jang, Stein and Paulus2007), the small sample size limited our statistical power; this is evidenced by large 95% CIs. Second, data were collected outside controlled laboratory settings, which may have contributed to measurement error. However, MZ and DZ correlations were similar to those reported from other studies with larger samples (e.g. Hay et al. Reference Hay, Martin, Foley, Treloar, Kirk and Heath2001; Federenko et al. Reference Federenko, Schlotz, Kirschbaum, Bartels, Hellhammer and Wust2006), and the general pattern of behavioral performance was comparable to prior independent samples tested with the same reward task in the laboratoryFootnote 4. Unlike prior studies using this paradigm, however, no significant correlations emerged between the behavioral task and depressive measures, highlighting an important limitation of this study.
Despite these limitations, this is the first twin study, to our knowledge, that assesses: (1) hedonic capacity with an objective behavioral measure, and (2) genetic and environmental correlations between general depression, reward responsiveness and perceived stress. The findings of this study extend prior research using this probabilistic reward task in which reduced reward responsiveness has been associated with (1) elevated depressive (particularly anhedonic) symptoms (Pizzagalli et al. Reference Pizzagalli, Jahn and O'Shea2005) and a clinical diagnosis of depression (Pizzagalli et al. Reference Pizzagalli, Iosifescu, Hallett, Ratner and Fava2008b); (2) acute laboratory-induced stress (Bogdan & Pizzagalli, Reference Bogdan and Pizzagalli2006) and elevated perceived stress (Pizzagalli et al. Reference Pizzagalli, Bogdan, Ratner and Jahn2007); and (3) pharmacologically induced reduction of dopaminergic transmission (Pizzagalli et al. Reference Pizzagalli, Evins, Schetter Cowman, Frank, Pajtas, Santesso and Culhane2008a). Collectively, these findings indicate that laboratory-based assessments of quantifiable aspects of depressive phenotypes might provide a powerful tool for parsing the heterogeneity characteristic of this complex and debilitating disease. In addition to replicating the present findings, molecular genetic approaches will be required to test the potential contributions of various candidate genes to hedonic capacity (e.g. Noble, Reference Noble2003; Bogdan et al. Reference Bogdan, Perlis and Pizzagalli2006) and perceived stress (e.g. Otte et al. Reference Otte, McCaffery, Ali and Whooley2007), which promise to provide crucial insights into the etiology of depression.
Acknowledgments
This study was supported by a Ditmars Research Fund and Sigma-Xi Grants-in-Aid-of-Research grant to R. B. and NIMH grant R01 MH68376 to D. A. P. R. B. was a Sackler Scholar in Psychopathology and was supported by an NIMH NRSA predoctoral training grant R90 DA023427-01 during the preparation of this manuscript. We thank Manuel Ferreira, Mei-Hua Hall and Shaun Purcell for statistical consultation. We are also grateful for the invaluable resources housed at the Mx scripts library (www.psy.vu.nl/mxbib/). Lastly, we thank the annual Twins Days festival organizers for facilitating the present project.
Declaration of Interest
Dr Pizzagalli has received research support from GlaxoSmithKline and Merck & Co., Inc. for research unrelated to the present study.