I. INTRODUCTION
Iron aluminide alloys, i.e., alloys based on the intermetallic phases Fe3Al and FeAl, are considered since long as a possible inexpensive replacement for stainless steels for structural applications up to service temperatures of 1000 °C because of their low density (5.7–6.7 g cm−3), outstanding corrosion resistance, and high wear resistance. Reference Sykes and Bampfylde1–Reference McKamey, DeVan, Tortorelli and Sikka3 However, limited ductility at ambient temperature and a lack of strength above 600 °C have limited the use of iron aluminide-based alloys to niche applications up to now. Reference Kratochvil4,Reference Morris and Munoz-Morris5 Recent progress in increasing the strength, specifically of Fe3Al-based alloys at high temperatures, has again put these alloys into the focus for industrial application. Reference Palm, Schneider, Stein, Sauthoff, Mills, Inui, Clemens and Fu6–Reference Palm8
While the production of corrosion resistant coatings from FeAl-based alloys has been widely explored by different techniques including laser cladding (see e.g., Refs. Reference Guilemany, Lima, Cinca and Miguel9–Reference Yang, Wang, Li and Li11), additive layer manufacturing (ALM) of samples or parts from iron aluminide-based alloys has been hardly investigated. Song et al. Reference Song, Dong, Coddet, Liao and Coddet12,Reference Song, Dong, Liao and Coddet13 produced parts of 98% density from a FeAl powder by selective laser melting (SLM) and Bax et al. consolidated a FeAl powder by laser cladding. Reference Bax, Schäfer, Pauly and Mücklich14 Layer-by-layer production of powder stacks and subsequent uniaxial pressing, Reference Durejko, Lipinski, Bojar and Bystrzycki15 layer-by-layer 3D cladding, Reference Shishkovsky, Missemer, Kakovkina and Smurov16 and laser engineered net shaping (LENS) Reference Ziętala, Durejko and Bystrzycki17 have been explored for the production of chemically graded Fe–Al samples. The only reports on ALM of Fe3Al-based alloys are on precipitation hardened Fe–30Al–0.35Zr–0.1B (in at.%) Reference Durejko, Lazinska and Przetakiewicz18 and Fe–Al–Ti alloys Reference Kwiatkowska, Polanski and Bystrzycki19 by LENS.
The benefit of producing parts from Fe3Al-based alloys by ALM could be two-fold. Due to the high cooling rates, fine-grained microstructures may be obtained whereby ductility at room temperature can be increased. Reference Morris and Morris-Muñoz20 The near net-shape production of parts by ALM will in addition reduce the costs for machining, which is expensive in case of the brittle and hard Fe3Al-based alloys.
In the present work, two different techniques are applied for production of samples from pre-alloyed gas-atomized Fe–28Al (at.%) powder: SLM and laser metal deposition (LMD). The effects of process parameters, preheating of substrate, and building scanning directions are investigated with respect to porosity, formation of cracks, microstructure, and basic mechanical properties. The current work is part of a large scale collaborative German project of exploring the possibilities for the production of parts from iron aluminide-based alloys by ALM for automotive, aeronautics, and energy conversion applications.
II. EXPERIMENTAL
Powders of analyzed composition Fe–28.3 at.% Al were produced by gas-atomization. The grain fractions 45–90 µm and 20–45 µm were used for LMD and SLM, respectively. The volume distribution of the powder fractions was determined by the image analysis system Morphologi G3 (Malvern Instruments Ltd., Malvern, UK). The shape of the powder particles which gives an indication of the flowability was determined in a scanning electron microscope (SEM) Zeiss Leo 1455EP (Carl Zeiss AG, Oberkochen, Germany). The powder was further characterized by x-ray diffraction (XRD) using monochromatic CoKα1-radiation (λ = 0.178897 nm) for the range 20° ≤ 2θ ≤ 130°. To elaborate whether any exothermic reactions occur, i.e., that the powder has fully reacted during gas atomization, differential thermal analysis (DTA) was performed in alumina crucibles under an argon atmosphere at a heating rate of 10 K/min on a SETARAM SETSYS-18 DTA (SETARAM Instrumentation, Caluire, France).
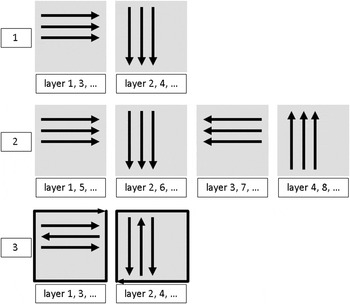
The LMD experiments were performed with a 2 kW Nd-YAG laser source at a Varilas 3-axis NC machine (Schuler Held Lasertechnik GmbH, Dietzenbach, Germany). A focusing optic with a focal length of 200 mm was used. In the focus area, the spot has a diameter of 600 µm in a near top hat intensity distribution. When used out of focus, the intensity distribution is more Gaussian. The powder was fed by a disc powder feeder GTV PF 2/2 (GTV Verschleißschutz GmbH, Luckenbach, Germany), using argon as carrier gas. A so-called powder gas stream focus was produced by a coaxial powder feed nozzle (Fraunhofer ILT, Aachen, Germany) in the working plane. A coaxial argon gas stream was used for additionally shielding of the melt pool against oxidation. In a first step, single tracks were produced. The process parameters beam diameter (D), laser power (P), feed speed (v), and powder mass flow (m p) were varied. The track geometries were investigated with respect to the aspect ratio, which is determined by the quotient of track width and height and should be between 3 and 4. For an aspect ratio <3, the track height is too high leading to defects between overlapping tracks. For an aspect ratio >4, the track height is too low leading to a small build-up rate and high dilution. The process parameters which met the aspect ratio were used for multiple track layers. An overlap offset of 50% of the single track width was chosen to obtain a smooth top surface of the single layer. Three strategies were applied for building the specimens (Fig. 1).
Schematic illustration of building strategies for LMD samples, third strategy with contour path.

For SLM, a 200 W continuous wave fiber laser source was used at a laboratory machine. The focused laser spot has a diameter of 100 µm in a Gaussian intensity distribution. The process was conducted in a Glovebox filled with argon. The oxygen content amounted to less than 30 ppm during processing. Specimens of 8 × 8 × 8 mm³ were built with a meander scanning sequence and 90° alteration between each layer. The layer thickness amounted to D s = 30 µm, and the hatch distance to Δy s = 70 µm. The process parameters such as laser power (P) and scanning speed (v s) were varied. After the process, the unused and not melted powder is sieved and can be reused in the next process. In the literature, it had been shown (e.g., Ref. Reference Song, Dong, Coddet, Liao and Coddet12) that Fe–Al samples can be built on stainless steel. Therefore, stainless steel 1.4301 (X5CrNi18-10) was used as the substrate material with a thickness of 5 mm for LMD and 8 mm for SLM.
The produced samples were investigated by dye penetration testing to detect cracks at the surfaces. The microstructures were investigated at cross sections by optical microscopy (Zeiss Axiophot, Carl Zeiss AG, Oberkochen, Germany) and the porosity by the software Olympus Stream Motion. Microstructures were visualized by etching with hydrofluoric acid. SEM was performed on a JEOL JSM 6490 (JEOL Ltd., Tokyo, Japan) additionally equipped with energy-dispersive x-ray spectroscopy (EDS) and electron backscatter diffraction (EBSD) detectors. Compositions of the samples were established by wet-chemical analysis and by wave length-dispersive spectrometry (WDS) on an electron probe microanalyzer (JEOL JXA-8100, JEOL Ltd., Tokyo, Japan). Microhardness tests were performed on an automatic hardness tester Leco M-400-G (LECO Instrumente GmbH, Mönchengladbach, Germany) measuring HV0.1 with a loading time of 15 s. For mechanical testing, samples were heat treated at 400 °C for 168 h in an argon atmosphere. Samples for compression (10 × 5 × 5 mm³) and four-point bending (18 × 6 × 3 mm³) tests were cut by electrical discharge machining (EDM) and tested on a Schenck Trebel universal testing machine (Schenck Trebel GmbH, Ratingen, Germany) at a strain rate 10−4 s−1 between room temperature and 1000 °C.
III. RESULTS AND DISCUSSION
A. Characterization of the powder
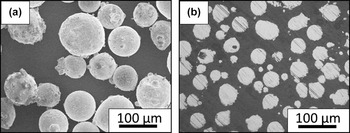
The flowability of the powder during the LMD and SLM processes is benefited by a spherical shape of the powder particles. Figure 2(a) shows exemplarily that the particles have the typical spherical shape of gas-atomized powder with few satellites. The cross section of the embedded powder particles [Fig. 2(b)] demonstrates that the particles are dense with only few pores.
Fe–28 at.% Al powder particles: (a) SEM micrographs (secondary electron (SE) contrast) of loose particles, (b) light optical micrograph of cross section of embedded particles.

The volume median diameter D (v, 0.5) describes the particle diameter where 50% of the distribution is above and 50% below this value. The measured powder fractions show a D (v, 0.5) of 31.8 and 84.1 for SLM and LMD, respectively.
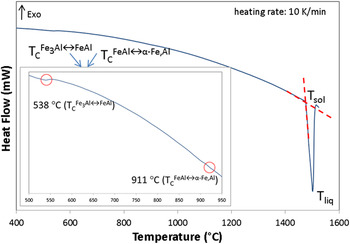
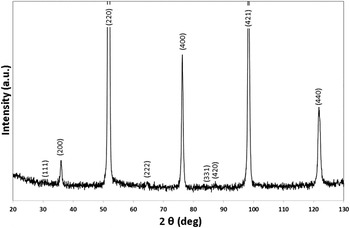
No exothermic reactions were observed on heating in the DTA confirming that the alloy had fully reacted during gas atomization (Fig. 3). Observed endothermic peaks at 538 °C (Fe3Al/FeAl transformation), 911 °C (FeAl/α–Fe,Al), 1477 °C (solidus), and 1499 °C (liquidus) are those expected for an Fe–Al alloy with 28 at.% Al Reference Stein and Palm21 and the results also confirm the presence of Fe3Al at room temperature. XRD shows that the powder is fully crystalline and no additional phases besides Fe3Al, i.e., Al, Fe, or impurity phases, were observed (Fig. 4).
DTA heating curve of pre-alloyed gas-atomized Fe–28Al at.% powder with transformation temperatures highlighted.

XRD pattern of pre-alloyed gas-atomized Fe–28Al at.% powder showing the sole presence of Fe3Al.

B. LMD
The parameter field for single tracks was set as follows:
-
(i) Feed speed (v): 400–1000 mm/min in steps of 100 mm/min
-
(ii) Beam diameter (d): 0.6, 1.0, and 1.4 mm
In addition, the laser power (P) and the powder mass flow (m p) were varied. In the first experiments, cracks were frequently observed at two different locations. Cracks in the bonding zone resulted from thermal stresses between substrate and built sample while other cracks originated from notches on the lateral surface, e.g., between two layers. To avoid crack formation in intermetallic alloys processed by ALM, preheating of the substrate is frequently used, e.g., 300 °C has been used in case of laser cladding for Fe3Al Reference Bax, Schäfer, Pauly and Mücklich14 or 500 °C for SLM of TiAl. Reference Stein, Schneider and Frommeyer22 The brittle-to-ductile transition temperature (BDTT) of Fe–28 at.% Al is at 150 °C. Reference Risanti, Deges, Falat, Kobayashi, Konrad, Palm, Pöter, Schneider, Stallybrass and Stein23 By processing the alloy below this temperature, formation of cracks during cooling may be expected. Therefore, the substrate material was preheated at 200 °C to reduce thermal stresses. To avoid notches on the lateral surface of the samples and to obtain a smooth lateral surface, a contour path was applied before every new layer. With both procedures, substrate preheating and contour path, crack-free samples were generated with dimensions 10 × 10 × 10 mm³.
In samples generated with a beam diameter of 0.6 mm, initially a density of at least 99.5% was achieved. However, individual pores showed diameters up to 180 µm. By removing absorbed moisture by drying the powder in a furnace at 110 °C for two hours, the density of the samples was increased to 99.8% and the maximum diameter of pores was reduced to 40 µm. In contrast, when samples were built with beam diameters 1.0 mm and 1.4 mm even after powder drying the density of the samples did not always reach 99.5%. This could be due to the fact that an increasing beam diameter leads to an increasing melt pool and trapped gas may not be successfully released.
C. SLM
In these experiments, laser power and scanning speed were varied while other parameters such as layer thickness (D s) and hatch distance (Δy s) were constant.
-
(a) Scanning speed (v s): 100–500 mm/s in steps of 100 mm/s
-
(b) Laser power (P): 100–200 W in steps of 20 W
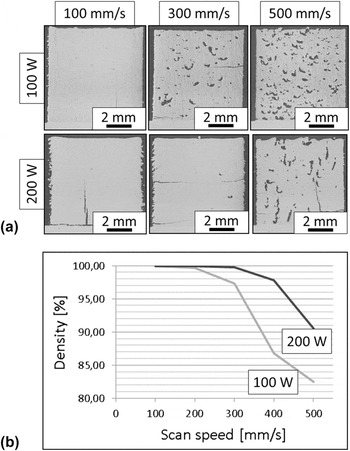
While the laser power is kept constant, the energy input decreases with increasing scanning speed. Therefore, the density of the samples decreases with increasing scanning speed (Fig. 5). When the scanning speed is kept constant, the energy input increases with increasing laser power, therefore a higher density is achieved. The generated samples reach densities higher than 99.5%, partly higher than 99.95%.
(a) Light optical micrographs of cross sections of SLM samples generated with varied laser power and scanning speed and (b) resulting densities.

Similar to the LMD samples, cracks originating from notches at the lateral surface and in the bonding zone were observed [Fig. 5(a)]. Like for the LMD samples, by scanning a contour path the lateral surface is smoothed and therefore 90% of the samples were free of cracks. By preheating the substrate to 200 °C, cracks in the bonding zone between sample and substrate could only be avoided for about 50% of the samples. Further experiments to avoid cracking by using a higher preheating temperature and supporting structures are planned.
D. Compositions and microstructures
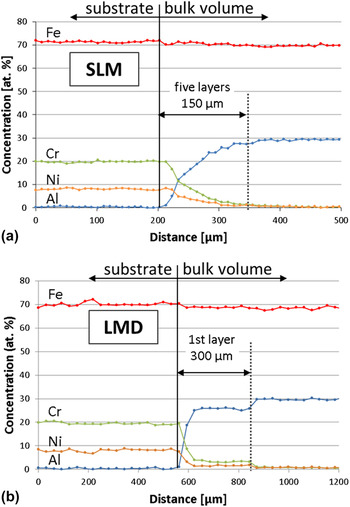
To verify the composition of samples produced via LMD or SLM and to examine the influence of the steel substrate on the built samples, wet-chemical and WDS analyses were performed. Wet chemical analysis gave 26.6 at.% Al for the SLM and 27.1 at.% Al for the LMD sample. According to WDS analysis, the Al content of the SLM samples is 27.2 ± 0.3 at.% and that of the LMD samples 27.8 ± 0.3 at.%. These values are a little bit lower than that of the powder (28.3 at.% Al) and may be caused by preferential evaporation of Al. According to the analyses, this effect is slightly stronger for SLM due to the higher energy density and an overheating of the melt pool. No chemical gradient between bottom and top of the SLM and LMD samples was detected by WDS. Qualitative EDS line scans were performed in the bonding zone between substrate and built samples in the center and near to the edge of each sample. Nickel and chromium, the main alloying elements of the steel, are detected in SLM and LMD samples within a small zone (Fig. 6). In the SLM samples, the zone has a width of approximately 150 μm, which corresponds to five layers. In the LMD samples, the zone has a width of about 300 μm, which corresponds to one layer. No additional phases like carbides or nitrides were detected in the bonding zone and in the samples.
Qualitative EDS line scans of the bonding zone between substrate and built sample: (a) SLM; (b) LMD.

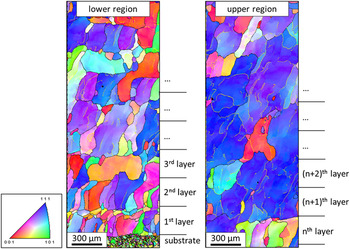
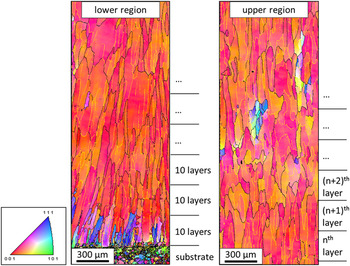
Microstructure visualization via EBSD shows formation of large, elongated grains in the LMD and SLM samples (Figs. 7 and 8). While the first layers are finer-grained (“lower region” in Figs. 7 and 8), selection of grains takes place during further built up (“upper region” in Figs. 7 and 8) leading to coarsening and the formation of elongated grains of several hundred micrometers in length. In the lower region of the LMD samples, grains grew across two or three layers (900 µm), while in the upper region grains with a length of up to 2 mm are found (seven layers). In the SLM samples, a fine-grained structure only exists in the first ten layers. From there, grain coarsening takes place and grains grew across up to 80 layers (2.4 mm). In contrast to LMD, the track width in SLM amounted to about 1/6 of the track width in LMD. Also, a larger proportion of the previous layer is remelted in SLM than in LMD. Furthermore, higher temperature gradients and faster cooling appears. All these effects lead to grains which are much smaller in width and more elongated than in the LMD samples (Figs. 7 and 8). This is in good agreement with the literature where elongated grains of several hundred micrometers were documented, i.e., in Ref. Reference Vilaro, Kottman-Rexerodt, Thomas, Colin, Bertrand, Thivillon, Abed, Ji, Aubry, Peyre and Malot24 for Ti–6Al–4V processed by SLM.
Inverse pole figure (IPF) maps of a LMD sample in side view; lower region (left) and upper region (right); sample was prepared with process parameters: P = 180 W, v = 600 mm/min, d = 0.6 mm.

IPF maps of a SLM sample in side view; lower region (left) and upper region (right); sample was prepared with process parameters: P = 120 W, vs = 200 mm/s.

In addition to grain coarsening, the crystallographic orientation changes from a random orientation at the base of the samples to a preferred orientation in the upper region. In case of the LMD samples, grains show the <111> orientation along the building direction, while in the SLM samples crystal orientations are close to <001>. In the EBSD maps, most of the grains show a continuous variation of the color in building direction. Misorientation profiles revealed misorientations within individual grains of about 10°–14° for the LMD samples and up to 20° in case of the SLM samples. A higher temperature gradient, higher cooling rate, and therefore larger residual internal stresses in SLM than in LMD samples, are hints that these misorientations remained from processing.
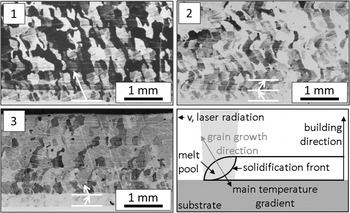
The different strategies for building the LMD samples that were applied (Fig. 1) did not show an influence on the grain size but on the direction of the grain growth. In samples built with strategy 1, the grains grew with an angle of about 60° to the substrate surface in feed direction. This is due to the curvature of the solidification front within the melt pool (Fig. 9) which creates a temperature gradient which is not perpendicular to the substrate surface. In strategy 1, every second layer is applied unidirectional. Therefore, the grain growth direction is repeated. In contrast, in strategy 2 the feed direction is repeated in every fourth layer. Every second layer is applied in inverse feed direction. Though the angle to the substrate is identical to strategy 1, the direction of the grain growth changes in every second layer in the samples built with strategy 2 (Fig. 9). In strategy 3, the direction of the solidification front changes within one layer from track to track by applying the layers in a meandering pattern (Fig. 1). Due to the constant change of the solidification front, an almost vertical growth of the grains occurs (Fig. 9). The dependence of the grain growth direction on different scanning strategies was investigated for SLM in Ref. Reference Vilaro, Kottman-Rexerodt, Thomas, Colin, Bertrand, Thivillon, Abed, Ji, Aubry, Peyre and Malot24 and the results are in accordance with the structures presented in this work.
Light optical micrographs of cross sections of samples built by strategies 1 to 3 shown in Fig. 1 and schematic illustration of grain growth direction and main temperature gradient.

Figure 9 schematically shows the grain growth direction, the main temperature gradient, the solidification front, and the building direction which illustrates the dependency of the growth orientation on the scanning direction.
E. Mechanical behavior
The microhardness of the LMD-processed samples is 313 ± 13 HV0.1 and of the SLM samples 353 ± 15 HV0.1. The slightly higher microhardness of the SLM samples may be attributed to the higher residual stresses. The observed microhardness of the LMD and SLM samples is very similar to values for as-cast Fe–27.6 at.% Al with an average grain size of 290 μm. Reference Sundar, Kutty and Sastry25
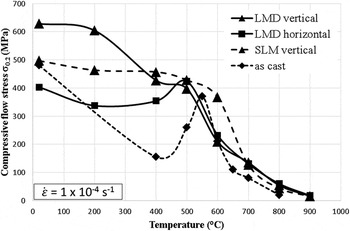
For mechanical testing, all samples were annealed at 400 °C/168 h. This heat treatment is necessary for comparison of data because strength and ductility of Fe–Al are markedly influenced by quenched in vacancies, whose amount varies in dependence of processing conditions. It is noted that the residual stresses are hardly relieved by this heat treatment, and that the temperature is too low to cause any changes in the microstructure. Compressive flow stresses of the LMD samples were evaluated perpendicular to and in building direction, i.e., with the applied stress parallel or perpendicular to the grain boundaries, respectively. Figure 10 shows the compressive flow stress in dependence of temperature. Below 500 °C, the LMD samples tested perpendicular to the grain boundaries (building direction) show markedly higher flow stresses than if tested parallel to the grain boundaries (building direction). This is in line with the general finding, that cohesion of grain boundaries in Fe–Al is weak and therefore separation at the grain boundary takes place more readily if the samples are loaded parallel to the grain boundaries. The SLM samples tested parallel to the grain boundaries show higher compressive flow stresses than the respective LMD samples. It is assumed that this is an effect of the higher residual stresses which according to the EBSD observation are higher in the SLM samples. Because of these residual stresses, all ALM-processed samples show a considerable higher compressive strength at intermediate temperatures than an as-cast alloy of about the same composition Reference Thijs, Verhaeghe, Craeghs, Van Humbeeck and Kruth26 (Fig. 10). The internal stresses are also the reason that the yield stress anomaly – an increase of strength at intermediate temperatures, which is a characteristic of Fe–Al alloys – is not any longer visible as a peak for the LMD and SLM samples tested perpendicular to the grain boundaries (Fig. 10).
σ0.2 compressive flow stress measured parallel to the building direction (vertical; parallel to grain boundaries) and perpendicular to the building direction (horizontal; perpendicular to grain boundaries). Data for as-cast Fe–26 at.% Al are shown for comparison. Reference Stein, Schneider and Frommeyer22

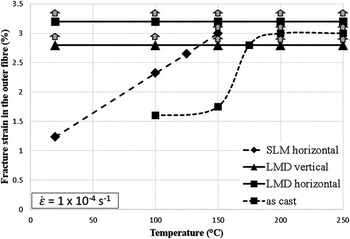
From four-point bending tests, the brittle-to-ductile transition has been evaluated. In contrast to most other intermetallic alloys, no marked BDTT is observed in case of binary Fe–Al alloys but a gradual change from brittle-to-ductile behavior within an extended temperature range. Reference Risanti, Deges, Falat, Kobayashi, Konrad, Palm, Pöter, Schneider, Stallybrass and Stein23 The residual stresses also influence the ductility of the alloy. While as-cast Fe–28 at.% Al is ductile at 150 °C, Reference Risanti, Deges, Falat, Kobayashi, Konrad, Palm, Pöter, Schneider, Stallybrass and Stein23 the SLM samples become ductile at 200 °C (tested parallel to the building direction). This increase may be attributed to the internal stresses in the SLM samples. If the thermal stresses are minimized by preheating the substrate to 200 °C, as in case of the LMD samples, then the samples are even ductile at room temperature (Fig. 11).
Fracture strain in the outer fiber determined by 4-point bending tests. Arrows indicate that the sample is ductile at test temperature.

IV. CONCLUSIONS
It has been shown that defect-free samples with densities >99.5% can be produced from Fe–Al powders by LMD and SLM. As in case of other intermetallic alloys, preheating of the substrate proved necessary to obtain defect-free samples. Preheating at 200 °C was sufficient to prevent cracking during cooling, i.e., a temperature which is substantially lower than in case of other intermetallic alloys.
Instead of fine-grained microstructures, which had been expected in view of the high cooling rates, elongated grains of several hundred micrometers in length grew in building direction. These grains show a continuous crystallographic misorientation of up to 20°. These misorientations are higher in case of the SLM samples due to a higher temperature gradient, a higher cooling rate, and therefore larger residual internal stresses.
The mechanical properties are highly influenced by the internal stresses due to the crystallographic misorientations. Up to 500 °C, the compressive flow stresses are much higher than for an as-cast alloy of the same composition. Due to the anisotropic microstructure, flow stresses are markedly higher when samples are tested perpendicular to the building direction because in this case the grain boundaries, which have a weak cohesion in Fe–Al, are also oriented perpendicular to the compressive load. Because of the high internal stresses in the SLM samples they only become ductile at a slightly higher temperature than an as-cast alloy of about the same composition, e.g., at 200 °C instead of 150 °C. However, if the internal stresses are minimized by preheating the substrate then in case of the LMD samples it has been shown that these are already ductile at room temperature. In general, hardness and strength (flow stress) are higher and ductility is lower for SLM samples than for LMD samples, which can be explained by the higher degree of crystallographic misorientation in the Fe–Al grains in the SLM samples.
ACKNOWLEDGMENTS
The authors would like to thank Mr. G. Bialkowski for EDM preparation of the samples and for performing the compression tests, Mr. B. Breitbach for XRD analysis, Mrs. I. Wossack for EPMA, Mr. D. Kurz for wet chemical analysis and Dr. F. Stein for DTA analysis. Powders used for this work were supplied by NANOVAL GmbH & Co. KG. Financial support from the German Ministry of Education and Research (BMBF) under grants 03X3574E/F is gratefully acknowledged.