I. INTRODUCTION
Among various noble metal catalysts, platinum (Pt)-based materials are of special importance owing to their superior catalytic activity toward processes like hydrogenation, Reference Yoon, Rousseau, Weber, Mei and Lercher1 electrode reactions in many types of fuel cells, Reference Sievers, Mueller, Quade, Steffen, Jakubith, Kruth and Brueser2–Reference Basri, Kamarudin, Daud, Yaakob and Kadhum4 metal-air batteries, Reference Cheng and Chen5 water electrolysis Reference Lee, Kwak, Lee, Lee and Park6 or sensor applications. Reference Rashid, Jun, Jung and Kim7 The activity of Pt can be improved by modification of its electronic, physical, and geometrical structures in presence of other elements. Reference Chen, Kuai and Geng8–Reference Jia, Su, Chen, Tan, Chen, Cao, Jiang, Xie and Zheng10 One of the most important in tuning the catalytic activity of Pt-based clusters is their size, shape, and the composition. Reference Nesselberger, Ashton, Meier, Katsounaros, Mayrhofer and Arenz11–Reference Toge, Yokono, Saito, Daimon, Tasaka and Inaba13 For bimetallic nanoparticles, three categories can be defined depending on the distribution of individual atoms, which are a core–shell, alloy, and heterostructures. Reference Bing, Liu, Zhang, Ghosh and Zhang14 Concerning the application of Pt-based catalysts, one of the most serious barriers for the large-scale production remains the prohibitive cost of highly Pt-loaded components. This will be critical for scaling-up electrodes for fuel cells and metal-air batteries. Generally, there are three ways to reduce the Pt content, which are (i) Pt electrodes with an expanded electrochemically active surface (Pt particles of nanosize), (ii) a partial substitution of Pt atoms with cheaper metals, such as transition metal Pt–M (M = Fe, Co, Ni, Cr, etc.) in alloy catalysts Reference Fang, Wanjala, Yin, Loukrakpam, Luo, Hu, Last and Zhang15–Reference Chen, Liang, Yang, Liu and Chen17 or (iii) designing so called the Pt-skin core–shell morphologies with Pt monolayer (PtML) deposited onto the surface of cheaper metal (e.g., transition metal). Reference Wang, Huang, Xiao, Ren, Chen, Wang, Abruña, Lu and Zhuang18–Reference Bele, Jovanovič, Pavlišič, Jozinović, Zorko, Rečnik, Chernyshova, Hočevar, Hodnik and Gaberšček20 Regardless of lowering the cost, such PtM clusters benefit in improved activity for electrochemical oxygen reduction in comparison to a pure Pt. Reference Li, Zhou, Li, Zhou, Zhou, Sun and Xin21–Reference Stamenkovic, Fowler, Mun, Wang, Ross, Lucas and Marković24 Although, the activity enhancement is accomplished, these types of bimetallic catalysts suffer from a poor durability under high positive potential and at low pH (as in case of cathodic conditions in proton exchange membrane (PEM) fuel cell). Reference Johns, Gaudet, Peterson, Miller, Stach, Kim, Balogh and Datye25 The dissolution of transition metals at operating cathode conditions significantly reduces durability of the catalyst. To minimize this effect, one of the most promising (although not the cheapest) will be the Pt-based alloy, e.g., PtPd. Palladium possesses similar electronic configuration and crystallographic features to Pt, Reference Lamy26 more importantly, the stability of Pd in acidic media is comparable to Pt. Reference Yang, Lee, Zhang, Zhou and Liu27,Reference Zhou, Shao, Qin, Chen, Wei and Yi28 The cost of palladium is about two times less than that of Pt since the Pd resources are more abundant. With respect to the activity of PtPd cluster, the enhancement of oxygen reduction process catalyzed by the PtPd alloy has been reported and demonstrated as so called electronic effect and related to the shifting of negative charge (electrons from Pd orbitals) toward the Pt. The negatively charged Pt atoms in PtPd cluster facilitate the dissociation of molecular oxygen on the Pt surface resulting in faster electrochemical reduction of oxygen atoms. Reference Li, Sun, Li, Sun, Su and Xin29,Reference Mayrhofer, Blizanac, Arenz, Stamenkovic, Ross and Markovic30
The most critical in tuning the PtPd particle size and shape are the preparation conditions, for this various approaches were proposed including the co-precipitation, impregnation, microemulsion, polyol, microwave-assisted polyol methods, and γ-irradiation. Reference Chan, Ding, Ren, Cheng and Tsang31–Reference Liu, Yu, Rusakova, Huang and Strasser34 Recent studies showed more sophisticated processes such as the ultrasound-mediated chemical reduction of Pt cation by borohydride, resulting in very small and uniform PtPd alloy clusters, Reference Golikand, Asgari and Lohrasbi35 or the two-step synthesis that relies on the electroless deposition of Pt onto Pd surface. Reference Beard, Van Zee and Monnier36 Also, very promising is a microwave-assisted solvothermal synthesis that takes advantage of both the microwave and solvothermal effects and delivers PtPd clusters with a high degree of alloying and controlled particle size. This process takes less than 15 min and does not require the postannealing in reducing atmosphere (which is an advantage in terms of energy savings), while delivering PtPd catalyst with significantly improved activity in comparison to the same formulation synthesized by the conventional method (e.g., borohydride reduction). Reference Beard, Van Zee and Monnier36 A very promising results (two and a half times better activity for oxygen reduction than the state-of-the-art Pt/C catalyst) are reported for PtPd nanodendrites consisting of a dense array of Pt branches on a Pd core. Reference Lim, Jiang, Camargo, Cho, Tao, Lu, Zhu and Xia37 Following this structure-related activity improvement, the carbon supported Pt-on-palladium bimetallic structures composed of ultra-small (3 nm) Pt particles that were decorated onto larger (5 nm) Pd surfaces Reference Peng and Yang38 showed better activity for electrochemical oxygen reduction. Also, these morphologies demonstrated a very good stability under operating cathode conditions. A Pt monolayer (PtML) deposited on a suitable metal nanocore also demonstrated excellent activity toward oxygen reduction reaction (ORR) at reduced total Pt loading. Reference Zhang, Lima, Shao, Sasaki, Wang, Hanson and Adzic39,Reference Sasaki, Wang, Naohara, Marinkovic, More, Inada and Adzic40 Although, all listed morphologies are promising with respect to catalytic activity, their electrochemical stability under cathode potentials in acidic electrolyte does not satisfy application demands. Regarding the oxygen reduction catalysis, the earliest research centered around reducing the metal particle size resulting in better Pt utilization and the reduction of overall cost of the fuel cell technology. Reference He, Desai, Brown and Bollepalli41 Soon after the stability investigations revealed that smaller metal particles undergo faster degradation, Reference Sheng, Chen, Vescovo and Shao-Horn42 owing to the accelerated metal dissolution, especially for the PtM (M = Cu, Ni, Co) clusters. Reference Chen, Gasteiger, Hayakawa, Tada and Shao-Horn43 The numerous research devoted to address this problem offers either cheaper low Pt loaded clusters (also with ultrasmall particle size to improve the Pt utilization), or more stable however expensive the Pt-plated membranes, Reference Choe, Kim, Shim, Lee and Tak44 or a very challenging from the synthesis point of view, the PtML core–shell structures. Reference Vukmirovic, Bliznakov, Sasaki, Wang and Adzic45 Unfortunately, both the nanosized catalyst and the metal-plated electrodes are not stable enough to consider the fuel cell technology as an affordable and reliable power source, especially for PEM fuel cell automotive applications.
This work aims to study PtPd clusters of bigger size and specific shape (“nanoflowers”) synthesized using chemical reduction of metal precursor in aqueous phase at low temperature. The proposed synthesis route is less toxic and is easy to scale up while generating significantly less organic waste in comparison to some methods discussed above. In our approach, we change the sequence of mixing of metal precursors to influence the particle size/shape/surface composition. The transmission electron microscopy (TEM) morphology observations will be correlated with the electrochemical activity and long term stability toward oxygen reduction. The cyclic voltammetry (CV) will be used to calculate the electrochemically active surface area (ECSA) using hydrogen under potential deposition method and the linear hydrodynamic voltammetry applied to Koutecky–Levich analysis will provide the necessary kinetic parameters, such as the exchange current density, mass activity, and Tafel parameters. Furthermore, the impedance spectroscopy will complement the degradation studies and will be correlated with interplay of the size, surface composition, and curvature to search for the morphology with desired electrochemical stability.
II. EXPERIMENTAL
A. Materials
Sodium tetrachloropalladate (Na2PdCl4, 98%), potassium tetrachloroplatinate (K2PtCl4, 98%), ascorbic acid (AA, 98%), potassium bromide (KBr, 99%) and Nafion® perfluorinated resin solution (5 wt%) and perchloric acid (HClO4, 67% analytical grade) were purchased from Sigma Aldrich, isopropyl alcohol (IPA, 99.5%) from Merck and cetyl-trimethylammonium bromide (CTAB, 98%) from Alfa Aesar. The commercial carbon black Vulcan XC-72R was supplied from Cabot Inc. All the solutions for the synthesis were prepared using ultrapure water (18 M Ohms). High purity nitrogen and oxygen (both 99.999%) were used for purging the electrolyte.
B. Characterization
TEM–energy-dispersive x-ray (EDX) observation were carried out using a high resolution transmission electron microscope JEOL JEM-3010 operating at 300 kV coupled with a x-ray analyzer Oxford. Electrochemical experiments were carried out on a Princeton Applied Research VersaSTAT MC potentiostat and an electrochemical cell containing a Pt counter electrode, Hg/HgSO4 (654 mV in saturated K2SO4) as a reference electrode and PtPd/C ink casted onto glassy carbon rotating disk electrode (Princeton Applied Research, RDE 0008) with a geometric area of 0.19635 cm2 as a working electrode. All electrochemical measurements were carried out in 0.1 M HClO4 purged with N2 or O2 for 30 min prior to experiments. Before casting, the glassy carbon disk of 0.5 cm diameter (PINE Instrument Company) was mechanically polished with 0.05 µm Al2O3 slurry (Cypress Systems, Inc.), then rinsed in deionized water, cleaned ultrasonically in ultrapure water for 5 min, followed by rinsing in ultrapure isopropanol and acetone. A standard ink containing PtPd/C catalyst powder (9 mg), 0.25 mL of water, and 2.25 mL of isopropyl alcohol was sonicated for 15 min and 12 µL of ink was deposited on RDE glassy carbon. 7 µL of diluted Nafion® solution (volumetric ratio of Nafion® to methanol was 1:100) was casted onto the catalyst layer and dried in ambient conditions. The electrochemical electrode conditioning was conducted by scanning potential from 50 to 1200 mV (versus standard hydrogen electrode) at the scan rate of 200 mV s−1 until reproducible voltammogram was obtained. The CV was applied to estimate the electrochemical active area of the metallic fraction by applying the hydrogen under-potential deposition method in a N2-purged 0.1 M HClO4 electrolyte in the potential range from 50 to 1200 mV and a scan rate of 50 mV s−1. The catalytic activity for oxygen reduction was investigated using linear scan voltammetry (LSV) applied to the rotating disk electrode in the potential range from 250 to 1200 mV with the scan rate of 5 mV s−1 and the rotation speed of 1600 rpm in O2-saturated electrolyte. A long-term stability test was performed by scanning potential from 50 to 1200 mV at 200 mV s−1 using electrolyte with an N2 blanket (typically 2000 CV scans without rotation of the electrode). The CV and LSV voltammograms were recorded after each degradation test and compared to the same scans for the fresh electrode. The degradation studies were carried out using the electrochemical impedance spectroscopy at the frequency range from 0.01 Hz to 100 kHz by applying the potential amplitude of 10 mV at the constant polarization of 508 mV for the fresh and degraded samples. The impedance modeling was carried out using ZView software (Scribner Association Inc.). All experiments were done at ambient temperature (20 °C).
C. Synthesis of PtPd catalytic clusters
In a typical synthesis route, 1 mL of a K2PtCl4 aqueous solution (5 ×·10−2 mol L−1) and 1 mL of Na2PdCl4 (5 ×·10−2 mol L−1) were mixed with 10 mL of aqueous solution CTAB surfactant (3 ×·10−2 mol L−1) and homogenized under sonication for 2 min. Then 10 mL of 0.1 mol L−1 ascorbic acid (reducing agent) was introduced and the solution was heated at 90 °C for 3.5 h under magnetic stirring (dark brown color of the reaction mixture indicated the colloidal metal formation). The reaction time was adjusted experimentally to generate particles with desired size; an extended time of reaction leads to a significant metal agglomeration. The PtPd cluster fabricated using this recipe is denoted as 30NP and is the control sample. Following the method proposed in literature Reference Huang, Li, Li, Zhou, Duan and Huang46 we studied the effect of KBr as a shape controlling agent and introduced 0.833 g of KBr to the mixture of Pt and Pd precursors (before adding the ascorbic acid reducing agent) following the same steps as for the control sample. The product generated in the presence of KBr was denoted as 60NP. In addition, we generated PtPd cluster in the presence of KBr shape controlling agent in two-step synthesis according to Ref. Reference Zhang, Jin, Wang, Li, Camargo, Kim, Yang, Xie and Xia47 where Pd seeds were first fabricated following the same procedures as for 60NP and the Pt precursor (K2PtCl4) was introduced allowing to generate second metal fraction (shell) over the Pd (the sample is denoted as 45NP). For the samples 45NP and 60NP, the synthesis was carried out for 17 h. This will give some indication with respect to the preference of the particle shape and composition (alloying/core–shell structure) on the catalytic activity and electrochemical stability. To generate a high surface area catalyst, bimetallic clusters were decorated on a commercial carbon black Vulcan XC72R. To accomplish PtPd–C with the 20 wt% of a total metal content, the stoichiometric amount of carbon was mixed with a suspension of PtPd clusters at pH 1 (adjusted by 2 M HCl) and left under magnetic stirring for 20 h. Afterward, the mixture was washed in ultrapure water under vacuum filtration and dried at 55 °C overnight.
III. RESULTS AND DISCUSSION
A. Materials characterization
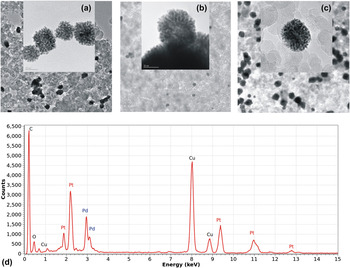
Figure 1 represents TEM images of nanoflowers supported on a high surface area carbon Vulcan XC72R (lower magnification image) and without carbon (high magnification inserts). Figure 1(a) shows catalyst synthesized without KBr and with simultaneous reduction of Pd and Pt metals (precursors mixed before the reduction is initiated, 30NP), Fig. 1(b) represents the sample generated in subsequent mixing of Pd and Pt in the presence of KBr (45NP) and in Fig. 1(c) nanoflowers were fabricated by simultaneous mixing of Pt, Pd, and KBr (60NP). An average size of metallic clusters decorated on carbon was estimated using ImageJ software giving the particle size distribution from at least 200 counts from the corresponding TEM image. Regarding the 30NP sample [Fig. 1(a)], the average particle size is 30 nm and the majority of particles have a square-like shape while other morphologies are rather spherical [Figs. 1(b) and 1(c) inserts]. We can easily recognize a difference in surface roughness for all structures. For instance, the sample 30NP in Fig. 1(a) shows a porous surface consisting of interconnected smaller Pt grains (∼3 nm size) decorated onto Pd core. The interesting is a compactness of the Pt “corona” that for 30NPs are less dense when comparing to other structures, especially sample 45NP [Fig. 1(b)]. Although, KBr was introduced for the synthesis of 45NPs, we predict that the extended synthesis time results in bigger grain size for 45NPs. The density of “corona” will be then also affected by the annealing time leading to more interconnected Pt structure for 45NP. A similar compactness is observed for the 60NP sample. Concerning the effect of KBr, we do not observe any significant structural differences except that both KBr-assisted syntheses deliver more dense (compact) nanoflowers. Comparable morphologies were recently reported by other group. Reference Fu, Wu, Lin, Tang, Chen, Zhou and Lu48
TEM image of (a) 30NP, (b) 45NP, (c) 60NP supported on carbon (low magnification) and without carbon (inserts) together with EDX spectrum [(d); an example for 45NP].

EDX elemental mapping of individual particles revealed the following compositions, for the sample 30NP [Fig. 1(a)] it is 60 wt% of Pt and to 40 wt% of Pd, for sample 45NP [Fig. 1(b)] it is 55 wt% Pd and 45 wt% Pt and for sample 60NP [Fig. 1(c)] it is 67.5 wt% Pd and 32.5 wt% of Pt. With respect to theoretically assumed composition of Pt to Pd (i.e., 1:1 weight ratio), the sample 45NP is the closest to the stoichiometric formulation. The difference in chemical composition for 30NPs and 60NPs is a result of the Pt precipitation, as confirmed by a spot-resolved EDX mapping [e.g., in Fig. 1(c), small individual particles of ∼5 nm size are composed of pure Pt]. The distribution of Pt and Pd atoms in a single particle according to EDX mapping (also example in Fig. S2) is included in a graphical abstract together with the corresponding TEM images of 30NP, 45NP, and 60 NP.
B. Electrochemical studies
1. ECSA and mass activity for oxygen reduction
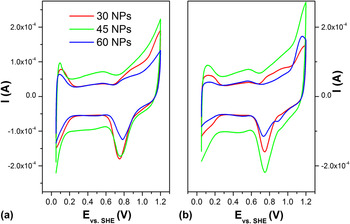
The ECSA of the catalysts was determined using hydrogen under potential deposition method. Reference Doña Rodríguez, Herrera Melián and Pérez Peña49 The charge of hydrogen monolayer adsorption/desorption on the metal surface was determined by the integration of relevant peaks identified in the potential range from 0.05 to 0.4 V in cyclic voltammograms (Fig. 2). The charge of hydrogen activity on PtPd is further calculated according to the Eq. (1): Reference Doña Rodríguez, Herrera Melián and Pérez Peña49
 $${Q_{\rm{H}}} = {{\int {idE} } \over \nu }\quad ,$$
where i is the current (A), E is the potential (V) and ν is the scan rate (in this study 20 mV s−1).
Cyclic voltammograms (a) for fresh catalyst and (b) after degradation.

Furthermore, the surface area (m2 g−1) was calculated by comparing the charge of hydrogen evolution (Q H) on in-house made catalysts to the theoretical charge of hydrogen adsorption on polycrystalline Pt (i.e., 2.1·× 10−4 C cm−2) Reference Doña Rodríguez, Herrera Melián and Pérez Peña49 and normalized to the total metal loading per geometric area of the working electrode:
 $${{\rm{ECSA}} = {1 \over {\left( {2.1 \times {{10}^{ - 4}}} \right)}}{{{Q_{\rm{H}}}} \over {{m_{\left( {{\rm{PdPt}}} \right)}}}}\quad ,}$$
where m(g) is the mass of PtPd on glassy carbon electrode and Q H = 2.1 ×·10−4 C cm−2 is the reference. Figure 2 represents voltammograms of all samples as-prepared (a) and after the degradation tests (b).
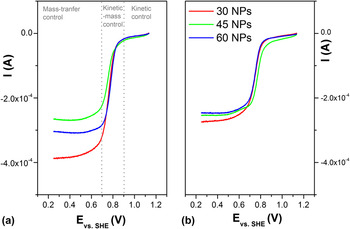
The mass activity for electrochemical oxygen reduction was analyzed using linear sweep voltammograms and corresponding mathematical models applied to rotating disk electrode (in our study the electrode rotation speed is 1600 rpm) in the range of 0.35–0.7 V, where the process is controlled by mass transport and it can be well resolved from a mixed mass-kinetic control (between 0.7 and 0.85 V) and pure kinetic region above 0.85 V (Figs. 3 and 4). The electrode rotation ensures fast convective transport of redox active species from bulk electrolyte to the electrode surface. Due to the complexity of morphologies, the mass activity i.e., kinetic current normalized to the metal load, A g−1, will be corrected as follows: Reference Ignaszak, Song, Zhu, Zhang, Bauer, Baker, Neburchilov, Ye and Campbell50
 $${{1 \over i} = {1 \over {{i_{\rm{d}}}}} + {1 \over {{i_{\rm{k}}}}}}\quad ,$$
where i is a total current density recorded in LSV (Fig. 3), i d is the diffusion (mass-transport) limited current density at 0.5 V and i k is the kinetic current density. Furthermore, the kinetic current is defined as:
 $${i_{\rm{k}}} = {{{i_{\rm{d}}} \times {i_{0.85}}} \over {{i_{\rm{d}}} - {i_{0.85}}}}\quad ,$$
where i 0.85 is the current density at 0.85 V, the mass-normalized (m PtPd) ORR activity will be:
 $${{i_{{\rm{mass}}}} = {{{i_{\rm{k}}}} \over {{m_{{\rm{PtPd}}}}}}\quad .}$$
Linear sweep voltammogram at electrode speed 1600 rpm for electrochemical oxygen reduction wave for (a) fresh and (b) degraded catalysts.

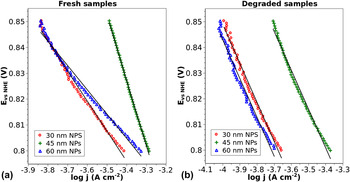
Tafel plots for 30NP (red), 45NP (green), and 60NP (blue) (a) as-prepared and (b) after degradation.

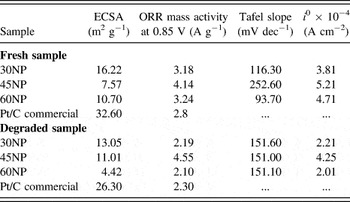
The calculated surface area and mass activities are summarized in Table I. In the potential range from 0.05 to 0.3 V, we observe weakly-resolved features of hydrogen adsorption on polycrystalline Pt (and Pd). The intensity of these broad waves depends on the particle size with general trend for bigger particles and smaller are peaks of hydrogen evolution (blue curve denoted to 60NP, sample with the biggest particles of 60 nm). Surprisingly, although the 45NP has an average particle size smaller than 60NP, the calculated surface area is lower for the fresh 45NP sample and significantly higher after degradation. This increase of ECSA for 45NPs after electrochemical aging is an effect of the surface cleaning from CTAB surfactant (i.e., leached out during the electrochemical cycling). The ECSA for all in-house made nanoflowers is similar to the reported for pure Pt catalyst with 30 nm particle size (i.e., 8 m2 g−1) Reference Mayrhofer, Blizanac, Arenz, Stamenkovic, Ross and Markovic30 and, as expected, lower than ECSA of the baseline (commercial Pt/C catalyst; Table I) due to a significant difference in metal particle size (Pt particle of 3–5 nm is typical for the commercial product). Although there are minor differences in the surface area for fresh samples, significant variations are observed during an accelerated degradation test. In this respect, the surface area lost caused by Pt dissolution Reference Vengrenovich, Ivanskii, Panko, Yarema, Kryvetskyi and Stasyk51 or metal agglomeration (also called Ostwald ripening Reference Vengrenovich, Ivanskii, Panko, Yarema, Kryvetskyi and Stasyk51 ) after long-term potential scanning up to 1.2 V. The ECSA results of degraded catalysts (Table I) revealed that the sample with the smallest particle size (30NP) has 19.5% of ECSA lost while the catalyst with 60 nm clusters (60NP) shows over 60% of ECSA lost under the same conditions. Regarding the size effect, we could expect the opposite since the electrochemical dissolution of Pt is faster for smaller particles. Reference Ahluwalia, Arisetty, Peng, Subbaraman, Wang, Kariuki, Myers, Mukundan, Borup and Polevaya52 Also, it is important to consider is that the process is determined by net competition between Pt dissolution and the surface passivation (in this case protection by PtO) with the general trend that bigger the particles are more PtO is generated on metallic surface (also PtOH, PtO2). Reference Ahluwalia, Arisetty, Peng, Subbaraman, Wang, Kariuki, Myers, Mukundan, Borup and Polevaya52 Therefore, the stability for samples 30NP and 60NP contradicts with the corresponding mechanism of cathodic Pt dissolution. Considering the nanoflower curvature, we could also expect that less “dense” 30NP structures should dissolve faster than 60NPs, which is not observed here. This again indicates that the degradation of in-house generated morphologies should be affected by other parameter, e.g., their chemical composition (in particular surface composition). Overall, for clusters synthesized in this work the morphology is not the critical factor (unless surface composition is the same for all samples), leading to the conclusion that faster degradation of 60NPs is associated with higher Pd content (in this case Pd:Pt = 67.5:32.5). That means the electrochemical dissolution proceeds faster due to the surface Pd anodic stripping at potentials as low as 0.8 V Reference Ye, Yang, Wang and Li53 (the most likely when comparing Pd content in 30NP and 60NP). Regarding the 45NPs (Pd:Pt = 50:50), surprisingly, these nanoflowers are the most stable as revealed by variations of ECSA (Table I). This can be due to the surface restructuring of the catalyst Reference Li, Wang, Strmcnik, Tripkovic, Sun, Kang, Chi, Snyder, van der Vliet, Tsai, Stamenkovic, Sun and Markovic54 upon polarization at low pH (in our case this might be the positive effect) or the electrochemical reduction of oxidized metal surface (generated during the synthesis as a result of long temperature dwell). Likely, it is the surface (not bulk) passivation and is a reversible process since the initial catalytic activity of 45NP is the highest that means the catalytic interface is activated as soon as an initial cleaning/conditioning step is completed (in our work carried out by CV). Furthermore, the ECSA stability of 45NP is associated with synthesis method, in this case the Pd seeds were generated first and acted as nucleation centers for the Pt atom (in other words, the Pt precursor was added to the colloidal Pd as indicated by light-brown color of reaction mixture). A spot-resolved elemental mapping confirmed a higher density of Pt atoms on the catalyst surface (Fig. S2). Such conditions favor the Pt–Pd alloying process in 45NPs (and were not generated for 30NP and 60NP). X-ray diffraction (XRD) studies and the lattice constant calculation (included into supporting information) however do not deliver meaningful information in this respect due to similarities of Pd and Pt crystallographic features. The relevant x-ray absorption near edge structure (XANES) or near edge x-ray absorption fine structure (NEXAFS) studies will provide important information regarding possible alloying, which is the subject of our future study. This exceptional stability of the 45NP must be then related to the mixing on atomic level (alloying), which stabilizes the bimetallic cluster.
Electrochemical surface area and kinetic parameters: mass activity, exchange current density, and the Tafel slope for 30NP, 45NP, 60NP samples together with the commercial Pt/C baseline.

The ECSA lost affects the catalytic activity as follows: the 30NP and 60NP showed significant decrease of the catalytic activity in comparison to 45NP. In addition, 45NP has the highest initial activity for oxygen reduction, which also indicates on PtPd alloy formation resulting in better ORR kinetics in comparison to pure Pt. Reference Li, Sun, Li, Sun, Su and Xin29 This catalytic activity improvement originates from so called an electronic effect and is associated with an electron distribution: Pt atom bears a negative charge while Pd is positively charged in PtPd clusters (electron shift from Pd orbitals to Pt orbitals). As the consequence, the negatively charged Pt atoms in PtPd facilitate the adsorption and dissociation of molecular oxygen on the Pt surface, resulting in faster reduction of atomic oxygen. Reference Li, Sun, Li, Sun, Su and Xin29 With respect to the mass activity and the stability achievement for 45NP case, we predict that Pd is fully protected by Pt atoms that block an access of oxidizing species to the catalytic sites of PtPd cluster (as proven by recent theoretical calculation—only two Pt atomic layers on the surface of other metal are necessary to prevent electrochemical leaching out Reference Escaño and Kasai55 ). By selecting a proper atomic-scale particle design, such Pt skin-type cluster will result in an improved oxygen reduction process (due to the Pt–Pd electronic interaction) and better electrochemical stability (from the protective Pt skin). This is presumably the atomic-level structure of 45NPs. This electronic effect due to Pt–Pd alloying in our cluster is particularly noticeable when comparing to pure Pt with 30 nm particle sizes supported on carbon. This reference system showed slightly higher mass activity at 0.85 V (i.e., 8.9 A g−1 Pt), Reference Mayrhofer, Blizanac, Arenz, Stamenkovic, Ross and Markovic30 however smaller the exchange current density, (i 0 = 1.37 × 10⁻⁴ A cm2) Reference Mayrhofer, Blizanac, Arenz, Stamenkovic, Ross and Markovic30 in comparison to PtPd nano-objects generated in this work (Table I).
C. Electro-kinetic studies
The electrochemical oxygen reduction is a multielectron process with a number of elementary steps, involving different reaction intermediates [Eqs. (6)–(10)]: Reference Song, Zhang and Zhang56
 $${{\rm{O}}_2} + ^* \to {{\rm{O}}_2}^*\quad ,$$
 $${{\rm{O}}_2}^* + {{\rm{H}}^ + } + {\rm{e}} \to {\rm{H}}{{\rm{O}}_2}^*\quad ,$$
 $${\rm{H}}{{\rm{O}}_2}^* + {{\rm{H}}^ + } + {\rm{e}} \to {{\rm{H}}_2}{\rm{O}} + {\rm{O}}^*\quad ,$$
 $${\rm{O}}^* + {{\rm{H}}^ + } + {\rm{e}} \to {\rm{OH}}^*\quad ,$$
 $${\rm{OH}}^* + {{\rm{H}}^ + } + {\rm{e}} \to {{\rm{H}}_2}{\rm{O}} + ^*\quad ,$$
where * represents the active site on Pt surface.
In the study of ORR kinetics, we define and assume that one single step is more sluggish than others, so that it controls the rate of overall reaction. In case of ORR, this rate-determining step (RDS) can be a heterogeneous electron transfer. The electrode potential can play a significant role in changing the Pt surface structure in the presence of O2 at higher potentials (>0.8 V); the electrode surface is a mixture of Pt and PtO, while at lower potentials the oxide-free surface is expected. Thus, the kinetics of O2 reduction on Pt will not be the same at different potentials.
The ORR exchange current density on a Pt electrode can be obtained by extrapolating the E = f[log(i)] plot along the Tafel line to the thermodynamic potential. Two Tafel slopes give two exchange current densities, one in the range of high potentials and second at low potentials. The values of the ORR exchange current densities on Pt reported in literature significantly vary, depending primarily on the morphology of the catalyst. On a Pt/PtO surface, the RDS is a pseudo 2-electron process, which gives a Tafel slope of 60 mV dec−1. However, on a pure Pt surface, the first electron transfer is the RDS, resulting in a Tafel slope of 120 mV dec−1. In our case, the Tafel slope is close to 120 mV dec−1 indicating a rate-limiting primary one electron transfer [Eq. (7)]. An initial higher value for the 45NP suggests some mass transfer influence, perhaps due to the surface cleaning/restructuring, although this did not affect the observed high mass activity of the fresh catalyst. The Tafel slopes for all samples remain on similar level after the degradation test revealing that the mechanism of ORR process did not change upon the degradation. More important is the kinetic parameter called exchange current density, i 0 (Table I):
 $$E = a + b \times \log \left| {{i^0}} \right|\quad .$$
Regardless the particle size, both fresh and degraded 45NP shows the highest value and is also consistent with best mass activity calculated at the kinetic regime (at 0.85 V; Table I). This suggests faster electron transfer rate due to possible alloying in PtPd clusters for 45NP sample. The activity enhancement that occurs for Pt-based alloys is explained by the change in electronic structure (the increased Pt d-band vacancy) or as the geometric effect (Pt–Pt interatomic distance as it is in PtCu). The populations of d-band vacancies can increase after alloying, generating a strong metal-O2 interaction, which, in consequence, weaken the O–O bonds. The corresponding kinetic studies of PtFe alloy catalyst show similar trend, although the reported Tafel slopes (∼120 mV dec−1) were close for both the Pt and PtFe, the exchange current density was much higher for alloyed PtFe system (several orders of magnitude higher). Reference Li, Wang, Wang, Miao, Wei, Yang, Yu and Bao57
D. Mass-transport studies by impedance spectroscopy
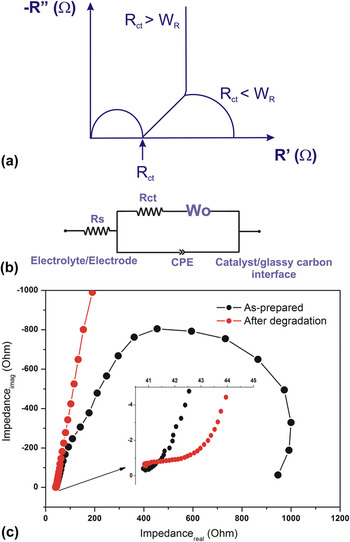
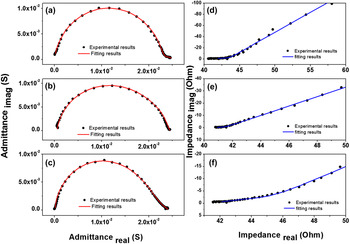
Electrochemical impedance spectroscopy was exclusively applied at the potential where mass-transport is predominant (onset potential of ORR peak) and at RDE rotation speed of 1600 rpm (this ensures the most effective transport of reactant to the electrode surface). Figure 5 represents the theoretical Nyquist diagram where the imaginary component of impedance (Z″) is plotted as function of real impedance (Z′) (a), together with an electrical equivalent circuit (b) and examples of experimental data for the fresh and degraded catalysts (c). The impedance plot is composed of a high frequency semicircle (beginning of impedance spectrum) corresponding to series of solution resistance (R s) and faradaic charge transfer resistance (R ct) in parallel with nonideal capacitors (CPE element). This arc defines the interfacial resistance of ORR. The linear part of spectrum with a slope of 45° starting at about 50 Ohms indicates that the mass-transport is predominant process at this potential, and, depending on the interplay between R ct and diffusion resistance (W o-R) values at low frequencies, it will generate the charge accumulation at the electrode–electrolyte interface (represented by straight line, capacitor) or as the resemble semicircle associated with the finite diffusion, as shown in Fig. 5. The electrical equivalent circuit presented in Fig. 5(b) was used for the fitting of experimental data (ZView software) and to calculate the numerical values of circuit elements. The model assumes that the electro-active film is a homogeneous structure, in which the macroscopic boundary between the film and the electrolyte plays a central role. In this view, ionic transport is modeled by means of diffusion along the composite bulk (without differentiation of metal, carbon and Nafion® fractions). The important generalization is that the shape of Nyquist plots of all samples remains either unchanged or is modified at lowest frequency from capacitive loop (straight line at 90°) to finite-length diffusion after degradation test (arc). This simplifies the subtraction of important numerical values of circuit elements. For clarity, Figs. 6(a)–6(c) represents admittance spectra of all samples together with fitting plots (in the admittance configuration kinetics and diffusion processes are graphically well separated in comparison to Nyquist plot in Fig. 5, keeping in mind that Y = 1/Z, the shape of admittance will be modified accordingly). The second part of Figs. 6(d)–6(f) represents a narrow frequency range corresponding to Warburg impedance that was analyzed to subtract important diffusion parameters. The total impedance defined by Eq. (12):
 $${Z_{\rm{t}}} = {R_{\rm{s}}} + {R_{{\rm{ct}}}} + {W_{\rm{o}}} + {1 \over {j\omega {{\left( {{\rm{CPE}}} \right)}_{{\rm{dl}}}}}}\quad ,$$
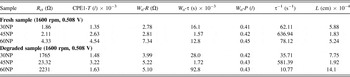
where Z t is a total impedance, R s is the solution resistance and can be also estimated graphically as the left (high frequency) intercept of semicircle (remains similar for all samples and unchanged after the degradation test), R ct is the charge transfer resistance and corresponds to the right intercept of semicircle presented in Fig. 5(a), W o is the diffusion (Warburg) resistor, j is the imaginary number, ω is the angular frequency and (CPE)dl is a nonideal capacitor of ion accumulation at the electrolyte–electrode interface in total. The numerical values of circuit elements are presented in Table II.
(a) Theoretical Nyquist plot, (b) electrical equivalent circuit and (c) impedance spectra of fresh (black) and degraded (red) sample recorded at 1600 rpm at 0.508 V.

Admittance spectra (a)–(c) and impedance with Warburg phenomena (d)–(f) recorded at 1600 rpm at 0.508 V. An experimental data (black scatter) are projected with fitting result (red and blue lines). The 60NP is represented in plots (a) and (d), 30NP (b) and (e) and 45NP (c) and (f).


With respect to the catalyst before degradation, the R ct associated with a rate of oxygen reduction is similar for 30NP and 45NP and bigger for 60NP (this is related to the chemical composition of the metallic clusters, smaller R ct is expected for the Pt-rich surfaces). At measured potential, the diffusion is a RDS and the number of electrons exchanged calculated by Levich equation is close to one [Eq. S1; calculation provided in supporting information], indicating that reactions 15 and 16 are predominant and the process is fully controlled by the rate of oxygen supply to the electrode surface in the multistep diffusion controlled process: Reference Song, Zhang and Zhang56
 $${{\rm{O}}_2} \to {{\rm{O}}_{2\left( {{\rm{ads}}} \right)}}\quad ,$$
 $${{\rm{O}}_{2\left( {{\rm{ads}}} \right)}} + {{\rm{e}}^ - } \to {\left[ {{{\rm{O}}_{2\left( {{\rm{ads}}} \right)}}} \right]^ - }\quad ,$$
 $${\left[ {{{\rm{O}}_{2\left( {{\rm{ads}}} \right)}}} \right]^ - } \to {{\rm{O}}_{2\left( {{\rm{ads}}} \right)}}^ - \quad ,$$
 $${{\rm{O}}_{2\left( {{\rm{ads}}} \right)}}^ - + {{\rm{H}}_2}{\rm{O}} \to {\rm{H}}{{\rm{O}}_{2\left( {{\rm{ads}}} \right)}} + {\rm{O}}{{\rm{H}}^ - }\quad ,$$
 $${\rm{H}}{{\rm{O}}_{2\left( {{\rm{ads}}} \right)}} + {{\rm{e}}^ - } \to {\rm{H}}{{\rm{O}}_{2\left( {{\rm{ads}}} \right)}}^ - \quad ,$$
 $${\rm{H}}{{\rm{O}}_{2\left( {{\rm{ads}}} \right)}}^ - \to {\rm{H}}{{\rm{O}}_2}^ - \quad .$$
Accordingly, for the electro-reduction of oxygen expressed as a multistep process using parallel reactions, the charge transfer rate at each step, R ct(i) (i = 1, 2, …,3), is determined as R ct(i) = n i ν i , where n i is the number of electrons exchange and ν i is the reaction rate at each step (mol cm−2 s−1).
Based on this assumption, Reference Otomo, Li, Kobayashi, Wen, Nagamoto and Takahashi58 it can be concluded that for the smallest R ct value the number of electrons exchanged (n) should be close to one for the reaction 14 (Table S1; supporting information). In the following section, the reaction rate constant will be evaluated from the mathematical models of diffusion resistance defined by: Reference Gabrielli, Keddam, Portail, Rousseau, Takenouti and Vivier59
 $${{W_{o}} = R{{{\rm{coth}}{{\left( {\,j\tau \omega } \right)}^P}} \over {{{\left( {\,j\tau \omega } \right)}^P}}}}\quad ,$$
where P is the dimensionless factor, τ represent the time constant associated with the potential-dependent evaluation of intermediates on Pt (in reactions 13–18) and is the function of the effective diffusion thickness, L, and the effective diffusion coefficient, D, according to: Reference Gabrielli, Keddam, Portail, Rousseau, Takenouti and Vivier59
 $${\tau = {{{L^2}} \over D}\quad .}$$
Thus, τ−1 (inverse coverage relaxation time) is equivalent to the first-order rate constant for the potential-dependent desorption of ORR intermediate. The relevant numerical values of all diffusion parameters are presented in Table II. With respect to the diffusion resistance, W o -R, all samples showed very similar and small value of the mass transport, which are close the charge transfer R ct, indicating that an accessibility of the reactant to/from the catalytic sites are comparable or, in other words, the morphological effects such as particles size, shape, and catalysts distribution on carbon support are not critical in this respect. Regarding the relaxation time constant, an interesting observation was that for the 45NPs the τ was almost one order of magnitude smaller than for other samples (also an effective diffusion thickness). The corresponding rate of surface recovery (τ−1, Table II) changes as follows: higher value of reaction rate constant is accomplished for shorter surface relaxation time, indicating that the surface recovery from reaction intermediates is faster. With correlation to the catalyst morphology, in particular the surface roughness (Fig. 1), we observe that 45NP is rather compact—this apparently delivers lower ECSA (Table I) in comparison to other catalysts. However, even with that the average diffusion thickness for the 45NPs is the smallest, thus the reaction rate constant is the highest and the relaxation time is the shortest. Thus, for 45NPs a stronger electronic effect on the O2 adsorption and dissociation from Pt–Pd alloying is expected. Reference Li, Sun, Li, Sun, Su and Xin29,Reference Mayrhofer, Blizanac, Arenz, Stamenkovic, Ross and Markovic30 In summary, from the analysis of diffusion parameters, we conclude that the mechanism of the mass transport is similar with some benefits for the 45NPs due to the presence of possible PtPd alloy clusters (although not discriminating with respect to ECSA).
Regarding the pseudo-capacitance, defined as: Reference Gabrielli, Keddam, Portail, Rousseau, Takenouti and Vivier59
 $${\rm{CPE}} = {T^{ - 1}}{\left( {j\omega } \right)^{ - P}}\quad ,$$
where T is the pseudo-capacitance (Farads) and P is the dimensionless factor (0 < P < 1, in this study in the range of 0.95–0.98), the values are very similar. Since pseudo-capacitance is directly related to the active surface area (ECSA) and thus to the size of bimetallic Pt–Pd clusters, this confirms previous observations that the particle size is not a critical factor in our study and complement the analysis of ECSA, which otherwise should be the smallest for sample of 60NPs size (Table I). As the conclusion, we observe that regardless the difference in particle size (thus in ECSA), the double-layer capacitance associated with nonfaradic processes during the electrode polarization is not discriminating parameter.
E. Electrochemical degradation
Concerning the degradation process, there are several mechanisms suggested to explain the electrochemical instability of Pt-based electrocatalysts. This aspect was discussed in details and supported by theoretical and experimental study. One of the most accepted is the submonolayer dissolution of Pt nanoparticles leading to the ECSA loss. Reference Shao-Horn, Sheng, Chen, Ferreira, Holby and Morgan60 This originates from the formation of Pt–O at the potential range of 0.9–1.2 V and further chemical dissolution of oxidized Pt (also supported by theoretical predictions Reference Darling and Meyers61 ). It is generally acknowledged that the specific ORR activity can be affected by the position of PtO reduction peak Reference Gasteiger, Kocha, Sompalli and Wagner62 (when PtO reduction peak is shifted toward positive potential it means the catalyst binds oxygen species more weakly and thus the specific ORR activity is higher). As observed in Fig. 3 (ORR LSV degraded), the PtO reduction peak for 45NPs appears at more positive potential after degradation, resulting in a stable mass activity and/or improved ECSA (Table I). This is again correlated with the electronic structure and d-band center of the catalyst surface that controls the adsorption of oxygen species. Reference Shao, Liu, Zhang and Adzic63 The introduction of Pd can alleviate the oxidation of catalyst, reduce its dissolution and finally improve the durability. Reference Zhou, Shao, Qin, Chen, Wei and Yi28 There are also other possible explanations, e.g., impact of particle size distribution on the degradation rate. Reference Holby, Sheng, Shao-Horn and Morgan64 This correlation states that larger particles are more stable due to lower Gibbs–Thomson energy Reference Holby, Sheng, Shao-Horn and Morgan64 therefore adding the Pd generates larger PtPd clusters in comparison to pure Pt, but without obvious deterioration of ORR activity. In summary, the 45NPs show the best electrochemical stability under accelerated degradation test (and again this indicates on some degree of Pt–Pd alloying). This is also confirmed by the stability of impedance parameters before and after degradation test (Table II). For 45NPs, there are almost no changes in R ct and Warburg parameters comparing to other samples that undergo rapid degradation (significant increase of R ct) and thus loss of mass activity (Table I).
The CPE-T remains unchanged after the accelerated electrochemical degradation, which indicates that morphological changes due to aging can be neglected, although ECSA drops for 30 and 60 nm PtPd catalysts. In summary, for the electrochemical stability the most important factors are the chemical composition of the catalysts surface (more Pt on the surface generates more stable catalyst that protects Pd from leaching out; the Pt and Pd atoms distribution was also confirmed by a spot-resolved EDX mapping, Fig. S2), the catalyst curvature and the degree of alloying.
IV. CONCLUSION
This work aims to synthesize PtPd “nanoflower” structures and to study the effect of particle size, the curvature, and possible alloying on the catalytic activity for the electrochemical oxygen reduction, electrochemical stability, the mass-transfer of redox active species toward the catalytic sites, and the electro-kinetics of ORR process. Regarding the ECSA, there is no influence of the cluster size in the range between 30 and 60 nm, but significant influence of curvature and the chemical composition of the catalyst surface. The best electrochemical activity was accomplished for 45 nm nanoflowers; owing to possible alloying that enhance the O2 adsorption and dissociation via so called an electronic effect. The electro-kinetic studies revealed the highest exchange current density for oxygen reduction process in this system, indicating on possible PtPd alloying for the 45NP cluster resulting in the kinetic current enhancement. The complementary impedance studies for the process controlled by mass-transport at 0.508 V demonstrated that 45NP sample has the shortest the effective diffusion length and the highest reaction rate constant among all morphologies, leading to the conclusion that the catalyst curvature favors the reactant transport to the catalytic active sites (for a fresh and degraded sample). In addition, the 45 nm-size nanoflower showed superior electrochemical stability that is believed to be the combined effect of alloying and the compactness of the structure. This cluster possesses the Pt-rich surface that protects underlying Pd atoms against leaching out at high potential and at low pH. For the remaining samples, Pd atoms are likely located near the surface, resulting in a rapid Pd dissolution under cathode operating conditions—this destabilize the entire structure. The charge transfer resistance R ct of the 45NP cluster remains very small after a long term degradation revealing outstanding stability of this catalyst owing to its rigid and active structure with Pt-skin (opposite, the R ct increased several orders of magnitude for 30NP and 60NP in the same degradation regime).
Supplementary Material
To view supplementary material for this article, please visit http://dx.doi.org/jmr.2015.212.
ACKNOWLEDGMENTS
We thank Dr. Stephanie Höppener for EDX mapping and Dr. Igor Perevyazko for his help and an access to a high speed centrifugation. This work was carried out with the financial support of Carl-Zeiss foundation (Germany).