Introduction
Visible light-driven catalytic reactions are an important way to solve environmental pollution and the energy crisis. In the photocatalytic process, light-harvesting and subsequent photogenerated charge-carrier transfers are the key processes to achieve efficient solar-energy conversion for a photocatalyst.Reference Dolgopolova and Shustova1 The design and fabrication of π-conjugated (interatomic interaction leads to π electron rearrangement) molecules-based solid-state nanocrystals enable superior capability of visible light capture and exciton diffusion and have gained increasing attention for applications in electronics, photonics, light-energy conversion, and catalysis.Reference Geng, Wang, Chen, Guan, Yang and Liu2,Reference Munir3 To this end, porphyrins, or so-called “pigments of life,” have become attractive building blocks.
Porphyrins have tunable and well understood π–π conjugated electronic structures and spectroscopic characteristics.Reference Zhang, Wang, Chen, Guo and Liu4 The self-assembled porphyrin nanocrystals with the conjugated π structure are expected to exhibit more complicated absorption and emission spectra than those of the monomers.Reference Sendt, Johnston, Hough, Crossley, Hush and Reimers5–Reference Li, Bai, Bai and Fan8 Self-assembly of porphyrins from molecular units into specific spatial arrangements facilitates their efficient working through a delocalized electron network. This is vital for achieving photofunctions in photovoltaic systems.Reference So, Beyzavi, Sawhney, Shekhah, Eddaoudi, Al-Juaid, Hupp and Farha9
Many porphyrin nanocrystal structures, including flowers, rods, tubes, and spheres have been synthesized through noncovalent interactions.Reference Liu, Xing, Chen, Shen, Yan, Zou, Ma, Möhwald and Yan10–Reference Zhao, Wang, Qiao, Wang, Guo, Yan and Huang15 Due to their rapid photo-induced charge separation and relatively slow charge recombination, the delocalized conjugated π structures of porphyrin nanocrystals have been extensively studied in electron-transfer processes to improve the photocatalytic activity.Reference Wang, Shi, Lin and Zhu16,Reference Vasilopoulou, Douvas, Georgiadou, Constantoudis, Davazoglou, Kennou, Palilis, Daphnomili, Coutsolelos and Argitis17 These porphyrin nanocrystals with well-defined structures benefit significantly from the improved photostability and light-harvesting properties from the ordered arrangement of porphyrin molecules. Interestingly, these materials exhibit size- and shape-dependent photocatalytic properties.
Porphyrin nanocrystals of various sizes and shapes have been prepared by controllable self-assembly, and their visible light catalytic properties have been well studied. This article summarizes recent research in the synthesis of porphyrin nanocrystals and the size and shape dependence of their photocatalytic performance. We discuss the intrinsic mechanisms of this dependency. Emphasis is placed on emerging strategies for improving visible light activity of porphyrin nanocrystals and for better understanding of the fundamental mechanisms. Finally, we summarize the basis for the design and preparation of visible-light photocatalysts using new porphyrins for organic small molecule assembly.
Photodegradation
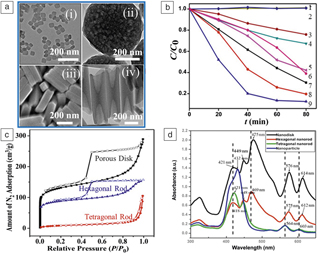
Porphyrin nanocrystals exhibit collective optical properties resulting from the coupling of the molecular porphyrins and their superior photocatalytic activity, because of the spatial ordering of porphyrins. As a common organic pollutant, methyl orange (MO) is easily soluble in water and its properties are stable. Because MO is difficult to degrade through traditional biodegradation methods, it is important to explore other alternatives such as photodegradation. The catalytic activity for photodegradation of MO was investigated in one study under visible light irradiation.Reference Zhong, Wang, Zhang, Wei, Wang, Lü, Bai, Wu, Haddad and Fan18 As shown in Figure 1a–b, all porphyrin nanocrystals exhibit enhanced optical properties, versus individual monomers, due to collective behaviors resulting from their assemblies, and all of these nanocrystals display photocatalytic activity for the photodegradation of MO. Tetragonal rods show the least photoactivity (Figure 1b, line 3), while nanodisks display high activity (Figure 1b, line 9). The photodegradation efficiencies of the organic pollutant reached above 90%, when nanodisks were used. The results show that the porphyrin nanocrystals have interesting size- and shape-dependent photocatalytic activity.Reference Zhong, Wang, Zhang, Wei, Wang, Lü, Bai, Wu, Haddad and Fan18–Reference Geng, Chen, Guan, Jiang, Xu, Di, Tu, Hao, Yi, Chen, Liu and Hu20
(a [i, ii, iv]) Representative transmission electron microscope images and (iii) scanning electron microscope image of porphyrin nanocrystals with different morphologies, including (i) nanoparticles, (ii) hexagonal porous nanodisks, (iii) tetragonal nanorods, and (iv) hexagonal nanorods. (b) Photocatalytic activities of porphyrin nanocrystals. Tetragonal nanorods with 200-nm length (line 3), same concentration zinc meso-tetra(4-pyridyl)porphyrin (ZnTPyP) in dimethylformamide (line 4), same concentration ZnTPP in 0.01 M HCl (line 5), nanoparticles with 80-nm diameter (line 6), hexagonal nanowires with 2-μm length (line 7), hexagonal rods with 400-nm length (line 8), and hexagonal porous nanodisks (line 9) for photodegradation of methyl orange (MO) molecules under visible light irradiation. The results from blank experiments, where no Zn porphyrin nanocrystals were used (line 1) and commercial P25 (line 2) was used, are also presented for comparison. Hexagonal porous nanodisks (line 9) is the best visible light catalyst. (c) Nitrogen sorption isotherms obtained at 77 K for different porphyrin nanocrystals. The nitrogen isotherms are characteristic of Type IV isotherms for the nanodisks and hexagonal rods with hysteresis. The tetragonal rods show Type I isotherms without apparent hysteresis. (d) UV–vis absorption of porphyrin nanocrystals with different morphologies. Absorption spectra of self-assembled nanocrystals display more complicated signals in comparison to those of individual ZnTPPs, which may be due to the coupling of a conjugated π−π structure from individual ZnTPPs within the ordered assemblies.Reference Zhong, Wang, Zhang, Wei, Wang, Lü, Bai, Wu, Haddad and Fan18 Note: C, concentration of light absorbing substance; C 0, initial concentration of light absorbing material; t, time; UV, ultraviolet.

The dependence of size, shape, and catalytic performance of these materials was determined using three structural aspects. First, as in most catalytic reactions, high activity specific surface area is crucial for a photocatalyst for enhanced catalytic performance. It is well known that the specific surface area is mainly dependent on the size and shape of the catalyst material, therefore, a different specific surface area is an important intrinsic factor for the dependence of size, shape, and performance. As shown in Figure 1c, the specific surface areas of porphyrin nanocrystals with different sizes and shapes are significantly different. The photodegradation performance for the organic pollutant of the tetragonal rods with the minimum pore surface area was the worst, while that of the nanodisk with the maximum pore surface area was the best. The performance of photocatalytic degradation of organic pollutants is thus positively correlated with specific surface area.Reference Zhong, Wang, Zhang, Wei, Wang, Lü, Bai, Wu, Haddad and Fan18
The second structural factor is the type of molecular aggregation. Previous studies on photodegradation of organic pollutants in porphyrin nanocrystals have shown that ordered molecular arrangement has better photodegradation performance than random molecular aggregation.Reference Guo, Chen, Ma and Liu21–Reference Mandal, Nayak, Mallampalli and Patra23 Disordered molecular accumulation of nanoparticles is detrimental for electron transfer and increases the probability of carrier recombination, resulting in poor photocatalytic performance. An ordered molecular arrangement can enhance electron transport and effectively inhibit charge recombination, which improves photocatalytic performance. Well-defined molecular arrangement of porphyrin nanocrystals can thus be more effective in photodegradation of organic pollutants.Reference Chen, Li, Huang, Wang and Kang24
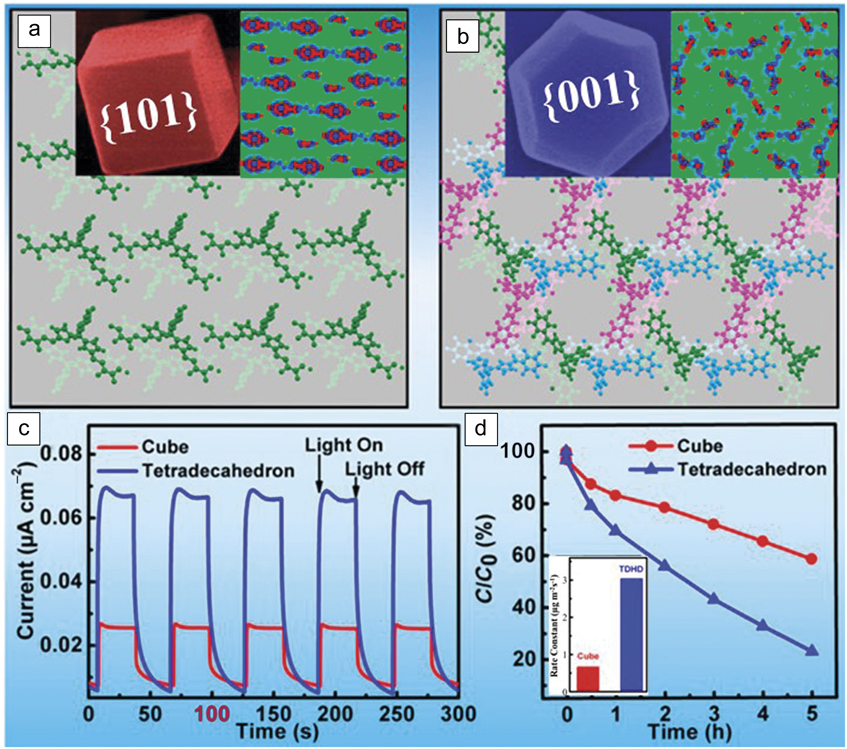
The third structural factor is an active crystal surface. The catalytic activity of different crystalline surfaces is different. Liu et al. have reported that catalytically active crystals of a porphyrin could be shaped into well-defined cubes and sheet-like tetradecahedrons. The cubes are exclusively enclosed by {101} and tetradecahedrons are predominantly enclosed by {001} facets (Figure 2a–b).Reference Geng, Chen, Guan, Jiang, Xu, Di, Tu, Hao, Yi, Chen, Liu and Hu20 The visible light catalytic degradation activity of sheet-like tetradecahedron porphyrin nanocrystals was greatly improved (Figure 2d). This shape-sensitive catalytic activity is attributed to the different spatial separation efficiency of photogenerated carriers on different crystalline surfaces (Figure 2c). Therefore, the size and shape of nanocrystals should be engineered for more catalytic active surfaces in order to enhance photocatalytic performance.
(a) Arrangement pattern of supramolecular chains on the (101) facet, which is exposed on the cubic structures, of the 5,10,15,20-tetrakis-(pentafluorophenyl)porphyrin (TPFPP). Selected-area electron diffraction and high-resolution transmission electron microscopy (not provided here) verify that the square surfaces of the cubes are enclosed by {101} planes. Inset shows (left) a scanning electron microscope (SEM) image of an individual cube. (Right) The different charge densities of the (101) facet were computed using the unit cell of the TPFPP single crystals, obtained from the experimental refined results, including nine TPFPP molecules. Red and blue colors represent obtained and lost electrons, respectively. (b) Arrangement of supramolecular chains on the (001) facet, exposed by the hexagonal faces of tetradecahedrons (TDHDs). The identical electronic couplings in the [010] (pink structures), [100] (blue structures), and [110] (green structures) directions of the {001} facets, resulting from their identical molecular packing, suggest a 2D multichannel charge carrier transport network. Inset shows (left) an SEM image of an individual TDHD. (Right) The different charge densities of the (001) facet were computed by using the unit cell of the TPFPP single crystals. Red and blue colors represent obtained and lost electrons, respectively. (c) Shape-sensitive electron–hole separation. For cubic structures, a comparatively smaller photocurrent response with weaker current intensity is observed (red curve), while a much stronger photocurrent response of a substantially boosted current intensity is detected from the TDHDs (blue curve). These observations validate the occurrence of a more efficient photo-induced electron−hole spatial separation in TDHDs. (d) Photocatalytic performance of cubes (red curve) and TDHDs (blue curve) toward bleaching of MOs and (inset) the corresponding histogram of the photoreaction rate constants. Compared to the cubes, TDHDs are superior photocatalysts, although both architectures have identical internal crystalline structures. Reprinted with permission from Reference Reference Geng, Chen, Guan, Jiang, Xu, Di, Tu, Hao, Yi, Chen, Liu and Hu20. © 2017, American Chemical Society. Note: C, concentration of light absorbing substance; C 0, initial concentration of light absorbing material; t, time; UV, ultraviolet.

Photocatalytic hydrogen evolution
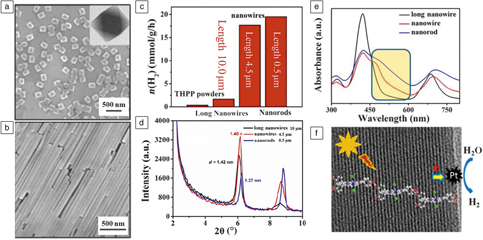
The size of porphyrin nanocrystals is an important factor in influencing photocatalytic hydrogen production. In one study, porphyrin nanowires of various sizes were prepared through noncovalent self-assembly.Reference Zhang, Wang, Wang, Cao, Wang, Bai and Fan25 As shown in Figure 3c, photocatalytic hydrogen generation experiments on porphyrin nanowires with different sizes were performed under visible light (wavelength, λ > 420 nm) irradiation. After 5 h of light irradiation, nanorods with a length of 0.50 μm exhibited a hydrogen evolution rate of 19.5 mmol/g/h. When the length of the nanowires was increased to 4.5 and 10 μm, the photocatalytic activity was reduced to 17.6 and 1.67 mmol/g/h, respectively. The results show that photocatalytic hydrogen production is closely related to the length of the nanowires. Self-assembly enables effective optical coupling of porphyrins, resulting in more enhanced optical absorption. The absorption bands red-shift to the more extensive visible light spectrum (Figure 3e). X-ray diffraction and transmission electron microscopy results revealed that these one-dimensional (1D) nanostructures contained stable single-crystalline structures with controlled interplanar separation distance; the interplanar distance of lattice fringes decreased from 1.42 to 1.37 nm when the lengths of the nanowires decreased from 10 to 0.50 μm (Figure 3d, f). Taken together, the 1D nanostructures consist of different internal spatial arrangements of 5,10,15,20-tetrakis(4-(hydroxyl)phenyl)porphyrin (THPP) molecules, resulting in different range and intensity of absorption spectra, which accounts for such interesting size-dependent photocatalytic hydrogen evolution activity.Reference Zhang, Wang, Wang, Cao, Wang, Bai and Fan25
Photocatalytic hydrogen production and characterizations of porphyrin powders and different self-assembled porphyrin nanostructures. (a, b) Morphology and structure of self-assembled porphyrin nano-octahedra and porphyrin nanowires, respectively. (a) A representative scanning electron microscope (SEM) image of the octahedra; inset shows corresponding transmission electron microscope (TEM) image of an octahedron. (b) A representative SEM image of nanowires. (c) Hydrogen evolution photocatalyzed by porphyrin powders and different self-assembled nanostructures. The hydrogen production performance of all self-assembled nanostructures is superior to that of porphyrin powders. (d) X-ray diffraction results of different porphyrin nanostructures. The interplanar distance of lattice fringes decreases from 1.42 to 1.37 nm when the lengths of the nanowires decrease from 10 to 0.50 μm. (e) UV–vis spectra of different self-assembled porphyrin nanostructures. The change in light absorption is pronounced within the wavelength range indicated by the rectangular box. The UV–vis absorption spectrum of nanorods with length of 0.50 μm covers a broad range from 400 to 750 nm and exhibited the strongest absorption intensity in the absorption region. (f) Schematic illustration of self-assembled J-aggregates and photoinduced charge process for hydrogen generation and TEM micrograph of nanowires. The nanowires were prepared using 0.5 mM THPP and 2.5 mM cetyltrimethylammonium bromide at a pH of 2.70 and stirred for 48 h. Note: chloride (green); nitrogen (blue); oxygen (red); carbon (gray). Reaction conditions: 4 mg of porphyrin nanowires loaded with 5 wt% of Pt co-catalyst; 0.2 M AA aqueous solution (50 mL); 1 N NaOH was used to adjust the solution pH to 4; 300 W Xe lamp with a 420-nm cutoff filter for 5 h.Reference Zhang, Wang, Wang, Cao, Wang, Bai and Fan25,Reference Wang, Zhong, Wang, Zhang, Cao, Bian, Alarid, Haddad, Bai and Fan26 Note: UV, ultraviolet; vis, visible; THPP, 5,10,15,20-tetrakis (4-(hydroxyl)phenyl) porphyrin; AA, ascorbic acid; n, molar amount; d, interplanar distance; θ, incident angle.

The shape of porphyrin nanocrystals is another important factor for photocatalytic hydrogen production. Depending on the kinetic conditions and types of surfactants used, well-defined 1D–3D morphologies such as nanowires, nano-octahedra, and hierarchically ordered internal architectures have been synthesized through a surfactant-assisted interfacial self-assembly process using optically active porphyrin as a functional building block (Figure 3a–b).Reference Wang, Zhong, Wang, Zhang, Cao, Bian, Alarid, Haddad, Bai and Fan26 Porphyrin nanocrystals showed interesting morphologically dependent photocatalytic hydrogen evolution activity under visible light (λ > 420 nm) irradiation. Porphyrin nanowires exhibited the highest hydrogen evolution rate, and hydrogen bubbles could be seen when light was irradiated for only 1 min. In comparison, the porphyrin nano-octahedra exhibited negligible photocatalytic activity. The nanowires showed no signs of corrosion in the structure after 15 cycles. The self-assembled porphyrin nanocrystals have geometrical constraints with a rigid aggregate framework, which would potentially prevent chemical attack by reactive species and ensure better stability. Ordered molecular assembly increases solar absorption due to the formation of aggregated frameworks, and the long axes of π–π stacks in the 1D nanocrystals have extensive delocalization and slow the charge recombination by stabilizing the electron-transfer products, which enhances the lifetime of an electron–hole pair.
Preparation of precious metals by photocatalytic reduction
Over the past few years, various well-defined porphyrin nanocrystals—nanospheres, nanosheets, nano-octahedra, and nanofibers—have been synthesized. Inspired by the photocatalytic role of porphyrin molecules in nature, porphyrin composite nanocrystals could facilely produce functional metallic nanoparticles on the surface of porphyrin nanocrystals under ambient conditions.Reference Zhong, Wang, Zhang, Bai, Wu, Haddad and Fan19 Several porphyrin-metal composite nanocrystals with well-defined shapes and dimensions have been successfully developed through a photocatalytically assisted self-metallization process.Reference Geng, Wang, Chen, Guan, Yang and Liu2,Reference Li, Bai, Bai and Fan8
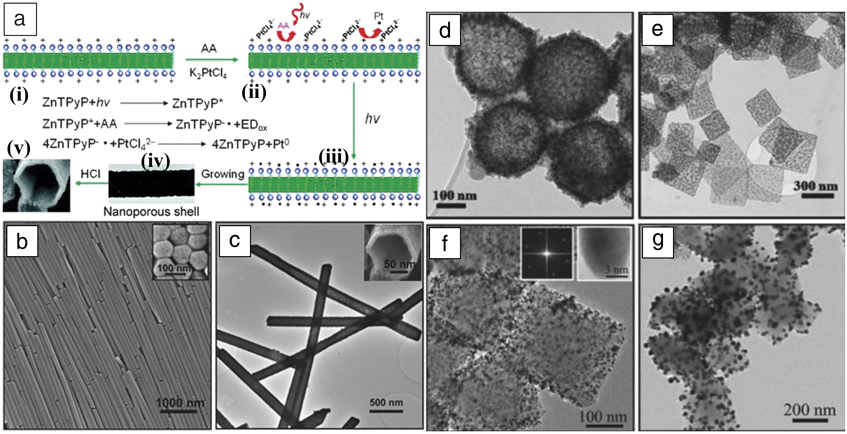
Through the photocatalytic reaction, metal precursors are initially reduced to form highly uniform metal nanoparticle seeds in the presence of light. A shell of metal nanoparticle networks is then formed at the surface of the photoactive porphyrin nanostructures as metal precursors are continuously reduced.Reference Bai, Sun, Wu, Haddad, Xiao and Fan27 Bai et al. have utilized these well-defined porphyrin nanostructures for the template synthesis of metal nanoparticles and networks via photocatalytic reduction of a metal-salt precursor based on this strategy.Reference Zhong, Wang, Zhang, Bai, Wu, Haddad and Fan19,Reference Bai, Sun, Wu, Haddad, Xiao and Fan27 Transmission electron microscopy results are shown in Figure 4 for the photocatalytic reduction of Pt using tin porphyrin nanospheres (Figure 4d) and nanosheets (Figure 4e) as templates, and of Pd (Figure 4f) and Ag (Figure 4g) using tin porphyrin octahedra as templates. Both transmission electron microscopy and x-ray diffraction data confirmed the formation of metal single crystals by virtue of the porphyrin assembly’s photocatalytic capability.
(a) Schematic of photocatalytic synthesis of porphyrin-metal composite and hollow metal nanostructures. (i) Synthesis of well-defined optically active porphyrin nanostructures by self-assembly. (ii) Introduction of metal precursor onto the porphyrin nanostructure surface. (iii) The photocatalytic reduction of the metal precursor by the porphyrin nanostructure is conducted under visible light in the presence of an electron donor (ED), ascorbic acid (AA). (iv) A shell of metal nanoparticle networks forms at the surface of the photoactive porphyrin nanostructures as metal precursors are continuously reduced. (v) The hollow Pt nanostructures are obtained by removing the porphyrin nanostructure templates. The blue spheres represent cetyltrimethylammonium bromide (CTAB) (b) SEM image of zinc meso-tetra(4-pyridyl)porphyrin (ZnTPyP) long wires that have hexagonal shape, as shown in the (inset) cross-sectional view. (c) TEM image of Pt nanotubes; the length of the Pt nanotubes ranges from 2.3 to 2.6 μm, consistent with that of the initial ZnTPyP wire templates. (Inset) High-resolution SEM image shows the hexagonal shape of a nanotube, which has uniform shell thickness of 15 ± 2 nm. (d) TEM images of Pt/tin porphyrin nanosphere composites. Single Pt nanoparticles are formed on the tin porphyrin nanosphere, ∼3.2 nm in size. (e) TEM image of Pt/tin porphyrin nanosheet composites. (f) TEM image of Pd/tin porphyrin octahedra composites; inset shows the (left) selected-area fast Fourier transform and (right) high-resolution TEM image; and (g) TEM micrograph of Ag/tin porphyrin octahedra composites.Reference Zhong, Wang, Zhang, Bai, Wu, Haddad and Fan19,Reference Bai, Sun, Wu, Haddad, Xiao and Fan27 Note: h, Planck’s constant; ν, frequency.

The photocatalytic reduction reaction mediated by porphyrin nanocrystals can be described for the reduction of metal precursor assisted by an electron donor (ED) by the following simplified cyclic reactions:
 $${\rm{Porphyrin}} + hv \to {\rm{Porphyri}}{{\rm{n}}^{\rm{*}}}$$,
 $${\rm{Porphyri}}{{\rm{n}}^*} + {\rm{ED}} \to {\rm{Porphyri}}{{\rm{n}}^{ - \cdot }} + {\rm{E}}{{\rm{D}}_{{\rm{ox}}}}$$,
 $$n{\rm{Porphyri}}{{\rm{n}}^{ - \cdot }} + {M^{n + }} \to n{\rm{Porphyrin}} + {M^0}$$,
where h and v are Planck’s constant and frequency of electromagnetic wave, respectively; Porphyrin*,  $${\rm{Porphyrin}}^{ - .} $$, n, EDox, M0, and Mn+ are the excited state porphyrin, anionic free radical state porphyrin, stoichiometric number of Porphyrin–., oxidized state electron donor, zero-valent metal, and metal with valence n, respectively.
A variety of well-defined hollow metal nanostructures have also been synthesized by removing the porphyrin assembly of these different shaped metal/porphyrin composite materials (Figure 4a–c).Reference Bai, Sun, Wu, Haddad, Xiao and Fan27 These well-defined hollow metal nanostructures possess an interconnected nanoporous framework as a shell with a high surface area for enhanced hydrogen adsorption and improved mass transport for electrocatalytic methanol oxidation.Reference Bai, Sun, Wu, Haddad, Xiao and Fan27 Furthermore, porphyrin-metal composite nanostructures have been demonstrated for photocatalytic hydrogen evolution.Reference Wang, Medforth and Shelnutt28,Reference Tian, Martin, Shelnutt, Evans, Busani, Miller, Medforth and Shelnutt29
Conclusion
We have summarized the synthesis of self-assembled porphyrin nanocrystals with controlled size and shape and 1D–3D dimensional structures as well as their size- and shape-dependent properties for light harvesting, photocatalytic synthesis, water splitting, and photodegradation. The dependence of size, shape, and catalytic performance has been discussed and determined mainly by three structural aspects: specific surface areas, molecular aggregation or molecular arrangement, and crystal facets. Design of future photocatalytic porphyrin nanocrystals requires critical understanding of the correlation of molecular arrangement, crystallographic characteristics, and surface area in order to improve photocatalytic performance.
Acknowledgments
This work was supported by the National Natural Science Foundation of China (21501045, 21771055, U1604139, and 21422102), Plan for Scientific Innovation Talent of Henan Province (No. 174200510019), and Program for Changjiang Scholars and Innovative Research Team in University (No. PCS IRT1126).

Qi Li is currently a lecturer in the Key Laboratory for Special Functional Materials of the Ministry of Education at Henan University, China. He received his BS degree in applied chemistry from Henan University of Technology, China, in 2008, his MS degree in physical chemistry from South China Normal University, China, in 2011, and his PhD degree in materials physics and chemistry from Sun Yat-sen University, China, in 2014. His current research focuses on developing advanced thin-film materials for photoelectric catalysis of carbon dioxide reduction, water decomposition, and biosensing. Li can be reached by email at nanokingdom@163.com.

Nana Zhao is currently pursuing her MS degree in chemistry at the Key Laboratory for Special Functional Materials of the Ministry of Education, Henan University, China. She received her BS degree in chemistry from Taiyuan Normal University, China, in 2017. Her research interests focus on electrochemical preparation and catalytic properties of porphyrin metal–organic framework films. Zhao can be reached by email at zhnanaer@163.com.

Feng Bai has been a professor in the Key Laboratory of Special Functional Materials of the Ministry of Education of China at Henan University, China, since 2010. He received his BS degree in chemistry in 2000, and his PhD degree in polymer chemistry and physics in 2005, both from Nankai University, China. He was a postdoctoral researcher in the Chemistry Department at Tsinghua University, China, followed by additional postdoctoral research at the Advanced Materials Laboratory of Sandia National Laboratories from 2007 to 2010. His current research focuses on the synthesis and self-assembly of nanomaterials, such as inorganic nanocrystals, block polymers, and porphyrins. Bai can be reached by email at baifengsun@126.com.