


On December 1, 1969, at the height of the Vietnam War, the United States’ existing military draft system—highly decentralized, deeply fragmented, and loosely directed by federal guidelines—was replaced by a new policy championed by President Richard Nixon. The centerpiece of the new policy was a national draft lottery, conducted with great ceremony on national television, in which draft numbers from 1 to 366 were randomly assigned to the 366 unique birth dates of draft-eligible men. These lottery numbers set the priority order for conscription under the new system, with low number holders designated as the first to be called up for duty.
In effect, the draft lottery was a natural experiment, randomly assigning young men's vulnerability to military service in an unpopular war. The learning of one's lottery status could be traumatic, stimulating strong emotional reactions and an abrupt rearrangement of life circumstances and perceptions of self-interest. As discussed in this article, these are precisely the conditions that theory suggests can kindle changes in political attitudes. Moreover, the recipients of these life-changing lottery treatments were young men of a politically impressionable age. The combination of these factors provided the rare potential for major transformations of political attitudes as a response to the actions of government.
This article focuses specifically on one uniquely vulnerable group—the cohort of college-educated young men around 22 years of age in 1969, who had been exempt from the draft through their college years and were now ready to pursue their civilian lives and careers. Until the adoption of the draft lottery, these young men were subject to the vagaries of their local draft boards. Then the rules changed, with the possibility of them getting drafted now determined by the random draw of their lottery number. Many of those with a low lottery number faced the unwanted prospect of getting drafted and being sent to Vietnam. Those with a high number were offered the chance to escape military service altogether. Others found themselves in an ambiguous in-between status. We ask, did these vulnerable men change their political attitudes—and, if so, for how long—as a function of their draft lottery number?
Exploiting a well-timed national survey—the Jennings-Niemi panel of 1965 high school seniors—we show that the political attitudes of this cohort's members changed in divergent ways as a function of their draft number. Whether they had a low (vulnerable) or high (safe) draft number not only affected their degree of support for the war, but also their basic partisan and ideological attitudes. The effects were enduring, lasting years and—in some instances—for decades, if not a lifetime. The depth and breadth of these changes reveal how powerfully citizens can react when government policy directly affects their lives. The government randomly reshuffled the self-interests among men in the targeted cohort, and the men shifted their politics accordingly.
Because the lottery outcomes were randomly assigned, Vietnam draft lottery status has been exploited before, most famously as an instrument for military service as it affects lifetime earnings and other socioeconomic outcomes (Angrist Reference Angrist1990, Reference Angrist1991; Hearst and Newman Reference Hearst and Newman1988). Here, as explained later, we treat lottery status as an instrument for vulnerability to being drafted into the military rather than as an instrument for military service itself. That is, it was the expectation of possible military service—triggered by the draft number—rather than the actuality of getting drafted (or not) that generated the attitude change.
The analysis proceeds as follows. The initial section discusses in further detail the working of the 1969 draft lottery and how it influenced the draft eligible. The second presents theoretical arguments for why one's draft number should have induced attitude change regarding the Vietnam War, situating the case within the literature on self-interest. We elaborate on how the lives of draft-eligible young men were affected by an adverse lottery draw even if they were not drafted into the military. The third section describes the Jennings-Niemi panel data, measures, and analytic strategies we use. The fourth documents the effect of lottery number on attitudes toward the war and presents evidence that these changes were stimulated by respondents’ draft status and not by whether they actually served in the military. The fifth section shows that lottery number influenced attitudes and behavior that are corollary to those toward the war, such as ideological identification and issue positions and—especially—vote choices in the 1972 presidential election. The sixth takes advantage of the panel data to examine how lottery status affected the continuity of political attitudes across the pre- to post-Vietnam era. Although those made safe from the draft generally continued their partisan inheritance in the typical fashion, the most draft-vulnerable respondents displayed a fluid change in party identification, as if they had rethought their partisanship anew. The seventh section shows that many effects we describe as valid (as of the 1973 panel wave) extended into the 1990s. The conclusion draws some implications for understanding political attitude change.
BACKGROUND ON THE DRAFT AND DRAFT LOTTERY
As of the end of 1965, a system of conscription was nominally in place, but the armed forces were almost entirely manned by volunteers. That changed with the escalation of the Vietnam War in 1966, just as the high school class of 1965 was reaching the age of draft eligibility (19 years).Footnote 1 For the next 3 years, call-up, exemption, and deferral decisions were made by local draft boards loosely operating under federal guidelines. As Baskir and Strauss (Reference Baskir and Strauss1978, 24) put it, “the four thousand draft boards developed four thousand very different policies.” Deferments of many forms were, in principle, available, the most common of which involved the existence of dependents, especially children, and the college student deferment, which required satisfactory academic performance and progress toward a degree. Older men within the 19- to 26-year-old age range were called up before younger, reducing the vulnerability to the draft faced by the class of 1965 in the war's early years.
With the expansion of the draft from 1966 to 1968 came the draft resistance movement and the growth of dissatisfaction with draft procedures among those not opposed to the draft itself. Blue ribbon commissions were set up to study Selective Service reform (e.g., Marshall Reference Marshall1967). Draft policies were tweaked through Executive Orders and new legislation. In 1967, for example, the deferment for graduate study was eliminated. The idea of a national draft lottery gained salience. The abolition of college student deferments was debated, in part as a response to the perceived low socioeconomic status (SES), nonwhite bias of the draft. At the same time, public opinion remained largely against the draft resisters and, until mid-1968, ambivalent about or in favor of the war.
Soon after taking office, in March 1969, President Nixon sent to Congress his plan for reform of the draft, which called for a national lottery, a continuation of the college student deferment, the creation of a 1-year window of maximum draft vulnerability, and a shift to prioritizing younger over older men within the 19- to 26-year-old range—with the important proviso that those with a deferment would have their year of maximum vulnerability begin whenever their deferment ended, if it ever did.Footnote 2 By the end of the year, the new system was in place. On December 1, 1969, on national television, lottery numbers (officially called “random sequence numbers” or RSNs) were assigned to birth dates by picking birth date−stamped capsules from an urn and numbering them, sequentially, from 1 and 366. The resulting numbers were to apply to potential draftees born between 1944 and 1950, which of course included the high school class of 1965.Footnote 3 Starting with the number 1, assigned to September 14, draft-eligible men would be called up to the extent required to fulfill military need.
Thus, as 1969 came to a close, nonexempted members of the class of 1965 faced a new draft regime, where their vulnerability to the draft was largely dictated by their draft number unless they could obtain and maintain a deferment. For those who had already taken advantage of the student deferment, the time in that refuge was running out. Those newly seeking out the college refuge would find it short lived because student deferments were ended in 1971. Even sooner to disappear were the “fatherhood” deferments, which President Nixon abolished by Executive Order in early 1970.Footnote 4 Lowering the stakes somewhat was the fact that forces were being gradually withdrawn from Vietnam and draft rates were on the decline. Yet, new draftees were increasingly sent to combat duty and casualty rates were high.
Over the ensuing 3 years, there was a good deal of uncertainty about just how high in the 1-to-366 sequence the draft call would go. The widely reported and repeated claim was that numbers in the lower third (1–122) were likely to be called, those in the top third (245–366) were unlikely to be called, and those in the middle third either would or would not be called depending on how the war progressed. Because induction requirements remained decentralized and local draft boards continued to oversee draft status classifications and call-ups, the lottery numbers actually called varied substantially across states and localities. In the first few postlottery months, some local boards went very high in calling up men for induction, something that Director of the Selective Service Curtis Tarr (Reference Tarr1981, 38) ruled as “contrary to the intent of the law” and that prompted the setting of national ceilings. The ceiling was set at 115 in April 1970, 145 in May, 170 in June and July, 195 for the rest of the 1970, and 125 for 1971 and 1972.Footnote 5
POLITICAL PSYCHOLOGY OF THE DRAFT LOTTERY THREAT
The primary pathway by which an adverse draft number could induce change attitudes toward the war is self-interest. Although self-interest effects have been notoriously elusive in public opinion research, the consensus is that strong self-interest effects are most likely when what is at stake is “1. visible, 2. tangible, 3. large, and 4. certain” (Citrin and Green Reference Citrin and Green1990, 18; see also Chong, Citrin, and Conley Reference Chong, Citrin and Conley2001; Green and Gerkin Reference Green and Gerkin1989; Sears and Funk Reference Sears, Funk and Mansbridge1990). Those with low draft numbers were facing a situation that would meet these four criteria handsomely—a (relatively) high likelihood of being forced to abandon all personal plans and undertakings and to take part in a potentially life-threatening war. As one's lottery number increased, one's vulnerability decreased. The potency of the self-interest motive would have been enhanced by the fact that the risk of losses, rather than of gains, was at issue (Cacioppo and Gardner Reference Cacioppo and Gardner1999; Mercer Reference Mercer2005).
Self-interest effects could have played out two ways. Those with lower lottery numbers were more likely to have been drafted or to have enlisted expecting call-up, and thus to have directly paid the costs of serving in the war (while nevertheless living to provide survey responses post war). In this case, the reasoning would be that low lottery number holders, having been dragged into military service, ended up more hostile to the Vietnam War than those who, holding high lottery numbers, escaped military service altogether. We consider the evidence for this mediating path in a later section.
However, simply facing the risk of being drafted, even if that possibility did not actually materialize, would have imposed direct and, in many cases, large costs on draft-eligible men. Studies focused on the draft and draft resistance have documented the psychological, material, and opportunity costs young men faced as they attempted to elude the draft (e.g., Baskir and Strauss Reference Baskir and Strauss1978; Foley Reference Foley2003). Stories from those made vulnerable to conscription due to the lottery likewise testify as to its disruptive consequences.Footnote 6 Low lottery number holders were required to report for preinduction physical examinations. Anxiety and fear were commonplace.Footnote 7 Employment opportunities for low lottery number holders were limited (Frank Reference Frank2007; Tarr Reference Tarr1981, 37). Future plans had to be put on hold, revised, or abandoned altogether (Mann and Dashiell Reference Mann and Dashiell1975). Attempts to elude the draft took time, energy, and financial resources. Thus, even if a low draft number did not actually result in military service, the negative personal consequences following from an unlucky lottery draw should have fueled opposition to the draft and to the war.
There is also an indirect path through which these lottery-induced circumstances may have come to shape political views. Feelings of fear and anxiety direct attention to the threatening stimulus and prompt learning (e.g., Cacioppo and Gardner Reference Cacioppo and Gardner1999; Marcus, Neuman, and MacKuen Reference Marcus, Neuman and MacKuen2000). Similarly, having a direct personal stake in an issue heightens the attention it receives (Krosnick Reference Krosnick1990; Lau, Brown, and Sears Reference Lau, Brown and Sears1978). Thus, the lottery should have prompted those who were most vulnerable to being drafted to pay greater attention to the war and the politics surrounding it. And, what anyone would learn when paying attention to the war in the postlottery period was that casualties were mounting, the war was going badly, and the majority of the public and many political elites had turned against it (Hallin Reference Hallin1984; Mueller Reference Mueller1973; Schuman Reference Schuman1972). Thus, greater opposition to the war among low lottery number holders could have emerged as an indirect consequence of information seeking sparked by vulnerability to the draft.
Evidence that draft lottery status affected attitudes toward the Vietnam War would in one sense speak to a void in the literature and in another sense challenge the received wisdom. Studies of opinions toward the Vietnam War have rarely considered draft status.Footnote 8 The only studies that looked explicitly at draft number and attitudes employed small convenience samples of college students holding deferments in the immediate postlottery period. Longino (Reference Longino1973) found more negative attitudes toward the war among those with low lottery numbers, but not to a statistically significant extent (see also Bergen Reference Bergen2009), whereas Apsler (Reference Apsler1972) found more disapproval of the draft. Yet, civilian attitudes toward (or related to) the war in Vietnam have been shown to be at best weakly related to self-interest indicators such as whether one has a family member or friend serving in Vietnam (Lau, Brown, and Sears Reference Lau, Brown and Sears1978; Mueller Reference Mueller1973). Indeed, Lau, Brown, and Sears (Reference Lau, Brown and Sears1978, 479) find “no evidence that the self-interested had distinctly self-serving attitudes toward the war.” As we will see, that is decidedly not the case here.
DATA AND MEASURES
Data Set
The data for this study come from the Jennings-Niemi Political Socialization Study initiated in 1965 by M. Kent Jennings and carried out by the University of Michigan's Survey Research Center and Center for Political Studies. The original core of the project consisted of interviews with a national sample of 1,669 high school seniors from the graduating class of 1965, distributed across 97 public and nonpublic schools chosen with probability proportionate to size (Jennings and Niemi Reference Jennings and Niemi1974, Appendix). From January to April 1973, 1,119 of the initial respondents were again interviewed in person, whereas an additional 229 who were too remotely located completed a self-administered questionnaire. The resulting N of 1,348 represents an unadjusted retention rate of 80.8%. Surveys were again conducted in 1982 and 1997, yielding completed interviews with a total of 935 individuals across all four waves of the study, for a four-wave unadjusted retention rate of 56%.Footnote 9 Almost all of our analysis works with data from the 1965–1973 panel file (ICPSR study 7779). However, we also make use of the four-wave panel in an examination of long-term draft lottery effects (ICPSR study 4037).
Of course, for the data from the Political Socialization Study to be usable for studying these effects, we need respondent dates of birth. Fortunately, these are available in the study's database. Lottery numbers were ascertained by linking birth data to the corresponding number signifying priority for being called into the army. The study is also rich in outcome measures. As described in more detail later, we make use of questions ascertaining opinions on the Vietnam War and other political issues, attitudes toward liberals and conservatives, evaluations of presidential candidates, presidential vote choice, and a measure of partisan political activity.
It might be thought that the Socialization Panel would be subject to appreciable mortality bias in that 1965 respondents with lower numbers may have either suffered as military casualties or been otherwise not interviewable due to their disappearance or desertion. Such a pattern could bias our results. For example, if having a low draft number caused antiwar attitudes and led to dropping out of the panel, the views of interviewed panelists with lower numbers would be distorted in a prowar direction. A panel mortality analysis, however, shows that low lottery number holders were not more likely to drop out of the study than were those with high lottery numbers. Differences in panel mortality by lottery number are slight and never statistically significant, regardless of whether the analysis is conducted using continuous or collapsed versions of the lottery number variable. And, low lottery number holders were actually slightly less likely, not more likely, than high lottery number holders to drop out of the panel.Footnote 10 Hence, differential panel mortality by lottery number appears to be a negligible issue for our study.
Sample(s) of Interest
Almost all of the Political Socialization Study's male panelists were born in 1948, thus making them ripe for the 1969 draft lottery. However, 42% had already entered military service by 1969. Of the remaining 58%, not all were subject to the 1969 draft lottery. Importantly, for those who did not go to college after their 1965 high school graduation, their fates regarding military service were mainly sealed by the time of the 1969 draft. By then, they had been drafted, voluntarily enlisted, found ineligible for service, or obtained a deferment classification that protected them from call-up except in extreme cases of military need (e.g., they were financially responsible for children). Thus, the noncollege segment of the cohort was essentially immune from the consequences of the 1969 draft lottery. Most tellingly, only 1 of the 70 respondents who lacked any college experience but were draft eligible in 1969 entered military service post draft. We set aside the noncollege, draft-eligible males other than as a control group unaffected by the draft.
In contrast, the military fate of those who spent the 1965–1969 period in college typically had been suspended by an educational deferment. Unlike preceding cohorts of college graduates, they could not continue their deferments by extending their education through graduate school. The implication is that the men who had not yet entered the military as of the time of the 1969 draft lottery and who had been in college for the first 4 years after high school are the group of the Socialization Study's respondents most likely to have been vulnerable to the effects of the new draft policy. Their deferments would have ended at about the same time as the 1969 lottery.
To identify those who likely spent 1965 to 1969 with an educational deferment, we use information from 1965 about whether the respondent was in a college preparatory track in high school, referring to those who were as “college bound.” The advantage of this indicator is that it is exogenous to events post-1965. Of course, we also have a measure of educational attainment (although not the year of college graduation) as of the 1973 survey. But this measure is endogenous to lottery number assignment and military service.Footnote 11
To ascertain whether respondents entered military service and, if so, the date of enlistment, we rely on respondent reports from 1973. We set the cutoff between pre- versus postlottery entry into military service as before 1969 versus 1969 and thereafter. Although including those who said they entered the military in 1969 undoubtedly adds a few cases where military service began before the lottery,Footnote 12 the only cost is the addition of a slight amount of noise. There should be no bias because respondents who enlisted before the lottery were unmotivated by the then-unknown lottery numbers. If we had limited our analysis to respondents entering the military in 1970 and later, we would have lost many cases. We would also introduce potential selection bias if respondents who entered the military in 1969 immediately after the lottery were omitted and these omitted respondents were different in important respects from respondents who entered later. For instance, early joiners after the lottery might have been more zealously prowar, whereas those who waited out their fate were more antiwar. If we exclude those who entered the military in 1969 we obtain similar results to what are reported later, although with the lower statistical power that comes with a lesser number of cases.
Our primary sample, then, is the set of 260 respondents who were college bound and not yet in military service as of 1969. We might expect heavy postdraft enrollment in the military among this set, particularly among those with draft numbers that made them theoretically eligible. Notably, however, despite the posited anxiety among our college-bound sample, surprisingly few—only 32%—actually ended up serving any military time. Most of these (74%) claimed to have voluntarily enlisted (perhaps preemptively) rather than being drafted. Among those with lottery numbers at or below 195, only 39% actually served, compared to 24% above.Footnote 13
It is important to stress that the relationship between actual military service and lottery number was not a step function at the cutoff value of 195. The probability of military service tends to vary little across the low lottery numbers and drop more steadily as one approaches the upper range. The smoothness of the relationship reflects the uncertainty at the time rather than our later knowledge of how the draft numbers played out. As discussed previously, men did not learn that 195 would be the cutoff until August 1970. Many enlisted preemptively in order to avoid an Army posting. Many with numbers at or below the 195 cutoff were not called because their local draft boards had filled their quotas with recruits holding still lower numbers. And, of course, many others were found unfit for military service.
Treatment Variable
Following Angrist (Reference Angrist1990, Reference Angrist1991), we could measure the treatment variable as a dichotomy based on the cutoff lottery number of 195. However, whereas Angrist was interested in creating an instrument for the presence or absence of military service, we are primarily interested in the draft as an instrument for perceived vulnerability to being called to military service. Consistent with the idea that attitudes are a function of lottery numbers rather than military service, the relationships we find between lottery number and attitudes are gradual slopes rather than step functions, as described in further detail later in the article. Accordingly, we measure the lottery number treatment as a continuous variable, ranging from 1 to 366—that is, the number first called to the one theoretically called last.
LOTTERY NUMBER AND VIETNAM ATTITUDES
The pivotal question that this article addresses is whether 1969 lottery numbers affected Vietnam attitudes in the 1973 survey. To measure Vietnam War attitudes, we construct a Vietnam Dove–Hawk index using items from the 1973 panel wave. The first component is the standard question of whether the war was a mistake. The measure has three possible scores: yes (Dove), in-between, and no (Hawk). The second is also a 3-point measure, derived from open-ended responses (in 1973) regarding what should have been done. Respondents were first asked:
“DO YOU THINK THE GOVERNMENT HANDLED THE VIETNAM WAR AS WELL AS IT COULD HAVE?” 1 = yes, 5 = no, others missing
Those who denied that the government handled the war well were then asked for up to two answers to the following question:
“WHAT DO YOU THINK THE GOVERNMENT SHOULD HAVE DONE?”
First mentions were coded dovish (codes 20–39) or hawkish (1–19). If the first mention was neither a Dove nor a Hawk response, then we scored their second mention. Those who failed to offer either a Dove response or a Hawk response were coded as in-between. The minority who responded to the first question by agreeing that the government handled the war “as well as it could have” were coded as Hawks.
We averaged the closed-ended “mistake” responses and the manufactured “what should we have done?” responses (each scaled 0–1) to create the Dove–Hawk index. The composite index had five possible responses. The scale ranges from 0 (war was a mistake, should have retreated) to 1 (war justified, no errors, or should have escalated).
Table 1 estimates the effect of lottery number on war attitudes using the Dove–Hawk scale. Four equations are presented, two for our draft-eligible, college-bound respondents, and for comparison, two more for the draft-eligible, non–college bound. For each group, we regress the Dove–Hawk index on lottery number (rescaled to range from 0 = lowest through 1 = highest), both in a bivariate equation and with controls for 1965 (high school) party identification and a four-item index of political attitudes, also from the 1965 survey wave.Footnote 14 We expect college-bound respondents with safe (high) lottery numbers to be the most hawkish post treatment. Little or no effect is anticipated for the non–college bound, for whom the matter of possible military service had usually been settled by 1969. The note to Table 1 also reports on the results of placebo tests considering lottery number effects among college-bound women. Because women were not eligible for the draft, once again we should find zero lottery number effects.
Effect of 1969 Lottery Number on Attitudes toward Vietnam War, 1973

Notes: The dependent variable is the composite Vietnam War attitude index, scaled to run from 0 (Dove) to 1 (Hawk). Lottery number is rescaled from 1 to 366 to 0 to 1. Entries are ordinary least squares (OLS) unstandardized coefficients. Robust standard errors (SEs), which take into account the clustering (by school) in the data, are shown in parentheses (see Nichols and Shaffer Reference Nichols and Shaffer2007). Cases are male respondents who had not served in the military as of 1969. “College bound” are those taking college preparatory courses in 1965. Placebo test results: Coefficients on lottery number for college-bound women are as follows: −0.00, p = 0.97 (bivariate, n = 295) and −0.01, p = 0.88 (multivariate, n = 290).
The results of Table 1 fulfill our expectations. For the college bound, the Dove–Hawk index of Vietnam attitudes shows a positive coefficient that is statistically significant beyond the 0.01 level. For the non–college bound, the coefficients are small, actually negative, and insignificant. Null results are uniformly evident for the placebo tests involving women.
The positive coefficients for the college bound were 0.24 in the bivariate case and 0.22 with controls. The implication is that the difference between holding the lowest and highest lottery number is about 20% to 25% along the Dove–Hawk continuum. Thus, we see a major attitudinal shift lasting as long as 3+ years (from late 1969 to 1973) in attitudes toward the war, with individual fates determined by the luck of the draw.Footnote 15
The parameter estimates for the control variables are also of interest. The non–college bounds’ 1973 Vietnam attitudes were shaped somewhat by their earlier party identifications, but not by their issue attitudes. For our presumably more sophisticated college bound, the pattern was the reverse. Their Vietnam attitudes were influenced somewhat by their earlier issue attitudes on a left–right scale, but not at all by their earlier party identifications.
Figure 1 presents the raw data for the bivariate relationship between lottery number and Dove–Hawk attitudes among the college bound.Footnote 16 Visual inspection shows that those with hawkish attitudes tended to be especially concentrated in the safe (high) lottery number ranges. The curve imposed on the graph is the LOWESSFootnote 17 curve predicting composite Vietnam attitudes from lottery number, based on the bivariate equation. Although there is some inevitable curvature to the estimate, the shape of the LOWESS regression suggests that the relationship between draft number and attitude is decidedly linear rather than a step function.Footnote 18
LOWESS Curve Displaying War Attitude as a Function of Draft Lottery Number: College Bound Only

Causal Process: Via Anticipation or Reality of Military Service?
Given the randomness of draft lottery assignments, we can be quite confident that the statistically significant relationship between lottery number and Vietnam attitudes was causal. But what was the causal mechanism? As described previously, one possibility is that it was a consequence of the lottery's impact on the probability of getting drafted, which proved traumatic and disruptive for low lottery number holders. A plausible rival hypothesis is that the response arose to the actuality rather than the expectation of military service. Consider that even if the lottery draw affected political attitudes initially, the final attitudinal resolution could have depended on whether the subject was actually compelled into military service. If some believed that their lottery number was “safe,” then their continued support for the war could have been conditional on escaping the draft. If others opposed the war because their draft number made them feel vulnerable, then their opposition might have evaporated once they passed their year of vulnerability without getting drafted. Why, we might ask, should initial reaction to the draft number trump the actuality of whether their lives were disrupted by military service?
Clearly, the draft number affected the likelihood of military service, and military service can affect political attitudes. One possibility is that the military service intervening variable works against the vulnerability hypothesis, with getting a low draft number leading to military service, which then caused hawkish views. However, the opposite is also possible—that getting a low number led to military service, which then produced alienation from the military and the war effort. In fact, we would suspect the latter to be more plausible because among those who entered the military in 1969 or later, the lower the lottery number, the more dissatisfaction with their military service,Footnote 19 and low lottery number has a strong adverse effect on feelings toward the military.Footnote 20 Thus, some of the effects we have observed for lottery number may be due to service itself rather than anticipation of military service.
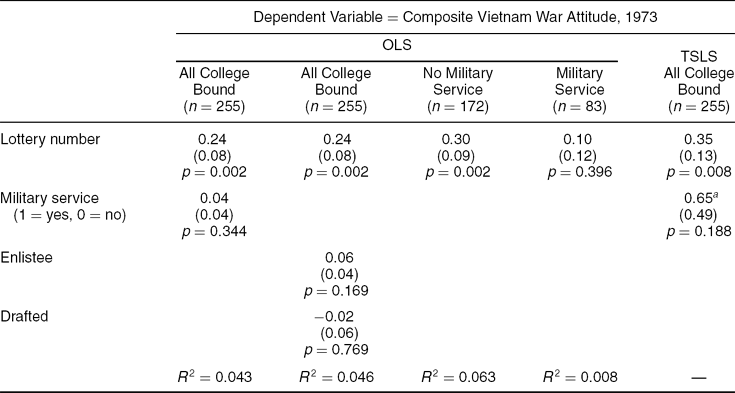
The obvious first test is to model 1973 Dove–Hawk attitudes as a function of both lottery number and military service. The hypothesized effect of military service would have it predict opposition to the war, which would show up as a negative coefficient. However, as the equation in the first column of Table 2 shows, the estimated military effect is positive, although trivial and insignificant. The “direct” impact of lottery number remains intact at about its original value. The second equation in Table 2 separates military service as either voluntary or involuntary, based on self-reports. Again, there is no military effect, not even from getting drafted. The third and fourth equations analyze the effect of lottery number separately for those who served and those who did not. The lottery coefficient actually increases among those who did not serve and drops for those who served, although the difference is not statistically significant. If real, this difference is readily explained if those who were more acceptant of military service were relatively indifferent to their lottery number fate, whereas those resistant to the idea of being called to duty were more affected than others by their lottery draw. Even if so, what is crucial here is that lottery number effects are strongly evident among those who never ended up serving, where military service as the mediating variable is not a possibility.Footnote 21
Evaluating Possible Mediating Role of Military Service: College Bound Only

Notes: All results for college-bound (those whose 1965 high school curriculum was college preparatory) males who did not enter military service prior to 1969. Standard errors are clustered standard errors. All variables are scaled 0 to 1.
a Instrument for Military Service is a 0-to-1 dichotomy, whether the draft number was 196 and above or 195 and below.
We might conclude from this that the lottery effect is all or almost all via the expectation rather than the actuality of military service. However, some caution is necessary. Unlike the random draw of a lottery number, whether one served in the military involves a degree of self-selection. Even though the originating independent variable (lottery number) is randomly assigned, separating out the direct effect from the indirect effect of mediating variables is not as clear-cut as it might appear.Footnote 22 The challenge is that the true effect of military service on attitudes might be biased from a possible reverse effect, whereby respondents who enlisted were more acceptant of the war. A biased estimate of the military effect would also bias the OLS estimate of the direct effect of the draft number. Undoubtedly, enlistments were driven to some degree by political attitudes—for example, enlistees scored higher on our conservatism scale from high school in 1965, although not to a statistically significant degree.
How serious is this possible bias? We conducted a sensitivity analysis to explore the plausible conditions under which serious bias would arise. We ask the following: What is the plausible range of downward bias to our OLS-based estimate of the military effect on war attitudes? And how seriously could this bias upward the presumed direct effect of lottery number?
Answering these questions requires that we evaluate the plausible causal chain from draft number to military service to Vietnam War attitudes. We know that the link from draft number to military service is weak. For our college-bound respondents, the actual impact of draft numbers on the likelihood of actual military service was slim and almost certainly less than our subjects expected at the time of the draft. As noted previously, the difference in the probability of serving for those with numbers at or below and those above the 195 ceiling is only 15 percentage points. Similarly, the differential “effect” on military service of having the lowest versus the highest number both via either a linear OLS model or a probit model is a probability differential of only 0.18. With the actuality of military service so weakly dependent on lottery number, the link from military service to attitude would have to be extremely large in order for the lottery effect to operate mainly via military service.
How large would this military effect have to be? Let us consider the hypothetical case where the direct effect of the lottery number on Vietnam War attitude is exactly half of our 0.24 estimate, with the other half via a direct military effect. With the direct effect cut to 0.12, the product of the lottery number effect on military service and the military service effect on Dove–Hawk attitudes would also be 0.12. For this to occur, the military effect on attitudes would need to be a stunningly negative −0.67, as if getting snared into military service caused our respondents to become more antiwar by moving two thirds of the range on the composite war scale (−0.18 × −0.67 = 0.12).
The unrealistic nature of such a large military effect on Vietnam attitudes is amplified when one considers that the observed correlation between military service and Vietnam attitudes is virtually zero. For the causal accounting to add up to a zero correlation, any negative effect of military service on support for the war would have to be balanced by an equal-sized positive effect of war attitude on military service. A large net effect both ways would require one set of college-bound military men joining the armed services against their will and then turning strongly against the war, whereas another set joins up out of extreme enthusiasm for the war. Any among our sample who wanted to select into the military had ample opportunity to join during the 4 years prior to the lottery. That, combined with the unpopularity of the war from 1969 to 1973, surely limits the magnitude of the hawkishness-driven selection effects on military service one would expect to be operating among recent college graduates exposed to the draft lottery.
Finally, we can leverage the fact that nobody with draft numbers over 195 should have been drafted. This allows a two-stage least squares (TSLS) analysis using as an instrument for military service whether the respondent's draft number was above or below the 195 cutoff. Being above or below the195 cutoff passes the test for plausible instrumental variables. It is not caused by Vietnam attitude and any independent effect on war attitude (controlling for lottery number) would be via military service.
The TSLS equation is shown in the final column of Table 2. Regressing war attitudes on lottery number and military service (proxied by being above or below the cutoff) yields a seemingly “large” but insignificant coefficient in the “wrong” direction, as if being called to military duty made one more prowar.Footnote 23 Meanwhile, the direct effect of draft number appears as strong as ever, with the coefficient even larger at 0.35. Thus, although the draft number, as a marker for the perceived likelihood of getting drafted in response to the 1969 draft, is related to Vietnam War attitudes, the actuality of getting called (instrumented by whether the draft number is above or below the cutoff) did not generate dovish attitudes.
To summarize, although involuntary military induction conceivably could have by itself turned some young men against the war, this effect could not have been large enough to challenge the thesis that the source of the lottery number effect was the disruption, uncertainty, and anxiety generated by the lottery number itself. If a large military effect had been present, then we would see a different pattern in the data. Instead, we conclude that it was how the lottery transformed one's vulnerability to military service—with the psychological, material, and opportunity costs entailed—that is behind the lottery effects we observe.Footnote 24 That such effects could be observed years later in the 1973 wave of the Political Socialization Survey testifies to the persistence of their impact.
LOTTERY NUMBER AND VOTE CHOICE, POLICY ATTITUDES, IDEOLOGY, AND PARTISANSHIP
We consider next whether the luck of the draw in the 1969 draft lottery had effects that extended beyond attitudes toward the war. When the lottery number affected men's Vietnam attitudes, did the alteration of views extend to related attitudes involving partisan choice, policy direction, political personalities, and vote choice? That is, did those with high numbers who became Hawks also become (for instance) more Republican and conservative, while those with low numbers who became Doves turned more Democratic and liberal?
There are several reasons to expect that lottery numbers also affected the liberalism-conservatism of the respondents and their voting behavior and participation in partisan activities. Dynamic attitudinal constraint could have been at work: As Vietnam attitudes were “experimentally” induced via lottery number, this change could have triggered other attitudes to become more consistent with Vietnam views. Being against the war might have by itself activated cognitions prompting citizens to turn liberal, vote Democratic, or identify with the Democratic Party. The agent of change could also have been social networks, as antiwar sentiments could have pushed people to associate with antiwar crowds and adopt their constellation of leftist attitudes. Changes in life circumstance prompted by a low draft number (e.g., problems finding employment) could also have been the immediate source of attitude change on a variety of fronts. Finally, the lottery number itself could have exerted an effect directly, as those unlucky enough to draw an adverse draft number could have simply blamed the president and his party for their plight, apart from any antiwar sentiment engendered.
To estimate these effects, our dependent variables include vote for president in 1972 (reported in 1973), relative Nixon-McGovern thermometer scores, an index of partisan political activity performed from 1970 to 1973, a three-item ideology index, an eight-item policy issue index (left–right), plus 1973 party identification. Vote was coded 0 for McGovern and 1 for Nixon. The remaining variables ranged continuously between 0 (liberal/Democratic) and 1 (conservative/Republican).Footnote 25
Table 3 shows the results, limited to the college bound. For each dependent variable, we present multivariate versions, adding our two exogenous control variables from the 1965 interviews: the four-item issue index and respondent party identification. The first column shows the probit equation predicting presidential vote choice in 1972 (as recalled in 1973).Footnote 26 Other results are estimated via OLS. With one prominent exception, they all show positive and significant or near significant effects.Footnote 27 Those whose lottery number made them vulnerable to the draft show a broad pattern of attitudinal and behavioral differences as of 1973—they were more likely to have rejected Nixon in the voting booth, to express attitudes that favored McGovern over Nixon, and to have participated in acts that showed that same partisan bias. They were also more likely to align themselves with the liberal rather than the conservative end of the ideological continuum, and tended to express more liberal attitudes on a wide array of issues.
Multivariate Analysis of 1972 Vote Choice, Presidential Candidate Evaluations, and Issue Attitudes: College Bound Only

Notes: Lottery number is rescaled from 1 to 366 to 0 to 1. The dependent variables are scaled to run from 0 (liberal/Democratic) to 1 (conservative/Republican). The vote choice equation was estimated with probit. Shown for that dependent variable is the estimated change in the probability of a Nixon vote if the X in question changed from 0 to 1, holding the other two Xs at their means. The p value is from the test on the probit coefficient. Probit coefficients and robust-clustered standard errors (SEs) for the three predictors, in turn, are 1.00 (0.35), 0.79 (0.23), and 1.11 (0.43). Entries shown for the other dependent variables are unstandardized coefficients from ordinary least squares (OLS), with robust-clustered SEs in parentheses. Cases are college-bound (those whose 1965 high school curriculum was college preparatory) male respondents who had not served in the military as of 1969. The probit pseudo R 2 is the McKelvay-Zavoina estimate of the proportion of the variance in the latent variable that is explained. Placebo test results: Coefficients on lottery number among college-bound women are vote: 0.02, p = 0.834; candidate ratings: −0.03, p = 0.370; partisan activity: 0.00, p = 0.988; issue index: −0.01, p = 0.851; ideology: −0.05, p = 0.231; and party ID: −0.02, p = 0.790. All dependent variables are measured in the 1973 panel wave.
For no dependent variable was the effect clearer than for reported vote in 1972. The probit equation predicting the vote reveals an average effect in terms of the probable vote of 38 percentage points as the differential from the lowest to the highest lottery number. Holding the other variables at their means, the projected percent voting for Nixon is 37% with lottery number 1 and 75% with number 366.
The exception is party identification. Although the party identification coefficient is positive (indicating those with safe numbers were more Republican), it does not achieve statistical significance.Footnote 28 We consider this exception in further depth later in the article.
Inclusion of the control variables allows us to compare the lottery number effects with the coefficients on prior predispositions. Perhaps the most interesting finding in this respect is the importance of issue attitudes from the high school years. An index based on attitudes toward school prayer, racial segregation, and the United Nations, plus tolerance of communists and atheists, dominates party identification as a predictor of the attitudes held 8 years later. In fact, for all variables except 1973 party identification, the respondent's 1965 party identification is statistically dominated by lottery score.Footnote 29 It is worth mulling this remarkable fact about these 25- and 26-year-old men in 1973, who had a college preparatory high school education. With their exposure to the 1969 draft and with an early adulthood spent during the turmoil of the Vietnam War years, their lottery number was a stronger influence on their political outlook than their late-childhood party identification.
DRAFT LOTTERY EFFECT AS A GENERAL POLITICAL SHOCK
So far, we have dealt with the draft number effect as a directional effect whereby getting a high or a low number induces specific changes in attitude or behavior. In addition, the draft lottery could have affected respondents by shocking the attitude structure, prompting the development of political views at odds with positions expressed in the past. After all, the young men subject to the draft were going through their early twenties, a life stage during which preadult political orientations are often revised in light of the new circumstances and experiences encountered in early adulthood (Sears Reference Sears, Wheeler and Shaver1983). This way of thinking focuses attention on how postlottery attitudes compare to those expressed before, with the expectation that the attitudes of those with low lottery numbers would have especially been transformed. Those with safe numbers could go about their business without rethinking their politics, whereas this may not have been true for those with low numbers who were confronted with potential life disruptions (or worse).
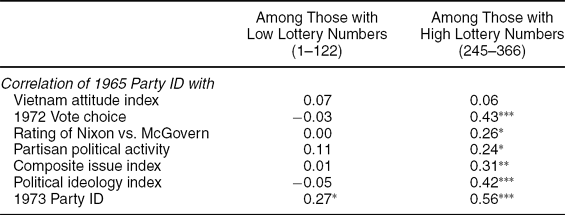
From such considerations, the general prediction is that getting a low (adverse) draft number leads to a lesser continuity of attitudes from the 1965 to the 1973 panel. Table 4 shows this expectation to be correct. It displays the correlation between 1965 party identification and each of the 1973 postdraft variables, calculated separately for those with draft numbers in the lowest third (most vulnerable) and for those with numbers in the top third (safest).
Correlation between 1965 Party Identification and 1973 Political Attitudes by Lottery Number: College Bound Only

Notes: Correlations were based on pairwise deletion of missing data. Cases are college-bound (those whose 1965 high school curriculum was college preparatory) male respondents who had not served in the military as of 1969. Ns ranged from 57 to 75 for the low lottery number group and from 60 to 84 for the high lottery number group.
*p < 0.05; **p < 0.01; ***p < 0.001.
Except for attitudes toward the war, prior partisanship is much more predictive of the 1973 attitudes of those holding safe lottery numbers than it is for those who were vulnerable to being drafted. In fact, among the vulnerable group, 1965 party ID is essentially uncorrelated with each of the 1973 variables except party ID. Meanwhile, those with relatively safe numbers show at least a modest degree of continuity in their 1965 to 1973 correlations. Thus, for example, the correlation between preadult party identification and the vote one cast in 1972 is −0.03 among those with adverse lottery numbers but 0.43 among those with safe ones. The most important difference is for party identification predicting itself. The over-time correlation for party identification (1965 vs. 1973) for the vulnerable group is less than half the size of that found for the safe group (0.27, p < .05 vs. 0.56, p < 0.001).
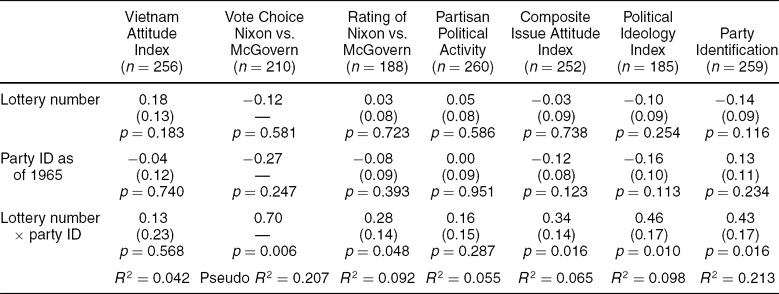
We see, then, that a low draft number had the consequence of upending prior party identification. The higher the draft number, the more party identification in 1973 resembled party identification from high school in 1965. As a secondary consequence, other attitudes in 1973 also became less tied to 1965 partisanship. Another way to see this is presented in Table 5. Here, we regress our 1973 variables (including party identification) on the 1965 party identification, lottery number, and interaction term representing the product of lottery number and 1965 party identification.
Interaction of Lottery Number and Prior Party Identification: College Bound Only

Notes: Lottery number is rescaled from 1 to 366 to 0 to 1. The dependent variables are scaled to run from 0 (liberal/Democratic) to 1 (conservative/Republican). The vote choice equation was estimated with probit. Shown for that dependent variable is the estimated change in the probability of a Nixon vote if the X in question changed from 0 to 1, holding the other two Xs at their means. The p value is from the test on the probit coefficient. Probit coefficients and robust-clustered standard errors (SEs) for the three predictors, in turn, are −0.33 (0.60), −0.71 (0.61), and 3.21 (1.18). Entries shown for the other dependent variables are unstandardized coefficients from ordinary least squares (OLS), with robust-clustered SEs in parentheses. Cases are college-bound (those whose 1965 high school curriculum was college preparatory) male respondents who had not served in the military as of 1969. The probit pseudo R 2 is the McKelvay-Zavoina estimate of the proportion of the variance in the latent variable that is explained.
As seen, the higher (safer) the lottery number, the more are 1973 attitudes affected by 1965 party identification. This pattern is seen in all of the results, although the interaction term is insignificant for war attitudes and partisan activity. Most tellingly, the additive coefficients for 1965 party identification tend toward estimates of zero effects. The straightforward interpretation is that, among the must vulnerable (zero on the interaction variable), 1965 party identification had virtually no relationship with future attitudes. The comparison for the least vulnerable (interaction term equals 1) is the addition of the party identification coefficient and the interaction coefficient. For 1973 party identification, the implied effect of lagged party identification from 1965 is a mere 0.13 with the lowest lottery number but 0.56 with the highest number (0.13 + 0.43).Footnote 30
The draft lottery spurred the most draft-vulnerable men to rethink their party identification, which resulted in new affiliations weakly tied to those expressed in the past. Consideration of the predicted values shows that much of the movement was from erstwhile Republicans, who, by 1973, had become decidedly more Democratic or Independent in their identification. Those with Democratic leanings in 1965, in contrast, tended to stick with those views, although they sometimes gravitated toward a more independent affiliation. A similar pattern holds when considering the other political attitudes expressed in 1973. The young men hurt by Nixon's policy who had left childhood with Republican leanings ended up more sympathetic to Democratic and liberal causes by their mid-twenties.
LONG-TERM EFFECTS
Our cohort of 1965 high school college-bound senior men faced their pivotal draft lottery in December 1969. The observed political responses are from early 1973. Because we believe the intervening causal variable was trauma and disruption (or relief) induced by the lottery number, we observed causal impacts approximately 3 years after the initial stimulus. As political attitude studies go, this is a long duration. Rarely do we study attitudinal change over a span of years.
We also have the means to study the possibility of the persistence of the effect over the course of a political lifetime. We refer, of course, to the opportunity to examine responses from the third (1982) and fourth (1997) waves of the study. Here, we offer a brief assessment of long-term effects. First, we examine the possible additive effects. Did getting a low lottery number lead to a persistence of antiwar sentiment, Democratic voting, and liberalism beyond 1973? We also examine the possible continuation of the shock effect, whereby low lottery numbers reduced the effects of preadult party identification. For draft-vulnerable respondents, was this shock temporary? Did their party identifications revert back to their earlier party identification, or did they carry forward based on their new (as of 1973) partisanship?
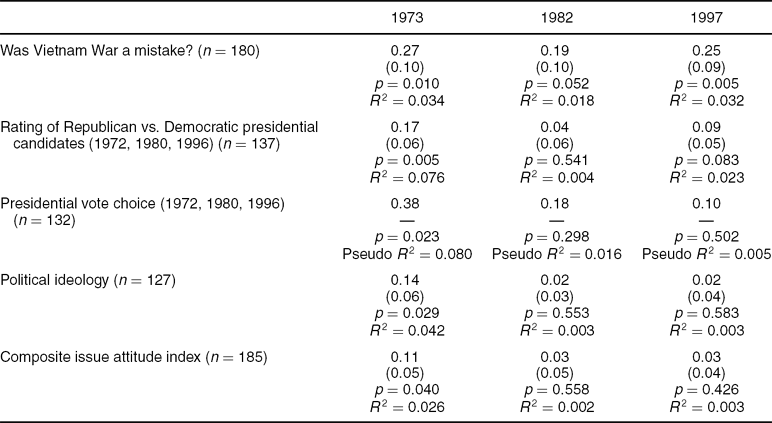
Table 6 is our guide for looking for the persistence of additive effects.Footnote 31 For each of the selected items shown in Table 6, the analysis is based on the constant set of respondents with responses in all three postlottery waves. In general, effects appear to fade. This is quite clear for political ideology and the composite issue index. The effects of lottery number on candidate evaluations and the vote, which were so prominent in 1972, also dissipate by 1980.Footnote 32
Long-term Additive Effects of 1969 Lottery Numbers on Political Attitudes: College Bound Only

Notes: Data are from the four-wave youth panel file. The dependent variables are scaled to run from 0 to 1, as described in footnote 31. Cases are college-bound (those whose 1965 high school curriculum was college preparatory) male respondents who had not served in the military as of 1969. The vote choice equations were estimated with probit. Shown for those dependent variables is the estimated change in the probability of a Republican vote as lottery number ranged from 1 to 366. The p value is from the test on the probit coefficient. Probit coefficients and robust-clustered standard errors (SEs) for the three vote-dependent variables, in turn, are 0.99 (0.44), 0.44 (0.43), and 0.25 (0.37). The probit pseudo R 2 is the McKelvay-Zavoina estimate of the proportion of the variance in the latent variable that is explained. Entries shown for the other dependent variables are unstandardized coefficients from ordinary least squares (OLS), with robust-clustered SEs in parentheses.
However, an exception is with the central variable itself—Vietnam attitude. Here, we use responses to the “mistake” question because that was asked in each postlottery wave. The lottery effect on responses to the question about Vietnam being a mistake maintains most of its initial magnitude into the 1990s. Even in 1997, 28 years after the precipitating event, the difference between the lowest and highest lottery number was about a quarter of the range of the Dove-Hawk scale. It seems, then, that some “immediate” effects (e.g., at least 3 years in duration) faded later in life. But the central attitude of our study—attitude toward the Vietnam War—remained shaped by the luck of the draw in 1969.
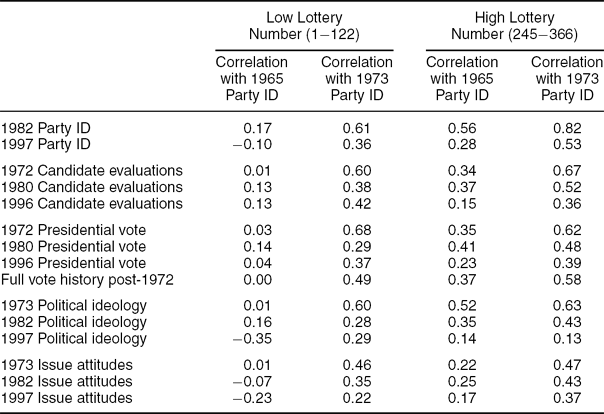
The clearest case of another draft number effect persisting into late adulthood is the continuing interaction effect between lottery number and 1965 party ID (i.e., the upending of preadult partisanship for respondents with low lottery numbers). We saw that by 1973, the most draft-vulnerable respondents were particularly prone to abandon their partisanship from high school. In later panel waves, they could have reverted to their 1965 partisanship, as if their draft-induced partisan conversions were temporary aberrations. However, they did not, instead sticking with their new (1973) party identifications.
As illustration, Table 7 displays the correlations between 1965 and 1973 party identifications, on the one hand, and our selected attitudinal measures, on the other hand. The first set of correlations presented is for the bottom third of lottery numbers (most vulnerable) with the second set for those in the top third (relatively safe). For those with low draft numbers, 1965 partisanship correlates at near zero with all the relevant indicators. For instance, 1965 party identification has no correlation whatsoever with the frequency of Democratic voting in presidential elections from 1976 to 1996. Meanwhile, those with high draft numbers show correlations between 1965 partisanship and variables measured later that, although they decay, are decidedly higher than those for the vulnerable group. Thus, 1965 high school partisanship retained some predictive power into middle age for those with safe lottery numbers, but not for those drawing adverse draft lottery numbers. For both groups, however, the new postdraft 1973 party identification predicts adult attitudes fairly well.
Correlation of 1965 and 1973 Party Identification with 1973, 1982, and 1997 Political Attitudes by Lottery Number: College Bound Only

Notes: Data are from the four-wave youth panel file. Cases are college-bound (those whose 1965 high school curriculum was college preparatory) male respondents who had not served in the military as of 1969. Respondents were 26, 35, and 50 years old in 1973, 1982, and 1997, respectively. Minimum cell entry = 41. Correlations greater than 0.30 are statistically significant at 0.05 or better.
To summarize, the effects of lottery numbers persisted long beyond their immediate impact on possible military service. It is remarkable enough that the effects persisted from 1969 to 1973 when the first postlottery survey wave was conducted. In the case of attitude toward the war itself, the effect of lottery status persisted into the 1990s, when the respondents were middle aged. Once initial 1965 party identifications were destabilized, as we saw from the 1965 to 1973 panel analysis, respondents stuck with their new partisanship rather than revert to 1965 values. A prominent effect of getting a poor outcome in the draft lottery was to cause reevaluations of party loyalties. And these revised loyalties persisted into later adulthood.
CONCLUSION
Political orientations typically begin to form in childhood, shaped through some mix of the socializing environment, genetics, and development of personality traits. Testifying to the importance of the preadult period are studies that demonstrate how the political views—and, especially, the partisanship—of the adult can be predicted by the views expressed during childhood (e.g., Jennings, Stoker, and Bowers Reference Jennings, Stoker and Bowers2009, Sears and Funk Reference Sears and Funk1999). Still, political orientations are often in flux as individuals move into and through early adulthood, a life stage that brings new adult-level experiences, social contexts, and social roles that have politically transformative potential. Our analysis of how the 1969 Vietnam draft lottery reoriented the political views of young men from the high school class of 1965 provides a striking example of how the actions of government can provoke a political transformation as well.
In 1969, a cohort of young, educated men, poised to seek their life's calling, instead faced the specter of being called to combat in Vietnam. Some got lucky, drawing high numbers that secured them from military service, whereas the unlucky faced the increased likelihood of risking their lives in a war many opposed. Equally important, those who drew numbers in the middle range faced, at minimum, a profound uncertainty and disruption of their lives. As we describe, this luck of the draw shaped attitudes toward the war and conventional party politics for a matter of years and, in some cases, evidently a lifetime. Those who were arbitrarily, albeit randomly, handed an adverse draft number tended to turn against the war and against the new draft policy's champion, President Richard Nixon, both in their political activity and in the votes they cast in 1972. They came to express more left-leaning policy views and ideological affiliations. In almost every comparison, lottery status outstrips preadult party identification in accounting for the political views draft-eligible men came to hold by their mid-twenties.
These changes in attitudes and behavior had far greater permanence than the short-term persuasion effects commonly reported from laboratory or survey experiments. The initial stimulus of the lottery draw occurred in December 1969. By the end of 1970 or 1971, whether the result was actual military service had been largely determined. The first set of interviews recording the responses was in 1973, still more than 1 year later. The impact of the life-changing lottery draw lasted long after the military consequences of the event were resolved. In the case of attitudes toward the war itself, the impact appeared to have lasted for about a quarter century more. On the question of whether the war was a mistake, those with lucky and unlucky numbers remained as divided at age 50 as they had been when in their mid-twenties.
The lottery draw also had a unique effect on the continuity of party identification. Those drawing unlucky numbers appeared to fundamentally reassess their orientation to the Democratic and Republican parties, with an adverse lottery draw obliterating the party attachments many held during high school, especially among erstwhile Republicans. For this unique group subject to a uniquely challenging life event, a basic rule of political socialization studies did not apply: Adolescent partisanship had no bearing on the partisan political attitudes expressed later in life.
This case serves as a striking example of the power of self-interest to disrupt and transform political views. The actions and policies of government are often dimly understood by citizens and seemingly disconnected from their personal lives. Policies become understood symbolically, with opinions shaped by general predispositions rather than self-interest (Sears Reference Sears, Iyengar and McGuire1993), and remain stable even when the policies shift (Soss and Schram Reference Soss and Schram2007). However, when the personal consequences of government policies become clear and concrete, self-interest does become engaged. Smokers come to hold very different views than nonsmokers on tobacco taxes and smoking regulations (Green and Gerkin Reference Green and Gerkin1989), property tax payers “revolt” when faced with tax increases (Sears and Citrin Reference Sears and Citrin1982), older Americans become especially strong advocates of policies directly benefitting the aged (Campbell Reference Campbell2003), and “not in my backyard” (NIMBY) behavior emerges in local communities (e.g., Steelman and Carmin Reference Steelman and Carmin1998).
As with these examples, the 1969 draft lottery had attitudinal consequences for young draft-eligible men because of how it directly affected their lives, with some left burdened and others relieved. The differences of opinion on the Vietnam War that emerged in the lottery's wake were not, however, driven by whether the young men were forced into or freed from actual military service. It was their relative vulnerability to being drafted that mattered, regardless of how the question of their military service actually turned out. Those with unlucky draws still paid psychological, material, and opportunity costs that those with lucky draws were able to escape.
But the case of the 1969 draft lottery is also different from the examples cited previously in which self-interest effects have been clearly identified. It provoked more than an opinion divide on a single issue or an issue-public in a single policy domain. Vulnerability to the draft induced by the 1969 lottery not only structured attitudes toward the Vietnam War, but also provoked a cascade of changes in basic partisan, ideological, and issue attitudes. The breadth, magnitude, and, in some respects, persistence of these attitudinal changes illustrates how powerful self-interest can become when public policies directly touch our lives.






Comments
No Comments have been published for this article.