




No CrossRef data available.
Biological sensitivity to context: II. Empirical explorations of an evolutionary–developmental theory
Published online by Cambridge University Press: 12 May 2005
Abstract
In two studies comprising 249 children and their families, the authors utilized secondary, exploratory data analyses to examine Boyce and Ellis' (this issue) evolutionary–developmental theory of biological sensitivity to context. The theory proposes that individual differences in stress reactivity constitute variation in susceptibility to environmental influence, both positive and negative, and that early childhood exposures to either highly protective or acutely stressful environments result in heightened reactivity. In Study 1, 127 3- to 5-year old children were concurrently assessed on levels of support/adversity in home and preschool environments and on cardiovascular reactivity to laboratory challenges. In Study 2, 122 children were prospectively assessed on familial stress in both infancy and preschool and on autonomic and adrenocortical reactivity to laboratory challenges at age 7. In both studies, a disproportionate number of children in supportive, low stress environments displayed high autonomic reactivity. Conversely, in Study 2, a relatively high proportion of children in very stressful environments showed evidence of heightened sympathetic and adrenocortical reactivity. Consistent with the evolutionary–developmental theory, the exploratory analyses also generated the testable hypothesis that relations between levels of childhood support/adversity and the magnitude of stress reactivity are curvilinear, with children from moderately stressful environments displaying the lowest reactivity levels in both studies.
The research on which this paper was based was supported by grants from the John D. and Catherine T. MacArthur Foundation's Research Network on Psychopathology and Development, the National Institute of Child Health and Human Development (1RO1 HD 24718), and the National Institute of Mental Health (R01-MH44340 and P50-MH53524). We thank Jay Belsky and David Bjorklund for comments on an earlier draft of this paper.
Information
- Type
- Research Article
- Information
- Copyright
- © 2005 Cambridge University Press
Biological reactivity to laboratory challenges and to naturally occurring stressors appears to be a robust, replicable phenomenon in both human and nonhuman primates. Such reactivity involves a set of complex, highly orchestrated responses within the neural circuitry of the brain and within peripheral neuroendocrine pathways regulating metabolic, immunologic, and other physiological functions. Broad individual differences in stress reactivity have been documented in a wide range of mammalian species (Cacioppo, Berntson, Sheridan, & McClintock, 2000; McEwen, 2000; Meaney, 2001; Suomi, 1997). As reviewed by Boyce and Ellis (2005), several important conclusions about the origins of individual differences in stress reactivity have emerged from the human and animal literature. First, both genetic and environmental factors contribute to the calibration of the major stress response systems, the corticotropin-releasing hormone (CRH) system and the locus coeruleus–norepinephrine (LC-NE) system, over the course of early development (see, e.g., Higley, Thompson, Champoux, Goldman, Hasert, Kraemer, Scanlan, Suomi, & Linnoila, 1993). Second, stable individual differences in these systems emerge with maturation, with a subset of both human (Cacioppo et al., 2000) and nonhuman primate (Suomi, 1997) populations showing extreme or prolonged activation of one or both systems. Third, there is pronounced early plasticity in the neurobiological mechanisms that underpin the development of the CRH and LC-NE systems, and aspects of early experience, particularly parent–child experiences, appear to play a central role in the calibration of stress responses (Hofer, 1994; Meaney, 2001).
A central function of the CRH and LC-NE systems is to prepare for and help neutralize external threats. These systems subserve a complex, highly interactive repertoire of central and peripheral stress responses, which mobilize neurobiological resources in defense of the organism's integrity and well-being. This elaborate and tightly integrated set of responses results in an immediate, relatively automatic shift to a state of biological and behavioral preparedness, involving increases in heart rate (HR) and blood pressure, metabolic mobilization of cellular nutrients, preferential redirection of energy sources and perfusion to the brain, and the induction of behavioral vigilance and fear (Chrousos, 1998; Gold, Goodwin, & Chrousos, 1988). High biological reactivity, in which affected individuals mount vigorous and/or persistent autonomic, adrenocortical, or other biological responses to stressors, lowers thresholds for anticipating threat in new unfamiliar situations and supports greater vigilance and wariness. Despite these homeostatic properties, the CRH and LC-NE systems together constitute primary integrative pathways through which environmental stressors are transmuted into the behavioral, autonomic, and immunological manifestations of human pathology (McEwen, 1998, 2000). As such, exaggerated stress reactivity has been conventionally viewed as a maladaptive, monotonically harmful legacy of an evolved preparedness for threat.
This conventional view has been challenged, however, by a growing number of studies revealing that high reactivity phenotypes under specific environmental conditions may be associated with protective, rather than harmful, effects and may generate normative or improved health outcomes. As reviewed by Boyce and Ellis (2005), highly reactive children, in comparison with their more normatively reactive peers, sustain elevated rates of disease, disorder, and injuries under conditions of adversity, but diminished rates under conditions of support and stability. These bivalent, context-dependent effects on psychopathology and health implicate stress reactivity in susceptibility to both harmful and protective environmental influences and suggest that stress response systems not only increase awareness of and readiness for danger, but also enable children to experience and incorporate more fully the beneficial, protective features of their environments. Perhaps the most striking illustration of this context sensitivity comes from the work of Suomi and colleagues, examining interactions between genotype and early environment in the prediction of phenotypic behavioral variation. In one such study (Suomi, 1997), rhesus macaques were selectively bred for either high or average levels of stress reactivity and then cross-fostered to either highly skilled, nurturing mothers or to merely average mothers. The highly reactive infants fostered to nurturing mothers had the best developmental outcomes of the group (e.g., developmental precocity, behavioral resilience to psychosocial stressors, ascension within the group's dominance hierarchy), whereas the highly reactive infants fostered to average mothers had the worst outcomes. Intermediate between these two extremes were the infants that were bred for average reactivity: their developmental outcomes differed little across the two mothering conditions. Remarkably similar results have derived from studies on genotypic variation in the serotonin transporter gene-linked polymorphic region in interaction with experimental variation in early rearing experiences (Barr, Newman, Becker, Parker, Champoux, Lesch, Goldman, Suomi, & Higley, 2003; Barr, Newman, Lindell, Shannon, Champoux, Lesch, Suomi, Goldman, & Higley, 2004; Bennett, Lesch, Heils, Long, Lorenz, Shoaf, Champoux, Suomi, Linnoila, & Higley, 2002).
Based on these Reactivity × Context interactions, we propose that heightened reactivity within each stress response system is reflective of a more elemental biological predisposition to context responsiveness, and that individual differences in stress reactivity constitute variation in susceptibility to features of the social environment, both positive and negative. This expanded interpretation of the functions of stress reactivity suggests the need for a reconceptualization of the construct. In this paper, we therefore refer to biological sensitivity to context (BSC) as a phenotypic property of individuals, which has both constitutional and experiential origins, and is indexed by heightened reactivity in one or more of the stress response systems.
Conditional Adaptation and the Development of BSC
Repeated assessments of stress reactivity have shown that test–retest reliability is generally weak in infancy (Kagan, 1994), moderate in middle childhood (Alkon, Goldstein, Smider, Essex, Kupfer, & Boyce, 2003), and does not reach high levels until adolescence (Allen & Matthews, 1997). Consistent with the animal literature on early plasticity of stress response systems (Hofer, 1994; Meaney, 2001), this increasing test–retest reliability over childhood suggests that BSC is a developmentally “canalized” characteristic, which is significantly influenced by early experience.
Boyce and Ellis (2005) posit that natural selection has favored developmental mechanisms that function to adjust levels of BSC to match familial and ecological conditions encountered early in life. This theory follows from an assumption that individuals have evolved to function competently in a variety of environments. According to conditional adaptation models (e.g., Belsky, Steinberg, & Draper, 1991; Chisholm, 1999; Tooby & Cosmides, 1990), what enables this flexibility are evolved psychobiological mechanisms that monitor specific features of childhood environments, features proven reliable over evolutionary time in anticipating the social and physical world into which children will mature, and entrain developmental pathways that reliably matched those features during a species' natural selective history.
Based on the concept of conditional adaptation, the current theory proposes that humans have evolved developmental mechanisms that detect and internally encode information about levels of stability and support versus stress and adversity in early childhood environments. This information then serves as a basis for calibrating the development of stress response systems, in terms of activation thresholds and magnitudes of response, to match the experienced environments. Specifically, the theory specifies three developmental pathways underlying variation in BSC, which taken together generate a U-shaped curvilinear relation between BSC and levels of support/adversity in early childhood environments (as diagrammed in Boyce & Ellis, 2005).
Acute, severe childhood stress → high BSC
As suggested by both the human and animal literatures, individuals who experience acutely severe stressors in early childhood tend to develop highly reactive CRH and LC-NE systems (Champoux, Hwang, Lang, & Levine, 2001; De Bellis, Baum, Birmaher, Keshavan, Eccard, Boring, Jenkins, & Ryan, 1999; Meaney, 2001; Nachmias, Gunnar, Mangelsdorf, Parritz, & Buss, 1996; Suomi, 1997). For example, in the longitudinal, prospective Wisconsin Study of Families and Work (WSFW), Essex, Klein, Cho, and Kalin (2002) have shown that developmentally early exposures to critical family stressors, such as maternal depression in infancy, may sensitize the responsiveness of children's CRH systems to later adversities, contributing to higher subsequent rates of mental health symptoms. High stress reactivity in the context of acute, severe childhood stressors may function to increase the overall readiness and capacity of individuals to deal with the very real dangers in their environment (even as it also results in chronic overarousal and associated sequelae). We thus anticipated that children who experience very stressful early home and/or school environments would tend to develop high BSC.
High childhood support and stability → high BSC
As summarized above, biologically reactive phenotypes should also enable children to flourish under stable and supportive familial and ecological conditions, where they may especially benefit from high levels of parental investment. High reactivity in this context is deemed to allow children to more fully “absorb” or take advantage of the positive, supportive features of their environments. We thus suggested that individuals whose early childhoods are characterized by intensive, stable caregiving and family support would also tend to develop high BSC.
Moderate, ongoing childhood stress → lower BSC
Finally, development of phenotypes that are not highly reactive should also been favored by natural selection in some environmental contexts, because they enabled children to cope more effectively within the broad, normative range of familial and ecological challenges. That is, lower BSC may have served a protective function for children, allowing greater resilience under difficult conditions, through increased gating of emotional signals from chronically, but moderately, stressful environments. We thus expected that individuals whose early childhood experiences are characterized by moderate levels of ongoing stress and threat will tend to develop relatively muted reactivity profiles.
The proposed developmental mechanisms for adjusting BSC in response to early childhood experiences could have resulted from a long and recurrent natural selective history in which (a) different children confronted substantially different rearing environments; (b) in rearing environments characterized by either acute stress or stable, supportive caregiving, more reactive children experienced, on average, better survival and reproductive outcomes than did less reactive children; and (c) in rearing environments characterized by only moderate levels of ongoing stress and threat, less reactive children experienced generally better survival and reproductive outcomes than did more reactive children.
The current research explores these developmental pathways in secondary analyses of two studies of early development and psychopathology. Study 1 explores psychosocial concomitants and Study 2 explores psychosocial antecedents of individual differences in BSC in children. Our goal was to attempt an empirical reproduction, through the use of exploratory signal detection analyses, of the U-shaped curvilinearity hypothesis generated conceptually by Boyce and Ellis (2005). This dual conceptual–empirical approach to hypothesis generation is appropriate in domains such as this, in which the current state of knowledge is inadequate or conflicted. A convergence of theoretical and empirical reasoning, we argue, would portend well for the validity of the evolutionary–developmental hypothesis. Nevertheless, the hypothesis would eventually require rigorous tests of its predictive strength in studies designed for that purpose.
Methods for Study 1: The Berkeley Preschool Health Study
Participants and overview
One hundred forty-five 3- to 5-year-old children (mean age = 48 months, range = 30–72 months) and their parents were recruited through parent meetings from the preschool populations of four university-affiliated childcare centers. Of these, 127 children continued in the centers for the entire study period and were missing no data. The resulting sample comprised 55 girls and 72 boys from middle class families, which included 99 White, 2 African American, 6 Asian, 1 Hispanic, and 19 other race or biracial family units. The 127 study children represented approximately half of the 274 children eligible to participate over the 2-year study period from January 1990 through December 1991. Each child was recruited into one of two cohorts and was followed for 6 months, from January through June 1990 or 1991. Mothers completed all measures of family stressors and support. In addition, teachers completed measures of childcare stress every 2 weeks. Cardiovascular reactivity testing was performed on each child within 4 weeks following January enrollment. A contribution to the childcare centers' parents' fund was made for each enrolled child.
Measures of support/stressors in early childhood environments
Major stressful life events
A checklist of major stressful events in the family over the preceding 6 months was completed both at the beginning and end of the study. This checklist was generated from the prior work of Coddington (1972), Monaghan, Robinson, and Dodge (1979), and Brown and Davidson (1978), and assessed both number of event occurrences and level of parental distress in response to each occurrence (3-point scale: 0 = did not occur, 1 = occurred but not distressing, 2 = occurred and distressing) for 38 major events (e.g., “Parent lost a job,” “Death of an extended family member”). Composite life event and parental distress scores were computed as the sum of event occurrences (M = 4.49, SD = 3.09) and distress ratings (M = 2.02, SD = 1.55) across both parent reports.
Chronic family discord
Chronic family discord was measured at the beginning of the study using the Conflict subscale (M = 2.99, SD = 1.33) of the Moos Family Environment Scale (FES), a multidimensional measure of family functioning with strong reliability and validity characteristics (Moos, Insel, & Humphrey, 1974). FES Conflict consists of nine true–false items addressing the amount of openly expressed anger, aggression, and conflict among family members (e.g., “We fight a lot in our family”, “Family members sometimes get so angry they throw things”).
Number of social supports
Number of social supports available to the family (M = 21.4, SD = 11.2) was indexed at the beginning of the study by the Social Support Questionnaire (SSQ; Sarason, Levine, Basham, & Sarason, 1983). The SSQ asks participants to list up to nine individuals to whom participants feel they could turn for support in each of six different situations.
Number of family routines
Number of family routines was assessed with the Family Routines Inventory (FRI; Boyce, Jensen, & James, 1983; Jensen, James, & Boyce, 1983) at the beginning of the study. The FRI is a 28-item checklist for parental report of supportive routines and rituals in day to day family life (e.g., “Parent reads or tell stories to the children almost every day”; “Whole family eats dinner together almost every night”). For each item, participants reported how frequently the family routine occurred (0 = almost never, 3 = always/every day). Total scores for number of family routines were based on the sum of these frequency ratings (M = 53.4, SD = 8.4).
Childcare stressors
The primary teacher for each child completed a questionnaire on childcare stressors every 2 weeks throughout the study period. Modeled after the measures of daily “hassles” developed by DeLongis, Coyne, Dakof, Folkman, and Lazarus (1982), DeLongis, Folkman, and Lazarus (1988), and Kanner, Feldman, Weinberger, and Ford (1987), the questionnaire comprised 20 items describing common but relatively minor stressful events in the course of day to day childcare. Items were generated from prestudy interviews with 18 preschool teachers, in which they were asked to describe the events and experiences that cause stress or are upsetting for 3- to 5-year-old children in childcare (e.g., “exclusion or rejection by peers,” “change in drop-off or pick-up routine,” and “problem with toileting”). For each item, teachers were asked to record whether the experience had occurred for the child that day, and a childcare stressful events score was calculated as the number of single-day stressors reported for each child, averaged across the biweekly ratings. Scores were standardized within the larger study sample of 145 children and retained for the analytic subsample with no missing data (M = −0.015, SD = 1.78).
Mother's education
Mothers' years of formal primary and secondary education were calculated as an index of socioeconomic status (SES). Mothers reported a mean educational attainment of 18.3 years (SD = 1.85, range = 12–20 years), reflecting the generally well-educated status of the Study 1 sample families.
Total stress
To create an overall measure of childhood stress, the six measures of stressors and support in early childhood environments were standardized, reverse coded as necessary so that higher scores represented greater stress/lower support, and then combined in a unit-weighted composite (M = 0, SD = 0.46). Mother's education was excluded from this composite because it correlated positively with family discord (Table 1) and thus could not be conceptualized as an indicator of low stress.
Correlations among independent variables

BSC
Protocols for the laboratory measurement of cardiovascular and autonomic reactivity have been developed and standardized for use in samples of adults (Kamarck, Jennings, Debski, Glickman–Weiss, Johnson, Eddy, & Manuck, 1992), adolescents (Ewart & Kolodner, 1991; Matthews, Woodall, & Stoney, 1990), and primary school children (Murphy, Alpert, Willey, & Somes, 1988; Sallis, Broyles, Nader, Buono, Abramson, Patterson, & Nelson, 1991). In addition, a reactivity protocol for young children was designed by Boyce, Alkon, and colleagues (Alkon et al., 2003; Boyce, Quas, Alkon, Smider, Essex, & Kupfer, 2001), and an early version of that protocol was utilized in Study 1. The standardized, 15-min protocol comprised mildly stressful, ecologically valid tasks, representing different stressor domains (i.e., social, cognitive, physical, and emotional) that were selected to provide a range of challenges. The tasks were always administered in the same order, by a trained child tester, and without the presence of a parent. The seven selected tasks were (a) a child interview; (b) a hidden block construction in which the child was asked to replicate the examiner's block structure (tasks a and b were taken from the Gesell School Readiness Screening Test, Carlson, 1985); (c) number recall, involving recitation of a series of digits; (d) a Gestalt closure task, in which the child was asked to identify a familiar object within an incomplete picture (tasks c and d were taken from the Kaufman Assessment Battery for Children, Kaufman & Kaufman, 1983); (e) a social problem-solving task taken from an instrument by Rubin (1988); (f) a blinded object identification; and (g) a task involving the verbal description of an emotional event. Immediately preceding and following presentation of the challenging tasks, a neutral, calming story was read to the child to allow collection of resting cardiovascular data. The seven selected tasks have been shown to be both capable of reliably evoking cardiovascular reactivity and ecologically valid, in the sense of approximating stressors inherent in the child's naturally occurring experiences of the world (Alkon et al., 2003; Boyce, Alkon, Tschann, Chesney, & Alpert, 1995).
To minimize the potential adversity of the monitoring equipment itself, children were given an opportunity to see, touch, and operate the equipment during a group meeting held in each childcare center a week prior to reactivity testing. All testing was carried out in a quiet, secluded room in the childcare facility; testing was scheduled weekdays between the hours of 9:00 a.m. and 11:30 a.m. The protocol was 20 min in duration and was presented by a female examiner previously unknown to the child. At the beginning of each session, a blood pressure cuff was attached to the child's nondominant arm, and a research assistant led the child into the testing room. Measurements of HR and mean arterial blood pressure (MAP) were completed using an automatic, oscillometric Dinamap monitor (model 1846 SX/P), for which validity had been previously established (Park & Menard, 1987). During each of the seven challenging tasks, a single HR and MAP measurement was completed at a standard point in the presentation or completion of the task, when the nondominant arm was immobile. Three measures were taken prior to beginning the seven tasks, and 2 were taken following the tasks, for a total of 12 HR and MAP measurements. All tasks were presented in the same order to each child.
For each child, an HR and MAP reactivity score was calculated as the standardized residual derived from regressing the mean of the task measures on the mean of the resting measures at the sample level. A usual approach to scoring cardiovascular reactivity has been to employ difference scores representing the mean of task-specific measures minus the mean of the resting measures. As pointed out by Manuck, Kasprowicz, and Muldoon (1990), however, a simple difference score may not adequately control for resting cardiovascular measures, which are often significantly and positively associated with the difference score at the sample level. An alternative approach is a standardized residual score, calculated as the standardized difference between the actual mean of the task measures and the mean predicted for an individual by the regression equation y = a + b(x), where x is the mean of the resting measures. The standardized residual score offers better control for resting measures by taking into account the sample-level correlation between resting and task measures.
Methods for Study 2: The WSFW
Participants and overview
A sample of 122 children and their parents and teachers was recruited from one of two cohorts (total N = 500) in the longitudinal WSFW (Hyde, Klein, Essex, & Clark, 1995). The resulting sample included 73 girls and 49 boys from middle class families, representing 109 White, 4 African American, 4 Asian, 2 Hispanic, and 3 other race or biracial family units. Eligibility for the current study was based on families' participation in prior waves of data collection, residence within geographic proximity of the project offices, and the presence of a target child in a local school. A group of 203 families in the Wisconsin Study's first cohort met these criteria and was further refined using the mental health symptom subscales of the MacArthur Health and Behavior Questionnaire (HBQ). The HBQ is a 140-item, parent and teacher report instrument assessing mental and physical health and social and academic functioning in middle childhood. The instrument has been shown to have strong psychometric properties, including test–retest reliability, internal consistency, and empirical validity in discriminating groups of 4- to 8-year-old children with and without signs of early psychopathology (Ablow et al., 1999; Boyce, Essex, Woodward, Measelle, Ablow, & Kupfer, 2002; Essex, Boyce, Goldstein, Armstrong, Kraemer, & Kupfer, 2002). The present sample of 122 children was assembled, using HBQ scores at 5 years of age, to achieve approximately equal representation of children with high and low reported symptoms and, among those high in symptoms, near parity between internalizing or externalizing behavioral profiles. Of the 122 families who were identified and agreed to participate, 120 completed all components of the study.
Assessments of family stress were conducted in infancy (1, 4, and 12 months after delivery) and again in preschool (ages 3.5 and 4.5 years). Children's autonomic and adrenocortical reactivity were subsequently evaluated in the summer following first grade (mean age = 6.9 years, range = 6–7 years), as a component of a 4-hr, in-home assessment occurring in either the morning or the afternoon. The 20-min reactivity protocol was completed in a portable laboratory built into a van parked outside the child's home.
Measures of support/stressors in early childhood environments
Family stress scores were computed separately for mothers and fathers based on their self-reports of five domains: (a) depression symptoms, (b) family expressed anger, (c) parenting stress, (d) role overload, and (e) financial stress. Except where noted, assessments in each of the five domains were conducted three times during the infancy period and twice during the preschool period. Father data were only used if the father resided in the household (ensuring that the child was exposed to the father-reported stress).
Parental depression
Parental depression was assessed by the Center for Epidemiological Studies—Depression Scale (CES-D; Radloff, 1977), which asks respondents how frequently they experienced each of 20 symptoms during the past week (e.g., “could not shake off the blues,” “bothered by things that don't usually bother you”). Alpha coefficients were above .85 for mothers and fathers across all assessments.
Family expressed anger
In infancy, family expressed anger was assessed as the average of three items indexing overt Marital Conflict (i.e., how concerned about “arguing or fighting”, “not getting along”, “partner is critical of you”), which were selected from the Concerns subscale of the Partner Role Quality Scale (Barnett & Marshall, 1989). At the preschool assessments, family expressed anger was again based on Marital Conflict scores, along with scores for Anger Expression (Spielberger, 1988) and the Negative subscale of the Family Expressiveness Questionnaire (Halberstadt, 1986). Anger Expression consists of 16 items covering inward and outward expression of anger (e.g., “I do things like slam doors”; “I pout or sulk”). Negative Family Expressiveness consists of 20 items covering dominant and submissive expressions of negative affect by family members toward each other (e.g., expression of “dissatisfaction with others' behavior”; “sulking over unfair treatment by family”). Alphas were above .80 for the marital conflict measure and above .70 for Anger Expression and Negative Family Expressiveness for both mothers and fathers across all assessments. For the preschool assessments, the three scales were combined, separately for mothers and fathers, using principal components analysis (PCA) and then saving factors scores (with scales weighted by their factor score regression coefficients in a linear composite). The first component of the PCA accounted for at least 50% of the variance in each of the analyses.
Parenting stress
Parenting stress was based on the average of three items indexing parent–child negativity (e.g., “I often feel angry with my child”) from the Childrearing Practices Report (Block, 1965) and the Competence and Child Reinforces Parent subscales of the Parenting Stress Inventory (PSI; Abidin, 1986). PSI Competence consists of 11 items covering feelings of incompetence in the parenting role (e.g., “being a parent is harder than I thought it would be,” “I feel capable and on top of things when I am caring for my child” [reverse scored]). PSI Child Reinforces Parent consists of seven items covering dissatisfaction with the child's behavior toward the parent (e.g., “my child rarely does things for me that make me feel good,” “my child smiles at me much less than I expected”). In the infancy period, parent–child negativity was assessed only at 12 months. Alphas were above .65 for parent–child negativity, above .75 for PSI Competence, and above .65 for PSI Child Reinforces Parent for both mothers and fathers across all assessments. Again, the three scales were combined, separately for mothers and fathers, using PCA and saving factors scores. The first component of the PCA accounted for at least 50% of the variance in each of the analyses.
Role overload
Role overload was based on the average of five items from the Role Overload scale (e.g., feeling “pulled apart by conflicting obligations”; Barnett & Marshall, 1989) and the Role Restriction subscale of the PSI (Abidin, 1986). PSI Role Restriction consists of seven items covering feelings of overload in the parenting role (e.g., “I often feel that my child's needs control my life,” “The number of children I have now is too many”). These two measures were standardized and then averaged (r = .48). In the infancy period, the Role Overload scale was assessed only at 12 months. Alphas for the two scales were above .75 for mothers and fathers across all assessments.
Financial stress
Financial Stress was the average of four items (e.g., “how much difficulty making monthly payments”; “how often thought about money problems in past week”). Alphas were above .70 for mothers and fathers across all assessments.
Composite family stress measures
Overall scores in each of the five stress domains were (a) averaged over the three assessments conducted at 1, 4, and 12 months after delivery (the infancy period) and (b) averaged over the two assessments conducted at ages 3.5 and 4.5 years (the preschool period). For both the infancy and preschool periods, these five averaged scores were then subjected to PCA and weighted by their factor score regression coefficients in a linear composite. The purpose of the PCAs was to derive latent stress factors that extracted the shared variance from the specific measures of family stress. The first component of the PCA accounted for at least 50% of the variance in each of the analyses. This data reduction procedure resulted in four standardized composite measures of family stress: An infancy measure and a preschool measure for both mothers and fathers.
SES
In addition, a composite measure of SES across the infancy and preschool periods was calculated on the basis of family income (at the 12-month and 4.5-year assessments) and father's and mother's education (years). The four measures were combined using PCA and saving factors scores. The first component of the PCA accounted for 56% of the variance.
Total stress
To create an overall measure of stress in early childhood, the four composite family stress measures and the SES measure, which were already standardized, were combined in a unit-weighted composite (M = 0.03, SD = 0.65).
BSC
Study 2 employed the final version of a reactivity protocol for young children developed by Boyce, Alkon, and colleagues (Alkon et al., 2003; Boyce et al., 2001), an earlier form of which was used in Study 1. Five physiological response parameters were employed in the protocol, which is described in greater detail by Alkon et al. (2003): (a) HR, (b) MAP, (c) respiratory sinus arrhythmia (RSA), a measure of parasympathetic influence on HR variability, (d) preejection period (PEP), an index of sympathetic activation of the heart, and (e) salivary cortisol, collected by expectoration into a plastic cup four times over the course of the study assessment. HR was ascertained from interbeat interval data acquired using ECG digitized at 500 Hz, edited for artifacts, and analyzed with the detection algorithm of Berntson, Quigley, Jang, and Boysen (1990). MAP was measured with the Dinamap monitor at the point of maximal oscillatory amplitude (Park & Menard, 1987). RSA, as described in the work of Porges (1995) and Cacioppo, Uchino, and Berntson (1994), was derived from spectral analyses of interbeat interval data within the respiratory cycle-associated, high-frequency (0.15–0.50 Hz) band of the HR power spectrum. The natural logarithm of the variance in high frequency heart period was calculated to estimate parasympathetic activity. PEP, the duration of isovolumetric ventricular contraction, was measured with impedance cardiography as the 70–100 ms interval between the onset of electromechanical systole (indicated by the ECG Q-wave) and left ventricular ejection (indicated by the B-point of the thoracic impedance signal). As described by Cacioppo, Berntson, Binkley, Quigley, Uchino, and Fieldstone (1994), thoracic impedance (Z0) and its first derivative (dZ/dt) were measured as resistance to a constant 4-mA, 100-kHz alternating current, using electrodes placed at the apex and base of the child's thorax. Impedance data were ensemble averaged in 1-min intervals, and each waveform was verified or edited prior to analysis. Autonomic reactivity was thus assessed as accelerations in HR, increases in MAP, diminution in RSA (reflecting parasympathetic withdrawal), or shortening of PEP (reflecting a sympathetic effect on cardiac chronotropism). As in Study 1, reactivity scores for HR, MAP, RSA, and PEP were calculated as standardized residual scores from the regression of mean task measures on mean resting measures at the sample level.
An unfamiliar female researcher administered the challenges utilized in the reactivity protocol. They included (a) a structured child interview modified from the Gesell School Readiness Screening Test (Carlson, 1985), (b) digit span recitation modified from the Kaufman Assessment Battery for Children (Kaufman & Kaufman, 1983), (c) 2–3 drops of lemon juice placed on the child's tongue, and (d) two emotion-evoking videotapes that were chosen to elicit fear and sadness (Eisenberg, Fabes, Bustamante, Mathy, Miller, & Lindholm, 1988). The four epochs were selected to represent social, cognitive, physical, and emotional challenges for 4- to 8-year-old children, and were presented to each child in the same sequence. Before and after the set of four challenges, children were read a 3-min calming story to procure resting physiological measures, and between the second and third challenges a 1-min period of quiet inactivity (the “recovery” epoch) was imposed to examine short-term recovery in physiological parameters. The total time for completion of the protocol varied between 20 and 30 min, including the time required for attachment, application and testing of monitoring equipment.
Cortisol was assessed in saliva because it can be noninvasively collected and reflects the plasma concentration of the nonprotein bound active fraction (Kirschbaum & Hellhammer, 1994). There were four collection times over the course of the 4-hr, in-home assessment: one immediately following the arrival of the study team, a second and third prior to and following the reactivity protocol, and a fourth at the termination of the assessment procedures. Saliva samples were transported on ice from the families' homes to the laboratory immediately after the assessment. Samples were temporarily stored at −20°C for prelaboratory accounting and then transferred to the wet lab where they were stored at −70°C until assayed. Assays were conducted using the Pantex (Santa Monica, CA) 125I Cortisol RIA Kit modified for saliva. All samples were assayed in duplicate within the same assay. Thirty-three assays were conducted over the course of 4 months. Results were considered acceptable only if they met the following criteria: for cortisol concentrations < 0.055 μg/dl, the required coefficient of variation (CV%) of the duplicate samples was <25%. For cortisol concentrations > 0.055 μg/dl, the required CV% of the duplicates was <15%. Repeat assays were performed on all samples not meeting these criteria. The detection limit of the assay (ED80) was 0.03 μg/dl. The mean interassay and intraassay variations were 6.97 and 3.91%, respectively.
Inspection of cortisol values across the study sample revealed that the first measure achieved the highest mean value and showed the greatest variability, suggesting that anticipatory adrenocortical activation at assessment onset was the best representation of cortisol “reactivity.”1
Resting measures were thus achieved for autonomic measures but not for measures of salivary cortisol, a difference attributable to the disparate response times for catecholamine versus glucocorticoid secretion. Autonomic reactivity occurs within a time course measured in seconds, while adrenocortical responses emerge 20–30 min following the onset of stressors (Sapolsky et al., 2000). Similarly, autonomic reactivity is evanescent and more promptly responsive to rest, while cortisol responses persist over longer periods of time. Because of these differences, the resting periods that began and ended the reactivity protocol were capable of downregulating autonomic parameters, but not salivary cortisol.
Statistical Methods
The principal research objective of the exploratory analyses conducted in both studies was to identify those indices of environmental stressors and supports mostly closely associated, singly or in combination, with a high reactivity phenotype, as measured in a standardized laboratory protocol. High reactivity was defined as the top quartile of scores on a given physiological measure, and a signal detection model, a form of recursive partitioning, was used to delineate which predictor variables, and which cut points within those variables' ranges of values, discriminated between high (top 25%) and lower (bottom 75%) reactivity groups with the greatest efficiency. The upper 25% of scores was chosen as the criterion for high reactivity on the grounds of several prior observations. First, research with both human children (Kagan, Reznick, & Snidman, 1988) and nonhuman primate infants (Suomi, 1991) indicates that the proportion of individuals showing biological and behavioral evidence of high reactivity status is approximately 20%. Second, in prior work documenting Reactivity × Context interactions in the prediction of health outcomes (e.g., Boyce, Chesney, Alkon–Leonard, Tschann, Adams, Chesterman, Cohen, Kaiser, Folkman, & Wara, 1995; Boyce, O'Neill–Wagner, Price, Haines, & Suomi, 1998), the upper 20% of children have shown the described proclivity for highly context-dependent outcomes, that is, evidence of BSC. The top quartile was chosen as our criterion or “gold standard” for high reactivity status to ensure adequate numbers in the signal detection analyses.
As described in Kraemer's work on signal detection methods (Kraemer, 1992), predictive tests are evaluated against such a gold standard, and a series of conditional probability scores are calculated to reflect the performance of the test within a specific study sample. Conditional probability scores include the test's sensitivity, specificity, and efficiency (i.e., the probability that the test result, positive or negative, and the gold standard agree). A test statistic (χ2) is computed to confirm that test results are nonrandomly associated with gold standard results. The quality of a given test's sensitivity, specificity, or efficiency depends on where each score lies within its effective range, calibrated for the proportion of subjects with a positive test, and is statistically evaluated with Cohen's kappa. Because the quality of the test will vary with the choice of the test referent (i.e., the rule that classifies a test as positive or negative), a procedure is needed to optimize quality for the conditional probability score of greatest importance, given the use to which the test will be put. Such a choice is made with a signal detection approach (Swets & Pickett, 1982), using a quality receiver operating characteristic curve that plots the quality of various tests' sensitivities versus the quality of their specificities (Kraemer, 1992). The signal detection method provides an exploratory mathematical algorithm for choosing both the optimal test (i.e., among the possible predictor variables) and the best cut point (i.e., among the possible referents for the chosen variable) that results in the highest possible test efficiency. Signal detection methods also provide a more interpretable and useful result when frequent or higher order interaction effects are anticipated or encountered.
In the present analyses, scores reflecting children's social environments, along with their respective ranges of values and interval cut points,2
Interval cut points determine how coarse or fine the resolution of the test is in evaluating the independent variable's prediction of the criterion measure, that is, in this case, the upper quartile of reactivity scores. The level of resolution is chosen principally based on the accuracy of measurement of the predictor variable and an appraisal of meaningful intervals along the spectrum of its values. More information is available from the authors.
Defining the Range of Variation
According to the theory presented here, higher relative levels of stress should be associated with either downregulation or upregulation of BSC, depending on the absolute amount of stress. Thus, to explore the curvilinearity hypothesis, it was important to delineate the range of stressors and supports that were present in a given study. The Berkeley Preschool Health Study (Study 1) sampled only a restricted range of variation on the support–adversity dimension of early childhood environments. Of particular note is that participants in the top quartile of Total Stress inhabited only moderately stressful environments (e.g., maternal education was still relatively high, M = 18.5 years, as was number of family supports, M = 16.88, and family routines, M = 49.72, but the number of major stressful life events was moderate, M = 6.85). By contrast, participants in the bottom quartile of Total Stress experienced very protected environments (e.g., high maternal education, M = 18.5 years, high family supports, M = 29.25, high family routines, M = 57.75, and low number of stressful life events, M = 2.78). Following these descriptions, in Study 1 we operationalized “very low stress” as the bottom quartile of Total Stress (≤−.33), “low stress” as the second quartile of Total Stress (>−.33 and <0), and “moderate stress” as the third and fourth quartiles of Total Stress (≥0). Because Study 1 comprised children whose early environments ranged from exceptionally stable and supportive to moderately stressful, the sample provides a window into only a portion of the proposed U-shaped association between support/adversity and BSC (i.e., Boyce & Ellis, 2005 [this issue], figure 3, left half of curve). Within this portion, the theory suggests that higher stress will be associated with reduced biological responsivity to stressors.
By contrast, the WSFW (Study 2) sampled a broader range of variation on the support–adversity dimension of early childhood environments. Participants in the top quartile of Total Stress3
Note that, although a composite variable was computed to index variation in levels of support/adversity in each study, and in each study this variable was designated “Total Stress,” the variable is in fact study specific. That is, Total Stress is based on different component measures in Study 1 and Study 2 and thus is not directly comparable across studies.
The signal detection algorithm identifies subgroups of participants whose childhood stress levels vary along this range. When the algorithm identifies two groups whose early environments range from very low stress or low stress to moderate stress, then the comparison provides a window into the left side of the proposed U-shaped curve, and the theory suggests that increasing stress levels will be associated with downregulation of BSC. Conversely, when the algorithm identifies two groups of participants whose environments range from moderate stress to high stress, then the comparison provides a window into the right side of the U-shaped curve, and the theory suggests that increasing stress will be associated with upregulation of BSC. (See Boyce & Ellis, 2005 [this issue], figure 3, for a graphical representation of the curvilinearity hypothesis.)
Results
Intercorrelations among measures of support/adversity in childhood environments
In Study 1, correlations among the different measures of support/adversity in early childhood environments generally revealed a very modest pattern of associations (Table 1), indicating that these measures (e.g., maternal education, number of family routines, childcare stressors) largely indexed different aspects of those environments. In Study 2, most measures of family environment correlated significantly (Table 1). There was high rank-order stability of both mother reports (r = .72) and father reports (r = .65) of composite family stress across the infancy and preschool periods. There were also moderate correlations between mother and father reports of family stress in both infancy (r = .30) and preschool (r = .42).
Aggregation of variables for signal detection analyses
Childhood environment measures
Because of the generally low pattern of intercorrelation among the childhood environment measures in Study 1, these measures were entered separately into the signal detection analyses. Conversely, because of the substantial pattern of intercorrelation among the specific family stress measures in Study 2, these measures were aggregated through PCA into the composite family stress measures (see Method). These composites, along with SES, were then used in the signal detection analyses.
Stress reactivity measures
For both theoretical and empirical reasons, the biological measures of stress reactivity were examined separately rather than as a composite, aggregated measure of BSC. From a theoretical perspective, the measures index interactive, but anatomically and functionally distinctive neural circuits and thus cannot be meaningfully combined (Gold & Chrousos, 2002; Sapolsky et al., 2000). At an empirical level, the measures were largely uncorrelated (see Alkon et al., 2003).
Signal detection analyses: Study 1
Eight candidate predictor variables were entered into the signal detection analysis of Study 1 data, along with their minimum and maximum values and interval cut points. These were: the child's age, mother's education (years of schooling), frequency and distress scores for major life events, chronic family discord, family social supports, family routines, and childcare stressful events. Two series of analyses were conducted: one for each of the cardiovascular reactivity measures (i.e., the standardized residual scores for HR and MAP). For each analysis, the signal detection algorithm examined the predictor variables and their possible cut points and selected a single variable and cut point that produced an optimal sensitivity and specificity in the prediction of reactivity scores in the upper 25%. As noted above, the algorithm also calculated a chi-square statistic that estimated the likelihood of a Type I error at an alpha probability level of .05, and the procedure continued until either too few participants remained in identified subgroups for further analysis or no discriminating variable was identified at p < .05.
Figure 1A displays results of the signal detection analysis for prediction of high HR reactivity, defined as a score in the top quartile of the sample distribution. The first optimally efficient variable (N = 127; χ2 = 5.79; p < .05) that distinguished high and lower HR reactivity children was the score for distress related to major life events. Forty-six percent of participants with distress scores of zero on this measure had high HR reactivity scores, while only 21% of those with distress scores above zero were highly reactive. No other predictor offered further significant discrimination within the latter group. Among the subgroup with low distress scores, however, family routines scores further discriminated participants (n = 22; χ2 = 8.82; p < .01). Eighty percent of those with the combination of low distress scores and high family routines were found in the upper quartile on HR reactivity. On the other hand, only 17% of children whose parents reported low event-related distress and low family routines were highly reactive. Both significant associations with HR reactivity were thus consistent with the second proposed developmental pathway, in which greater childhood support and stability (i.e., lower stress) promotes higher BSC.

Signal detection analyses of high reactivity residual scores (top quartile). (A) HR (Study 1: Preschool Health Study), (B) MAP (Study 1: Preschool Health Study), (C) HR (Study 2: WSFW), (D) MAP (Study 2: WSFW), (E) PEP (Study 2: WSFW), and (F) salivary cortisol (Study 2: WSFW).
In Figure 1B, results of the signal detection analyses for MAP reactivity reveal significant predictors for scores in the upper 25% on this reactivity variable. The first order discriminating independent variable was age (N = 127; χ2 = 4.97; p < .05), with 35% of children 4 years of age or older having high MAP reactivity, in contrast to the younger children, of whom 18% had highly reactive profiles. Within the older subgroup, the number of family social supports offered further discrimination (n = 54; χ2 = 5.60; p < .05), with 50 and 19% identified as high MAP reactors among the subsets with high and low family social supports, respectively. No other variables were significantly predictive of MAP reactivity within the younger child group. Similar to results for HR reactivity, the signal detection analyses were again consistent with the proposed second developmental pathway to a high reactivity profile.
Taken together, the signal detection analyses of Study 1 converge on the proposed second developmental path to a high BSC phenotype. High HR reactivity was best predicted by a combination of low parent-reported distress related to major life events and high scores on positive and supportive routines within family life. High MAP reactivity was most strongly related to the combination of older age and high numbers of family social supports. Consistent with the presented theory, these exploratory analyses provide additional, empirical grounds for hypothesizing that very low stress, highly supportive environments in early childhood (in comparison with moderately stressful environments) foster the emergence of highly reactive autonomic response systems.
Signal detection analyses: Study 2
For Study 2, there were five predictor variables entered into signal detection analyses for each of five reactivity measures. The predictors were family SES from infancy through preschool, the mother-reported composite family stress scores for the infancy period and for the preschool period, and the corresponding father-reported scores. Reactivity measures comprised standardized residual scores for HR, MAP, RSA, and PEP, and the first salivary cortisol level measured at the assessment protocol onset.
Figure 1C–F displays the results of signal detection analyses for four of the five reactivity measures; no discriminating predictors were identified for RSA reactivity. Figure 1C reveals that family SES was the only significant predictor of HR reactivity (N = 106; χ2 = 3.85; p < .05), with higher SES associated with a greater proportion of highly reactive children (31 vs. 14% in the low SES subgroup). Similarly, for MAP reactivity (see Figure 1D), the mother-reported composite family stress score for infancy divided the sample (N = 113; χ2 = 9.61; p < .01) into a lower family stress group, with 41% of children showing a highly reactive phenotype, and a higher stress group with only 15% highly reactive. In both analyses, the higher stress group had Total Stress levels in the moderate range (Total Stress in lower SES group: M = 0.32; Total Stress in the higher family stress group: M = 0.29), whereas the lower stress groups had Total Stress scores in the low to moderate range (Total Stress in higher SES group: M = −0.11; Total Stress in the lower family stress group: M = −0.40). Thus, in each case, the groups designated by the signal detection analyses varied in the range from low to moderate childhood stress. Within this range, the theory suggests that the lower stress groups should display higher BSC. Therefore, findings for both HR and MAP reactivity in Study 2 converge on the second proposed developmental pathway, in which less stressed families with greater resources produce a disproportionate number of children with highly reactive profiles of response.
A more complex set of findings emerged for PEP reactivity, the measure of response to challenge in the sympathetic branch of the autonomic nervous system (ANS). As shown in Figure 1E, the highest order discriminating variable was the father-reported composite family stress score for the preschool period (N = 95; χ2 = 8.01; p < .01). Fathers reporting high family stressors during preschool had children with greater sympathetic reactivity measured 3 years later, in first grade. Forty-five percent of children from families with high stress in the preschool period were in the top quartile on PEP reactivity, while 18% of children from the less stressed families were high in reactivity. No further discriminating variables were identified for the high stress families. On the other hand, for the families with lower family stressors in the preschool period, a second significant split was found for mother-reported composite family stress in the preschool period (n = 66; χ2 = 9.10; p < .01). Families with the combination of lower preschool stress reported by both the father and the mother had children who were highly PEP reactive 39% of the time, approaching as great a proportion as the 45% of children from high stress families identified on the first significant split. By comparison, only 9% of children were highly reactive in families in which the father reported low preschool stress and mothers reported high stress during the same period.
For PEP reactivity, the pattern of results was therefore consistent with all three of the proposed developmental pathways. In the sympathetic arm of the ANS, the greatest proportions of high reactivity children were found in the groups in that either (a) the father reported high family stress in preschool (45%; mean level of Total Stress = 0.56) or (b) both the father and the mother reported low family stress in the same time period (39%; mean level of Total Stress = −0.48). The lowest proportion of highly reactive phenotypes was found in the midstress families, where mothers and fathers were not concordant on their assessments of preschool stressors (9%; mean level of Total Stress = −0.07). Thus, consistent with the theory, among the subgroups of participants whose childhood stress levels varied in the range from low to moderate, increasing stress levels were associated with lower BSC; conversely, among the subgroups of participants whose stress levels varied in the range from moderate to high, increasing stress levels were associated with greater BSC.
Finally, as shown in Figure 1F, high anticipatory adrenocortical activation to the in-home laboratory procedures was associated with mother-reported composite family stress in the infancy period (N = 115; χ2 = 5.76; p < .05). Half of the children from families in which the mother reported very high family stress in infancy (mean level of Total Stress = 1.23) showed evidence of heightened hypothalamic–pituitary–adrenocortical (HPA) responses, while only 23% of children from lower stress families (mean level of Total Stress = −0.07) were similarly responsive. This finding is consistent with the first proposed developmental pathway, in which children experiencing very high levels of early stressors disproportionately evince higher BSC. In this case, the high stress group was nearly 2 standard deviations above the mean in Total Stress.
Evidence for curvilinearity
Considered together, the three proposed developmental pathways to high or lower reactivity phenotypes form a U-shaped relation between early support/adversity and the magnitude of BSC. Experienced adversity or support that is extreme in either direction (i.e., intense and frequent stressors or minimal stress accompanied by highly supportive caregiving) would be expected to produce atypically large numbers of highly reactive children. On the other hand, more normative, midlevel encounters with stress and adversity would be expected to result in relatively low proportions of high reactivity offspring. In two of the signal detection analyses (those for HR reactivity in Study 1 and PEP reactivity in Study 2), the algorithm identified three levels of exposure to stressors and supports, allowing a more complete exploration of the proposed curvilinearity.
Using the algorithms for HR (Study 1) and PEP reactivity (Study 2) shown in Figure 1A and E, the two samples were divided into three groups, representing different levels of support/adversity encountered by children in the first 5 years of life. Reflecting the more limited range of variation in support/adversity in Study 1, children were assigned, for the HR analysis, to groups labeled (a) very low stress (number of major stressful life events = 0, number of family routines > 55; n = 10), (b) low stress (number of major stressful life events = 0, number of family routines < 55; n = 12), or (c) moderate stress (number of major stressful life events > 0; n = 105). Likewise, reflecting the broader range of variation in support/adversity in Study 2, children were assigned, for the PEP analysis, to groups denoting (a) low stress (father-reported preschool stress < 0.50, mother-reported preschool stress ≤ −0.50; n = 23), (b) moderate stress (father-reported preschool stress < 0.50, mother-reported preschool stress > −0.50; n = 43), or (c) high stress (father-reported composite stress in preschool ≥ 0.50 on standardized score; n = 29). One-way analyses of variance was then conducted examining differences in group means on the reactivity variable using both linear and quadratic terms. The continuous measures of reactivity were used in these analyses. To validate the family stress groupings, Total Stress levels were examined concurrently with the mean reactivity scores.
Figure 2 summarizes results for Total Stress and HR reactivity in Study 1. As expected, the family stress groups derived from the signal detection analyses showed monotonically increasing levels of Total Stress, linear term: F (1, 124) = 15.49, p < .001. Given the restricted range of variation on the family support–adversity dimension in Study 1, the theory suggests that we should find L-shaped rather than U-shaped curvilinear relations with BSC. In this context, we might expect the very low stress group to evince the highest levels of HR reactivity and the low and moderate stress groups to display approximately equal but lower levels of HR reactivity. As shown in Figure 2, there was an overall trend for mean levels of HR reactivity to decrease across the three family stress groups, linear term: F (1, 124) = 12.30, p = .001; that is, greater stress was associated with lower reactivity. At the same time, however, this overall trend conformed to an L-shaped curve (Figure 2), and this curve deviated significantly from linearity, quadratic term: F (1, 124) = 4.19, p < .05. The tall spike on the left side of the curve indicates marked elevation of HR reactivity in the small group of very low stress children from highly protected family environments. The flattening out on the right side of the curve indicates approximately equal levels of HR reactivity in the low and moderate stress groups.

A one-way analysis of variance for standardized HR reactivity residual scores by the level of family stress (Study 1, N = 127).
Figure 3 summarizes results for Total Stress and PEP reactivity in Study 2. Again, there were monotonically increasing levels of Total Stress across the three family stress groups, linear term: F (1, 92) = 49.78, p < .001. Given the broader range of variation in family support/adversity in Study 2, the theory suggests that we should find U-shaped curvilinear relations with BSC. In this context, we might expect the low and high stress groups to evince the highest levels of PEP reactivity and the moderate stress group to display the lowest level. As shown in Figure 3, this type of U-Shaped curve emerged from the analyses. Although a sharp spike occurred on the right side of the U-Shaped curve (indicating marked elevation of sympathetic reactivity in the high stress group), there was also a substantial spike on the left side of the curve (indicating high sympathetic reactivity in the low stress group). In total, there was a statistically significant curvilinear relation in mean levels of PEP reactivity across the three groups, quadratic term: F (1, 92) = 4.80, p < .05.

A one-way analysis of variance for standardized PEP reactivity residual scores by the level of family stress (Study 2, N = 95).
Discussion
This research attempted, through the use of exploratory signal detection analyses, an empirical reproduction of theoretically derived hypotheses about early childhood environments and the development of BSC. In pursuing this question, the current research had a number of important strengths. First, in secondary analyses of two studies, we were able to carry out exploratory analyses on geographically diverse samples using different measures and methods. The basic similarity in results across the Berkeley Preschool Heath Study and the WSFW enhances the validity of the findings, reducing the probability of results having been obtained by chance. Second, the use of multiple data sources, in which information about levels of support and adversity in childhood environments was collected from parents and teachers while BSC data were collected directly through psychophysiological assessments, makes it unlikely that the current findings are inflated by method variance. Finally, the longitudinal nature of the Wisconsin study, in which children were followed prospectively from birth and measures of family stress were collected years before psychophysiological assessments, enabled us to examine childhood environments antecedent to the development of stable individual differences in BSC.
Explorations of the evolutionary–developmental hypothesis
Drawing on the concept of conditional adaptation, we have proposed that children, in the early years of life, detect and internally encode information about levels of social resources and support versus stress and adversity as a basis for adaptively calibrating the development of stress response systems. In positing systematic relations between early experiences and biobehavioral development, we have conformed to a well-established tradition in developmental psychology. We part from tradition, however, as some others have before (e.g., Belsky et al., 1991; Chisholm, 1999), in postulating that these relations have been structured by natural selection in specific and nonrandom ways. The current theoretical framework specifies evolved psychobiological mechanisms that (a) exist in the form they do because they recurrently solved specific problems of survival and reproduction over evolutionary history; (b) are designed to track information about levels of stability and support versus stress and adversity in early childhood environments; (c) process that information according to a specific set of rules and procedures; and (d) function developmentally to entrain BSC, in terms of activation thresholds and magnitudes of response, to match the experienced environments. In this context, “matching” means up- or downregulating BSC to levels that reliably enhanced developmental outcomes (health, growth, survival, and ultimately reproduction) in the experienced environments during human evolutionary history.
Conceptualizing BSC as susceptibility to environmental influence, both positive and negative, we have proposed that this matching process follows three paths: (a) exposure to acutely stressful childhood environments upregulates BSC, increasing the capacity and tendency of individuals to detect and respond to environmental dangers and threats; (b) exposure to exceptionally supportive childhood environments also upregulates BSC, increasing susceptibility to the social and developmental benefits of such environments; and (c) exposure to childhood environments that are extreme in neither direction downregulates BSC, buffering individuals against the chronic stressors encountered in a world that is neither highly threatening nor universally safe. The current exploratory data analyses, to varying degrees, also generated these three proposed paths.
First, in both studies, the signal detection analyses suggest that supportive, stable childhood environments may foster the emergence of high autonomic reactivity. High HR reactivity was best predicted, in Study 1, by a combination of low parent-reported distress related to major life events and high scores on the routinization of family life and, in Study 2, by higher socioeconomic status. Likewise, high MAP reactivity was most strongly related, in Study 1, to the combination of older age and high numbers of family social supports and, in Study 2, to low levels of mother-reported family stress in infancy. In addition, in Study 2, the combination of both low mother- and father-reported family stress in the preschool period constituted one of two paths to high sympathetic (PEP) reactivity.
Second, the signal detection analyses in Study 2 suggested that high levels of stress in early childhood may promote the development of exaggerated autonomic and adrenocortical reactivity. In Study 2, which included participants in very stressful family environments, high father-reported stress in the preschool period constituted the second path to high sympathetic (PEP) reactivity. Likewise, in Study 2, heightened adrenocortical activation was best predicted by very high levels of mother-reported stress in infancy, a finding commensurate with a prior report that the same stress measure was predictive of higher basal cortisol levels in preschool (Essex, Klein, Cho, & Kalin, 2002).
Third, both studies provided grounds for hypothesizing that relations between levels of support/adversity encountered by children in the first 5 years of life and development of high autonomic reactivity are curvilinear. In two of the analyses (HR reactivity in Study 1 and PEP reactivity in Study 2), the signal detection algorithms guided division of the samples into three groups, representing different levels of support/adversity in early childhood. In Study 1, these groups ranged from high support to moderate adversity. Consistent with the theory, the very low stress group displayed very high levels of HR reactivity, whereas the low and moderate stress groups displayed relatively muted reactivity. This L-shaped curve must be viewed with caution, however, because of the small number of participants in the very low and low stress cells.
The research design of Study 2 improved on Study 1 in several important respects that allowed for fuller exploration of the curvilinearity hypothesis. Specifically, a more even distribution of participants across the three family groups was obtained in Study 2; these groups encompassed a broader range of variation on the support–adversity dimension of family environments; and this variation was measured prospectively from infancy. Consistent with the theory, the data produced a U-shaped curve: the high stress group had the highest levels of PEP reactivity, followed by the low stress group, followed by the moderate stress group. Thus, in both studies, curvilinear relations emerged (as shown in Figures 2 and 3), and both quadratic effects were statistically significant. Although the PEP data afford a provisional empirical basis for hypothesizing that levels of support/adversity in early childhood have a U-shaped curvilinear influence on development of sympathetic reactivity, this hypothesis must be considered tentative. If each of the physiological measures of stress reactivity in Study 2 (i.e., MAP, HR, RSA, and cortisol activation), had displayed, as did PEP, the full curvilinear relation with family stress, then the curvilinearity hypothesis could be advanced with more confidence. When all of the current results are considered together, however, including up- and downregulatory effects across different markers of reactivity, the general picture that emerges is that of a U-shaped curvilinear relation between levels of support/adversity in early childhood and BSC.
The hypotheses suggested by both evolutionary–developmental theory and the current exploratory analyses might help to reconcile important contradictions in the stress reactivity literature. On the one hand, some previous studies have found that early childhood stress is associated with downregulatory changes in salient biological responses (see, e.g., Carlson & Earls, 1997; Gunnar & Vazquez, 2001). Both of the current studies provided additional evidence of such downregulatory effects. On the other hand, many past studies have found that experiences of family and environmental stress are associated with upregulatory calibrations in biological reactivity systems (e.g., De Bellis et al., 1999; Essex, Klein, et al., 2002; Yehuda, Halligan, & Grossman, 2001). Only the current Study 2 provided evidence of such upregulatory effects, although prior analyses from the WSFW have similarly demonstrated an association between early family stress and upregulation of children's adrenocortical axis (Essex, Klein, et al., 2002). Why did this imbalance occur in the current research? One answer may lie in the difficulty any single study confronts in subsuming the entire range of stressors and supports along which the U-shaped curve is based. Rather, single studies may represent empirical “windows” into portions of the U-shaped association between support/adversity and BSC, sliding left or right along the continuum of supportiveness and adversity, but rarely encompassing the entire range.
Thus, Study 1 sampled only a restricted range of variation on the support–adversity dimension of early childhood environments (see Figure 2). Of particular note is the observation that the most stressed group in Study 1 inhabited only moderately stressful environments and was, in fact, well within the range of normative familial and ecological adversities. Study 1 thus compared children whose early environments ranged from exceptionally stable and supportive to moderately stressful. Consistent with the theory, within this restricted range, greater stress and adversity were associated with reduced biological responsivity (although with a modest curvilinear trend showing approximately equal responsivity in the low and moderate stress groups). Referring to figure 3 from Boyce and Ellis (2005), Study 1 may have compared individuals from points C and D on the theoretical U-shaped curve. Other researchers who have found downregulatory effects of early stress on biological reactivity may also have been operating in this range.
Study 2, by contrast, sampled a broader range of variation on the support–adversity dimension of early childhood environments (see the current Figure 3). Of particular note is the finding that the high stress group did, in fact, inhabit very stressful home environments. Consistent with the theory, Study 2 documented both down- and upregulatory effects of early childhood stress on biological reactivity systems. As in Study 1, comparisons between individuals from points C and D on the U-shaped curve (high stability and support vs. moderate stress) showed downregulatory effects; conversely, comparisons between individuals from points A and B on the U-shaped curve (moderate vs. high stress) showed upregulatory effects (Figure 3). Other researchers who have found upregulatory effects of early stress on biological reactivity may also have been operating on this part of the curve.
Limitations and Future Directions
Quantitative methods
The signal detection analyses presented here were decidedly exploratory in character and were used as an additional, empirical method of generating rather than testing hypotheses. The analyses employed multiple predictors and multiple dependent variables and were carried out within two study samples. With so many analyses conducted, there was a high probability that at least some of the predictor variables would discriminate between high and lower reactivity groups on some of the dependent variables at least some of the time. Indeed, across all analyses, the signal detection algorithm made eight significant discriminations between high and lower reactivity groups based on the childhood predictor variables. It is important to emphasize, however, that any one of these eight discriminations could have operated against the theory. Specifically, there were six cases in which the signal detection algorithm identified subgroups of participants whose childhood stress levels varied in the range from very low to moderate. In all six cases, increasing stress levels were associated with downregulation of BSC. Conversely, there were two cases in which the algorithm identified subgroups of participants whose stress levels varied in the range from moderate to high. In both cases, increasing stress was associated with upregulation of BSC. Together, all eight discriminations were broadly consistent with the theory. The signal detection analyses thus empirically produced the same hypotheses that were conceptually derived from the argument of the first paper.
Research methods
Because of small sample sizes, the current research had limited power to detect the proposed curvilinear relations between levels of support/adversity encountered by children early in life and development of BSC. It is not surprising, therefore, that there was only clear evidence of curvilinearity in a minority of analyses. Given an appropriately wide range of variation in levels of support/adversity in early childhood environments, careful assessment of this variation from early in life, careful assessment of BSC, and a large sample size, the proposed U-shaped curves should reliably emerge.
Another limitation of the current research is that we did not assess changes in BSC during childhood. An adequate test of the hypothesis would involve measuring stress reactivity in infancy and then prospectively examining whether the magnitude of BSC changed in predicted directions over the course of early and middle childhood. This approach could be problematic, however, because assessments of stress reactivity in infancy generally display low test–retest reliability (Kagan, 1994).
Yet another important limitation of the current research was that it was not genetically informative; it is conceivable that relations between early family environments and BSC reflect gene–environment correlations. Consider the possibility that highly reactive individuals tend to avoid situations and activities that involve strong stimulation and arousal (as reviewed in Boyce and Ellis, 2005). Highly reactive parents could therefore plausibly pass on to their offspring both a genetic predisposition toward high reactivity and created or chosen environments that are relatively calm, stable, and supportive. Or consider the possibility that individuals who are genetically loaded for high reactivity provoke more stress and conflict in their families. It is difficult to imagine, however, how either of these behavioral genetic explanations could account for disproportionate numbers of reactive phenotypes occurring in both highly supportive and highly stressful family environments. Moreover, experimental manipulations of environmental stress have produced a U-shaped relation with stress reactivity in rodents: in comparison with normal controls, moderate early-life stress (i.e., “handling”) causes reductions in biological reactivity later in life, but severe early-life stress (i.e., prolonged maternal separations) causes marked increases in biological reactivity later in life (Anisman, Zaharia, Meaney, & Merali, 1998).
Still another limitation is that the current research did not distinguish satisfactorily either between the quality and quantity of stressors or between the biological modalities of stress reactivity. Further, measures of cardiovascular, autonomic, and adrenocortical reactivity were alternately used, in signal detection analyses, to identify predictors of generic “high reactivity phenotypes” from assessments of early childhood experience. It is plausible, however, that different forms or magnitudes of adversity are linked to regulatory changes in different biological systems. For example, multiple, recurring, and intensive stressors could be associated with heightened adrenocortical reactivity but diminished autonomic responses. Such differential effects would be consistent with the recent findings of Bauer, Quas, and Boyce (2002), who observed asymmetrical activations of the HPA axis and the sympathetic branch of the ANS among children with significant behavior problems.
Conclusion
In this second of a paired sequence of articles, we have empirically explored a particular theoretical position developed and advanced in the prior paper. These explorations produced a pattern of results that generally converge on the proposed curvilinear association between early support/adversity and stress reactivity. Further, the theory and data presented here suggest a plausible account for the paradoxical observation that early stressful experience appears capable of either augmenting or diminishing biological responses to challenge. We have proposed that heightened stress reactivity, a neuroendocrine predisposition toward exaggerated responsiveness to environmental stressors, is more usefully and parsimoniously regarded as BSC, a susceptibility to environmental influence with bidirectional effects on health and disorder. Such susceptibility, we claim, is produced by underlying psychobiological mechanisms that arose through natural selection, because they reliably increased the individual's capacity and tendency to survive (and ultimately reproduce) in ontogenetic environments characterized by extremes of either adversity or support. The two studies presented here, which provide provisional grounds for the proposed curvilinear relations between support/adversity in early childhood and measures of biological reactivity, are consistent with this claim.
What is pointedly and explicitly at issue here is the nature of stress reactivity itself and its origins and consequences within the lives of contemporary children. As we have previously discussed, the existing scientific zeitgeist is to regard high reactivity as an atavistic physiological phenomenon, a now maladaptive legacy of adaptation to ancient environments we no longer inhabit. We have argued, to the contrary, that heightened BSC may represent an evolved solution to the adaptive problems encountered by children reared in extreme environments. For children raised in conditions of extreme adversity, biological sensitivity may increase survival through heightened awareness of surrounding threats and challenges. For children raised in conditions of minimal adversity and extreme supportiveness, the same sensitivity may enhance developmental outcomes by allowing an exceptional “permeability” to the abundant resources available in such contexts. In shaping intervention strategies to prevent developmental psychopathology and other early morbidities, we may do well to consider this alternative conceptualization of individual differences in stress reactivity. Under some circumstances, highly sensitive children may be usefully “targeted” for interventions involving the provision of ancillary supportive services. In other settings, ascertainment of reactivity status might simply prevent the adoption of a “one size fits all approach, facilitating the design of strategies and policies specifically tailored to the needs of children with different biological response phenotypes. Whatever the future direct utility of the observations described here, it is our hope that this work will advance collective understanding of the sources of individual human differences and their implications for the rearing and well being of children.
References
REFERENCES
Abidin, R. R.
(1986).
Parenting Stress Index
(2nd ed.).
Charlottesville, VA:
Pediatric Psychology Press.
Ablow, J. C.,
Measelle, J. R.,
Kraemer, H. C.,
Harrington, R.,
Luby, J.,
Smider, N.,
Dierker, L.,
Clark, V.,
Dubicka, B,
Heffelfinger, A.,
Essex. M. J., &Kupfer,
D. J.
(1999).
The MacArthur Three-City Outcome Study: Evaluating multi-informant
measures of young children's symptomatology.
Journal of the American Academy of Child and Adolescent
Psychiatry
38,
1580–1590.CrossRefGoogle Scholar
Alkon, A.,
Goldstein, L. H.,
Smider, N.,
Essex, M.,
Kupfer, D., &
Boyce, W. T.
(2003).
Developmental and contextual influences on autonomic reactivity in
young children.
Developmental Psychobiology
42,
64–78.CrossRefGoogle Scholar
Allen, M. T., &
Matthews, K. A.
(1997).
Hemodynamic responses to laboratory stressors in children and
adolescents: The influences of age, race, and gender.
Psychophysiology
34,
329–339.
[Erratum p. 730]CrossRefGoogle Scholar
Anisman, H.,
Zaharia, M. D.,
Meaney, M. J., &
Merali, Z.
(1998).
Do early-life events permanently alter behavioral and hormonal
responses to stressors?
International Journal of Developmental Neuroscience
16,
149–164.Google Scholar
Barnett, R. C., &
Marshall, N. L.
(1989).
Preliminary manual for the role-quality scales.
Unpublished manuscript,
Wellesley College, Center for Research on Women.
Barr, C. S.,
Newman, T. K.,
Becker, M. L.,
Parker, C. C.,
Champoux, M.,
Lesch, K. P.,
Goldman, D.,
Suomi, S. J., &
Higley, J. D.
(2003).
The utility of the non-human primate model for studying gene by
environment interactions in behavioral research.
Genes, Brain, and Behavior
2,
336–340.CrossRefGoogle Scholar
Barr, C. S.,
Newman, T. K.,
Lindell, S.,
Shannon, C.,
Champoux, M.,
Lesch, K. P.,
Suomi, S. J.,
Goldman, D., &
Higley, J. D.
(2004).
Interaction between serotonin transporter gene variation and rearing
condition in alcohol preference and consumption in female primates.
Archives of General Psychiatry
61,
1146–1152.CrossRefGoogle Scholar
Bauer, A. M.,
Quas, J. A., &
Boyce, W. T.
(2002).
Concurrent sympathetic and adrenocortical activity as predictors of
behavior in middle childhood.
Unpublished manuscript.
Belsky, J.,
Steinberg, L., &
Draper, P.
(1991).
Childhood experience, interpersonal development, and reproductive
strategy: An evolutionary theory of socialization.
Child Development
62,
647–670.CrossRefGoogle Scholar
Bennett, A. J.,
Lesch, K. P.,
Heils, A.,
Long, J. C.,
Lorenz, J. G.,
Shoaf, S. E.,
Champoux, M.,
Suomi, S. J.,
Linnoila, M. V., &
Higley, J. D.
(2002).
Early experience and serotonin transporter gene variation interact
to influence primate CNS function.
Molecular Psychiatry
7,
118–122.CrossRefGoogle Scholar
Berntson, G. G.,
Quigley, K. S.,
Jang, J., &
Boysen, S. T.
(1990).
A conceptual approach to artifact identification: Application to
heart period data.
Psychophysiology
27,
568–598.Google Scholar
Block, J. H.
(1965).
The Child-Rearing Practices Report (CRPR).
Berkeley, CA:
University of California, Institute of Human Development.
Boyce, W. T.,
Alkon, A.,
Tschann, J. M.,
Chesney, M. A., &
Alpert, B. S.
(1995).
Dimensions of psychobiologic reactivity: Cardiovascular responses to
laboratory stressors in preschool children.
Annals of Behavioral Medicine
17,
315–323.CrossRefGoogle Scholar
Boyce, W. T.,
Chesney, M.,
Alkon–Leonard, A.,
Tschann, J.,
Adams, S.,
Chesterman, B.,
Cohen, F.,
Kaiser, P.,
Folkman, S., &
Wara, D.
(1995).
Psychobiologic reactivity to stress and childhood respiratory
illnesses: Results of two prospective studies.
Psychosomatic Medicine
57,
411–422.CrossRefGoogle Scholar
Boyce, W. T., &
Ellis, B. J.
(2005).
Biological sensitivity to context: I. An
evolutionary–developmental theory of the origins and functions of
stress reactivity.
Development and Psychopathology
17,
271–301.Google Scholar
Boyce, W. T.,
Essex, M.,
Woodward, H. R.,
Measelle, J. R.,
Ablow, J. C., &
Kupfer, D. J.
(2002).
The confluence of mental, physical, social and academic difficulties
in middle childhood: I. Exploring the “headwaters” of early
life morbidities.
Journal of the American Academy of Child and Adolescent
Psychiatry
41,
580–587.CrossRefGoogle Scholar
Boyce, W. T.,
Jensen, E. W., &
James, S. A.
(1983).
The Family Routines Inventory: Theoretical origins.
Social Science & Medicine
17,
193–200.CrossRefGoogle Scholar
Boyce, W. T.,
O'Neill–Wagner, P.,
Price, C. S.,
Haines, M., &
Suomi, S. J.
(1998).
Crowding stress and violent injuries among behaviorally inhibited
rhesus macaques.
Health Psychology
17,
285–289.CrossRefGoogle Scholar
Boyce, W. T.,
Quas, J.,
Alkon, A.,
Smider, N.,
Essex, M., &
Kupfer, D. J.
(2001).
Autonomic reactivity and psychopathology in middle childhood.
British Journal of Psychiatry
179,
144–150.CrossRefGoogle Scholar
Brown, G. W., &
Davidson, S.
(1978).
Social class, psychiatric disorder of mother, and accidents to
children.
Lancet
February,
378–381.Google Scholar
Cacioppo, J. T.,
Berntson, G. G.,
Binkley, P. F.,
Quigley, K. S.,
Uchino, B. N., &
Fieldstone, A.
(1994).
Autonomic cardiac control. II. Noninvasive indices and basal
response as revealed by autonomic blockades.
Psychophysiology
31,
586–598.Google Scholar
Cacioppo, J. T.,
Berntson, G. G.,
Sheridan, J. F., &
McClintock, M. K.
(2000).
Multilevel integrative analyses of human behavior: Social
neuroscience and the complementing nature of social and biological
approaches.
Psychological Bulletin
126,
829–843.CrossRefGoogle Scholar
Cacioppo, J. T.,
Uchino, B. N., &
Berntson, G. G.
(1994).
Individual differences in the autonomic origins of heart rate
reactivity: The psychometrics of respiratory sinus arrhythmia and
preejection period.
Psychophysiology
31,
412–419.CrossRefGoogle Scholar
Carlson, M., &
Earls, F.
(1997).
Psychological and neuroendocrinological sequelae of early social
deprivation in institutionalized children in Romania.
Annals of the New York Academy of Sciences
807,
419–428.CrossRefGoogle Scholar
Carlson, R. D.
(1985).
Gesell School Readiness Test. In
D. Keyser &
R. Sweetland (Eds.),
Test critiques.
Kansas City, MO:
Test Corp of America.
Champoux, M.,
Hwang, L.,
Lang, O., &
Levine, S.
(2001).
Feeding demand conditions and plasma cortisol in socially-housed
squirrel monkey mother–infant dyads.
Psychoneuroendocrinology
26,
461–477.CrossRefGoogle Scholar
Chisholm, J. S.
(1999).
Death, hope and sex: Steps to an evolutionary ecology of mind and
morality.
New York:
Cambridge University Press.CrossRef
Chrousos, G. P.
(1998).
Stressors, stress, and neuroendocrine integration of the adaptive
response. The 1997 Hans Selye Memorial Lecture.
Annals of the New York Academy of Sciences
851,
311–335.Google Scholar
Coddington, R. D.
(1972).
The significance of life events as etiologic factors in the diseases
of children: II—A study of a normal population.
Journal of Psychosomatic Research
16,
205–213.CrossRefGoogle Scholar
De Bellis, M. D.,
Baum, A. S.,
Birmaher, B.,
Keshavan, M. S.,
Eccard, C. H.,
Boring, A. M.,
Jenkins, F. J., &
Ryan, N. D.
(1999).
A.E. Bennett Research Award. Developmental traumatology. Part I:
Biological stress systems.
Biological Psychiatry
45,
1259–1270.Google Scholar
DeLongis, A.,
Coyne, J. C.,
Dakof, G.,
Folkman, S., &
Lazarus, R. S.
(1982).
Relationship of daily hassles, uplifts, and major life events to
health status.
Health Psychology
1,
119–136.Google Scholar
DeLongis, A.,
Folkman, S., &
Lazarus, R. S.
(1988).
The impact of daily stress on health and mood: Psychological and
social resources as mediators.
Journal of Personality and Social Psychology
54,
486–495.CrossRefGoogle Scholar
Eisenberg, N.,
Fabes, R. A.,
Bustamante, D.,
Mathy, R. M.,
Miller, P. A., &
Lindholm, E.
(1988).
Differentiation of vicariously induced emotional reactions in
children.
Developmental Psychology
24,
237–246.CrossRefGoogle Scholar
Essex, M. J.,
Boyce, W. T.,
Goldstein, L. H.,
Armstrong, J. M.,
Kraemer, H. C., &
Kupfer, D. J.
(2002).
The confluence of mental, physical, social, and academic
difficulties in middle childhood: II. Developing the MacArthur Health
& Behavior Questionnaire.
Journal of the American Academy of Child and Adolescent
Psychiatry
41,
588–603.Google Scholar
Essex, M. J.,
Klein, M. H.,
Cho, E., &
Kalin, N. H.
(2002).
Maternal stress beginning in infancy may sensitize children to later
stress exposure: Effects on cortisol and behavior.
Biological Psychiatry
52,
776–784.CrossRefGoogle Scholar
Ewart, C. K., &
Kolodner, K. B.
(1991).
Social competence interview for assessing physiologic reactivity in
adolescents.
Psychosomatic Medicine
53,
289–304.CrossRefGoogle Scholar
Gold, P. W., &
Chrousos, G. P.
(2002).
Organization of the stress system and its dysregulation in
melancholic and atypical depression: High vs low CRH/NE states.
Molecular Psychiatry
7,
254–275.CrossRefGoogle Scholar
Gold, P. W.,
Goodwin, F. K., &
Chrousos, G. P.
(1988).
Clinical and biochemical manifestations of depression. Relation to
the neurobiology of stress.
New England Journal of Medicine
319,
348–353.Google Scholar
Gunnar, M. R., &
Vazquez, D. M.
(2001).
Low cortisol and a flattening of expected daytime rhythm: Potential
indices of risk in human development.
Development and Psychopathology
13,
515–538.CrossRefGoogle Scholar
Halberstadt, A. G.
(1986).
Family socialization of emotional expression and non-verbal
communication style and skills.
Journal of Personality and Social Psychology
51,
827–836.CrossRefGoogle Scholar
Higley, J. D.,
Thompson, W. W.,
Champoux, M.,
Goldman, D.,
Hasert, M. F.,
Kraemer, G. W.,
Scanlan, J. M.,
Suomi, S. J., &
Linnoila, M.
(1993).
Paternal and maternal genetic and environmental contributions to
cerebrospinal fluid monoamine metabolites in rhesus monkeys (Macaca
mulatta).
Archives of General Psychiatry
50,
615–623.CrossRefGoogle Scholar
Hofer, M. A.
(1994).
Early relationships as regulators of infant physiology and
behavior.
Acta Paediatrica Supplement
397,
9–18.CrossRefGoogle Scholar
Hyde, J. S.,
Klein, M. H.,
Essex, M. J., &
Clark, R.
(1995).
Maternity leave and women's mental health.
Psychology of Women Quarterly
19,
257–285.CrossRefGoogle Scholar
Jensen, E.,
James, S., &
Boyce, W.
(1983).
The Family Routines Inventory: Development and validation.
Social Science & Medicine
17,
210–211.CrossRefGoogle Scholar
Kagan, J.
(1994).
Galen's prophecy.
New York:
Basic Books.
Kagan, J.,
Reznick, J. S., &
Snidman, N.
(1988).
Biological bases of childhood shyness.
Science
240,
167–171.CrossRefGoogle Scholar
Kamarck, T. W.,
Jennings, J. R.,
Debski, T. T.,
Glickman–Weiss, E.,
Johnson, P. S.,
Eddy, M. J., &
Manuck, S. B.
(1992).
Reliable measures of behaviorally-evoked cardiovascular reactivity
from a PC-based test battery: Results from student and community
samples.
Psychophysiology
29,
17–28.CrossRefGoogle Scholar
Kanner, A. D.,
Feldman, S. S.,
Weinberger, D. A., &
Ford, M. E.
(1987).
Uplifts, hassles, and adaptational outcomes in
preadolescents.
Journal of Early Adolescence
7,
371–394.CrossRefGoogle Scholar
Kaufman, A. S., &
Kaufman, N. L.
(1983).
Kaufman Assessment Battery for Children.
Circle Pines, MN:
American Guidance Service.
Kirschbaum, C., &
Hellhammer, D. H.
(1994).
Salivary cortisol in psychoneuroendocrine research: Recent
developments and applications.
Psychoneuroendocrinology
19,
313–333.CrossRefGoogle Scholar
Kraemer, H. C.
(1992).
Evaluating medical tests: Objective and quantitative
guidelines.
Newbury Park, CA:
Sage.
Manuck, S. B.,
Kasprowicz, A. L., &
Muldoon, M. F.
(1990).
Behaviorally-evoked cardiovascular reactivity and hypertension:
Conceptual issues and potential associations.
Annals of Behavioral Medicine
12,
17–29.CrossRefGoogle Scholar
Matthews, K. A.,
Woodall, K. L., &
Stoney, C. M.
(1990).
Changes in and stability of cardiovascular responses to behavioral
stress: Results from a four-year longitudinal study of children.
Child Development
61,
1134–1144.CrossRefGoogle Scholar
McEwen, B. S.
(1998).
Protective and damaging effects of stress mediators.
New England Journal of Medicine
338,
171–179.CrossRefGoogle Scholar
McEwen, B. S.
(2000).
The neurobiology of stress: From serendipity to clinical
relevance.
Brain Research
886,
172–189.CrossRefGoogle Scholar
Meaney, M. J.
(2001).
Maternal care, gene expression, and the transmission of individual
differences in stress reactivity across generations.
Annual Review of Neuroscience
24,
1161–1192.CrossRefGoogle Scholar
Monaghan, J. H.,
Robinson, J. O., &
Dodge, J. A.
(1979).
The children's life events inventory.
Journal of Psychosomatic Research
23,
63–68.CrossRefGoogle Scholar
Moos, R.,
Insel, P., &
Humphrey, B.
(1974).
Family environment scale: Preliminary manual.
Palo Alto, CA:
Consulting Psychologists Press.
Murphy, J. K.,
Alpert, B. S.,
Willey, E. S., &
Somes, G. W.
(1988).
Cardiovascular reactivity to psychological stress in healthy
children.
Psychophysiology
25,
144–152.CrossRefGoogle Scholar
Nachmias, M.,
Gunnar, M. R.,
Mangelsdorf, S.,
Parritz, R. H., &
Buss, K.
(1996).
Behavioral inhibition and stress reactivity: The moderating role of
attachment security.
Child Development
67,
508–522.CrossRefGoogle Scholar
Park, M., &
Menard, S.
(1987).
Accuracy of blood pressure measurement by the Dinamap monitor in
infants and children.
Pediatrics
79,
907–914.Google Scholar
Porges, S. W.
(1995).
Orienting in a defensive world: Mammalian modifications of our
evolutionary heritage. A polyvagal theory.
Psychophysiology
32,
301–318.Google Scholar
Radloff, L. S.
(1977).
The CES-D scale: A self-report depression scale for research in the
general population.
Applied Psychological Measurement
1,
385–401.CrossRefGoogle Scholar
Rubin, K. H.
(1988).
The Social Problem-Solving Test—Revised.
Unpublished manuscript,
University of Waterloo.
Sallis, J. F.,
Broyles, S. L.,
Nader, P. R.,
Buono, M. J.,
Abramson, I. S.,
Patterson, T. L., &
Nelson, J. A.
(1991).
Blood pressure reactivity to exercise: Stability, determinants,
family aggregation, and prediction.
Journal of Developmental and Behavioral Pediatrics
12,
162–170.CrossRefGoogle Scholar
Sapolsky, R. M.,
Romero, L. M., &
Munck, A. U.
(2000).
How do glucocorticoids influence stress responses? Integrating
permissive, suppressive, stimulatory, and preparative actions.
Endocrine Reviews
21,
55–89.Google Scholar
Sarason, I. G.,
Levine, H. M.,
Basham, R. B., &
Sarason, B. R.
(1983).
Assessing social support: The Social Support Questionnaire.
Journal of Personality and Social Psychology
44,
127–139.CrossRefGoogle Scholar
Spielberger, C. D.
(1988).
Manual for the State-Trait Anger Expression Inventory
(STAXI).
Odessa, FL:
Psychological Assessment Resources.
Suomi, S. J.
(1991).
Early stress and adult emotional reactivity in rhesus
monkeys. In
G. R. Bock &
J. Whelan (Eds.),
The childhood environment and adult disease (pp.
171–188).
Chichester:
Wiley.
Suomi, S. J.
(1997).
Early determinants of behaviour: Evidence from primate
studies.
British Medical Bulletin
53,
170–184.CrossRefGoogle Scholar
Swets, J. A., &
Pickett, R. M.
(1982).
Evaluation of diagnostic systems: Methods from signal detection
theory.
New York:
Academic Press.
Tooby, J., &
Cosmides, L.
(1990).
On the universality of human nature and the uniqueness of the
individual: The role of genetics and adaptation.
Journal of Personality
58,
17–67.CrossRefGoogle Scholar
Yehuda, R.,
Halligan, S. L., &
Grossman, R.
(2001).
Childhood trauma and risk for PTSD: Relationship to
intergenerational effects of trauma, parental posttraumatic stress
disorder, and cortisol excretion.
Development and Psychopathology
13,
733–753.CrossRefGoogle Scholar
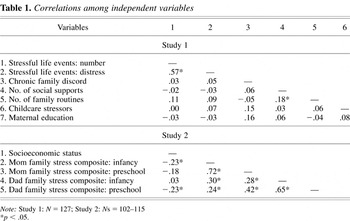
Correlations among independent variables
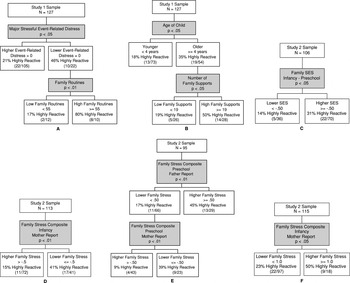
Signal detection analyses of high reactivity residual scores (top quartile). (A) HR (Study 1: Preschool Health Study), (B) MAP (Study 1: Preschool Health Study), (C) HR (Study 2: WSFW), (D) MAP (Study 2: WSFW), (E) PEP (Study 2: WSFW), and (F) salivary cortisol (Study 2: WSFW).
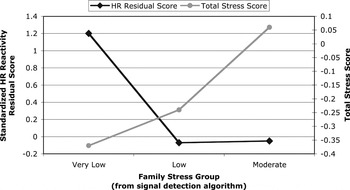
A one-way analysis of variance for standardized HR reactivity residual scores by the level of family stress (Study 1, N = 127).
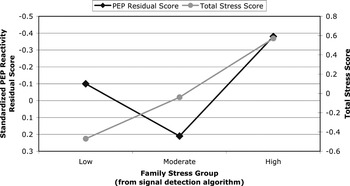
A one-way analysis of variance for standardized PEP reactivity residual scores by the level of family stress (Study 2, N = 95).
 You have
Access
- 268
- Cited by