Introduction
Over the past decades it has become clear that prokaryotes are an important component of marine plankton communities, playing a key role in mediating a broad range of biogeochemical cycles (Azam Reference Azam1998) and representing the largest pool of living biomass in the sea (Gasol et al. Reference Gasol, del Giorgio and Duarte1997). Bacterioplankton taxonomic composition is believed to result from selective environmental factors, such as resources availability, the physical environment and selective loss factors, and changes in assemblage structure are probably more pronounced in regions with strong gradients (Pedrós-Alió Reference Pedrós-Alió2006). The community composition is reflected in the degradative and productive patterns in a given ecosystem because bacteria affiliated to different groups can express different metabolic requirements (Cottrell & Kirchman Reference Cottrell and Kirchman2003). For these reasons, water masses characterized by different features (organic matter content, quality and age, physical properties, loss factors, etc.) are thought to be inhabited by structurally different prokaryotic assemblages with diverse patterns of activity.
Most of the research aimed to establish whether a difference in the composition of assemblages occurs in distinct water masses, is carried out in estuarine areas where the freshwater plume affects the overall bacterial composition by carrying riverine taxa into the marine community (e.g. Celussi & Cataletto Reference Celussi and Cataletto2007). Within the marine realm, only a few studies have specifically analysed the differences occurring between different water masses. Blümel et al. (Reference Blümel, Süling and Imhoff2007), for example, while investigating the phylogenetic diversity of Bacteroidetes in the east Mediterranean Sea concluded that different water mass properties determined the specific distribution of the communities and likewise, in the North Sea, Riemann & Middelboe (Reference Riemann and Middelboe2002) found remarkable differences in bacterial and viral community structures when crossing a shallow front between two water masses.
Recently, many studies have focused on the relationship between prokaryotic metabolism in different water masses within a geographically limited area. In the Ionian Sea (central Mediterranean), for example, Zaccone et al. (Reference Zaccone, Monticelli, Seritti, Santinelli, Azzaro, Boldrin, La Ferla and Ribera d’Alcalà2003) reported that prokaryotic activity (respiration, degradation and production) may be related to the age and origin of given water masses. Similarly, in the North Atlantic Ocean several authors found a close correlation between prokaryotic assemblages/activity (with particular focus on Archaea) and specific water masses (e.g. Teira et al. Reference Teira, Lebaron, van Aken and Herndl2006, Baltar et al. Reference Baltar, Arístegui, Gasol, Hernández-León and Herndl2007).
In the Southern Ocean several studies have examined the latitudinal trend of surface bacterioplankton assemblages from the temperate to the ice edge zones (Simon et al. Reference Simon, Glöckner and Amann1999, Massana et al. Reference Massana, Pedrós-Alió, Casamayor and Gasol2001, Abell & Bowman Reference Abell and Bowman2005). By using different approaches, these researchers found strong differences between bacterial communities collected in different hydrologically identified zones (nutrient limited temperate zone, Polar Front, Antarctic Circumpolar Current, ice edge zone, etc.), with special attention on the Polar Front as an important barrier for many planktonic populations (Karl Reference Karl1993). However, in the Ross Sea no attempt to study the bacterial community distribution in relation to different water masses has yet been done. Studies on the Ross Sea hydrological dynamics (e.g. Gordon et al. Reference Gordon, Codispoti, Morrison, Millero, Jennings and Sweeney2000, Budillon et al. Reference Budillon, Cordero and Salusti2002) and ecosystem variability (Carlson et al. Reference Carlson, Hansell, Peltzer and Smith2000, Ducklow et al. Reference Ducklow, Carlson, Church, Kirchman, Smith and Steward2001, Bergamasco et al. Reference Bergamasco, Defendi, Del Negro and Umani2003, Umani et al. Reference Umani, Monti, Bergamasco, Cabrini, De Vittor, Burba and Del Negro2005) have dramatically increased over the last few years. Surface and subsurface dynamics are heavily influenced by the local atmosphere and ocean interactions as well as by ice and sea ice freezing and melting processes, but the dynamics of the entire column are subjected to large-scale currents and characteristic processes such as hypersaline and super-cooled dense water formation, intrusion and the transformation of Circumpolar Deep Water (CDW). New efforts have been devoted to understanding small-scale processes such as shelf water formation or down slope flows (Bergamasco et al. Reference Bergamasco, Defendi, Zambianchi and Spezie2002) which can have a strong impact on large-scale processes. Water masses which are characteristic of the studied area can be identified and classified according to Stover (Reference Stover2006) and Jacobs et al. (Reference Jacobs, Fairbanks and Horibe1985) as:
1) Antarctic surface waters characterized by temperatures higher than the freezing point and relatively lower salinity (34.2–34.4), due to ice melting, formed during the summer.
2) High Salinity Shelf Water (HSSW), identified by salinities > 34.78 and low temperatures. Strong air-sea fluxes and katabatic winds events, especially during wintertime, produce intense fast sea ice formation; the associated intense wind removes the newly formed ice from the coastlines, thus the process can persist. The rejected brine increases the salinity of the subsurface waters, forming the HSSW. Newly formed HSSW fills up basins like the Drygalski Basin, where it is stored. Even if the main flow moves northward along the Victoria Land coast ending up in a slope overflow in the Cape Adare area joining the Antarctic Bottom Waters (AABW), a significant southward transport below the Ross Ice Shelf cavity has been observed. HSSW contributes to Ice Shelf Water (ISW) formation, supplying an important salt input (MacAyeal Reference MacAyeal1985, Jacobs et al. Reference Jacobs, Fairbanks and Horibe1985).
3) Ice Shelf Water (ISW), which is identified by temperatures below the surface freezing point. Ross Ice Shelf basal melting and freezing processes occurring in the cavity, together with HSSW mixing processes and increasing pressure, lower the seawater freezing point resulting in an outflow of a super cold plume emerging at a depth of 400 m.
4) Circumpolar Deep Water (CDW), characterized by a density between 27.98 and 28.27, the most voluminous water mass carried by the Antarctic Circumpolar Current, flows in the Ross Gyre, reaches the continental slope and, at the shelf-break, is entrained by the overflowing denser shelf waters (HSSW and ISW) forming the AABW.
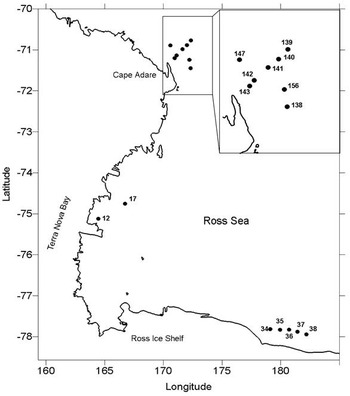
The aim of this work was to establish if differences in bacterioplankton assemblages and their metabolic requirements occur within the different main Ross Water masses. Bacterial community structures, prokaryotic carbon production, protease, phosphatase, β-glucosidase and lipase activity were analysed at 15 stations located in the Cape Adare area, in the Terra Nova Bay polynya and in the southernmost part along the Ross Ice Shelf coast.
Material and methods
Sampling strategies
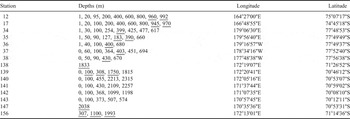
The sampling was performed during the 2006 XXI Italian Expedition in Antarctica on the RV Italica. We investigated several stations in the Ross Sea located in different areas: the Terra Nova Bay polynya, the Cape Adare, and the Ross Ice Shelf areas (Fig. 1; Table I).
Sampling stations in the Ross Sea.

Sampling stations, depth and coordinates. Microbial activities were analysed at every depth; bacterial assemblages structure was analysed at the underlined depths.

Hydrological casts and water samplings used a SBE 9/11 Plus CTD equipped with different sensors (double temperature and conductivity sensors, oxygen, light transmission, fluorescence, pH) coupled with a SBE 32 Carousel sampler, carrying 24 Niskin bottles of 12 litres each. Temperature and conductivity sensors were calibrated before and after the cruise at the SACLANTCENTRE of La Spezia, Italy. During the cruise, the CTD temperature was controlled by means of two SIS RTM 4200 digital reversing platinum thermometers and with an Autosal Guildline 8400b model Salinometer. The major sensors used have the following ranges and accuracy: pressure 0/10 000, 1.56 psi; temperature -5/+35, 0.002°C; conductivity 0/7, 0.0003 S m-1; oxygen 0/15, 0.1 ml l-1.
Biological samples were collected where a defined signal of given water mass was found (see Introduction for details).
Microbial activities
Extracellular enzymatic activities were assayed on board using fluorogenic substrate analogues (Hoppe Reference Hoppe1993) derived from 7-amino-4-methyl-coumarin (AMC) and 4-methyl-umbelliferone (MUF). Leucine aminopeptidase activity (AMA) was assayed as the hydrolysis rate of leucine-AMC. β-glucosidase (BGLU), lipase and alkaline phosphatase (APA) were assayed using MUF-β-D-glucoside, MUF-oleate and MUF-phosphate, respectively. Enzyme activities were expressed in terms of the rate of MUF or AMC production. After evaluation of the saturating concentrations, hydrolysis was measured by incubating 2.5 ml sub-samples with 200 μM MUF-β-D-glucoside, leucine-AMC, 100 μM MUF-oleate and 50 μM MUF-phosphate for 3–6 h in the dark at in situ temperature (max. dev. ± 2°C). All samples were run in five replicates and values represent their mean ± a standard deviation < 10%. Fluorescence increase due to MUF and AMC hydrolysed from the model substrates was measured using a Shimadtzu RF-1501 spectrofluorometer (MUF = 365 nm excitation and 455 nm emission; AMC = 380 nm excitation and 440 nm emission). Standard solutions of MUF and AMC were used to perform calibration curves.
Prokaryotic Carbon Production (PCP) was measured by the incorporation of 3H-leucine (Kirchman et al. Reference Kirchman, K’nees and Hodson1985). Triplicate 1.7 ml aliquots and two killed controls (90 μl 100% trichloracetic acid - TCA) were amended with a 20 nM radiotracer and incubated at in situ (±2°C) temperature in the dark. Incubations were stopped with 100% TCA after 5 h. The extraction with 5% TCA and 80% ethanol was carried out using the microcentrifugation method (Smith & Azam Reference Smith and Azam1992). Activity in the samples was determined by a β-counter (Packard Tri-Carb 300) after the addition of 1 ml scintillation cocktail (Ultima Gold MV; Packard).
Bacterial community structures
After prefiltration through 20 μm nylon screens, 1 l aliquots were filtered onto 47 mm Ø, 0.2 μm polyethersulphone membrane filters (Supor 200, PALL Corporation) and the filters were frozen at -20°C until DNA extraction, which was then performed on 1/4 filter slices according to Boström et al. (Reference Boström, Simu, Hagström and Riemann2004). Bacterial 16S rRNA genes were PCR-amplified using a reverse universal primer complementary to position 517–534 (5′-ATT ACC GCG GCT GCT GG-3′) and a forward bacterial primer complementary to position 341–358 plus a GC clamp (5′-CGC CCG CCG CGC GCG GCG GGC GGG GCG GGG GCA CGG GGG GCC TAC GGG AGG CAG CAG-3′) as previously described (Celussi et al. Reference Celussi, Paoli, Bernardi Aubry, Bastianini and Del Negro2008a). A total of two (samples collected within the HSSW/AABW vs ISW and samples collected within the CDW vs ISW) Denaturing Gradient Gel Electrophoresis (DGGE) were run as follows. 500 ng of PCR product were loaded on 8% polyacrylamide gels (acrylamide:N,N′-methylenebisacrylamide 37:1) containing denaturant gradients of 30–70%, top to bottom (where 100% is defined as 7 M urea and 40% vol/vol formamide). Electrophoresis was performed with a hot bath DGGE unit (CBS Scientific, Del Mar, CA) using 0.5 X TAE running buffer (20 mM Tris, 10 mM acetate, 0.5 mM Na2EDTA, pH 8.2) at 60°C for 16 hr at 85 V. Gels were stained for 1 h in SYBR Gold nucleic acid stain (Molecular Probes) and photographed with UV transillumination. Each sample was first run in triplicate (PCR products from three different reactions) and then used for community structure analysis if a Sørensen Index ≥ 0.98 among replicates was detected. DGGE banding patterns were used to determine prokaryotic community structure. Bands in different lanes corresponding to the same Operational Taxonomic Unit (OTU) were identified by using the EquiBands applet (Huber & Peduzzi Reference Huber and Peduzzi2004) and band patterns were turned into a presence/absence matrix. The polyacrylamide gel slices containing the bands of interest were excised using a sterile scalpel and eluted in 100 μl of MilliQ water. An overnight incubation at -20°C followed by a freeze-thaw cycle was then performed before 1 μl of elution was re-amplified using the same primer set without the GC clamp. PCR products were then purified using the QIAquick PCR purification kit (Qiagen) according to the supplier’s instructions. Samples were sequenced using ABI Prism Big Dye dye-terminator chemistry (Applied Biosystems) at the ‘BMR Genomics’ facility at the Padova University (www.bmr-genomics.it) and sequences were aligned to known sequences in the GenBank database using BLAST (Altschul et al. Reference Altschul, Madden, Schaffer, Zhang, Zhang, Miller and Lipman1997). All sequences were submitted to the RDP program CHECKCHIMERA to identify possible chimeras within the 16S sequences. Sequences have been deposited in GenBank under the accession numbers from FJ620832 to FJ620874.
Statistical analyses
The matrixes of DGGE banding patterns were analysed with the Primer5 v 5.2.9 (Plymouth Marine Laboratory, UK) program using cluster analysis performed calculating the Bray-Curtis similarity coefficient for all pairs of samplings. Clusters were formed using the group average linkage method between similarities. Variation in community composition between water masses was subsequently tested for significance with an ANOSIM (analysis of similarity) using the same software. ANOSIM tests a priori-defined groups (subgroupings obtained by the cluster analysis) against random groups in ordinate space. The RANOSIM statistic values, generated by ANOSIM in PRIMER, are a relative measure of separation of the a priori-defined groups. A zero (0) indicates that there is no difference among groups, while a one (1) indicates that all samples within groups are more similar to one another than any samples from different groups
Principal Component Analysis (PCA), performed with the same software, was applied to the microbial activities dataset. This multivariate analysis rotates a cloud of data points such that the maximum variability is visible in order to identify the most important gradients. All the datasets were standardized for the analysis by subtracting the mean and dividing by the standard deviation.
Results and discussion
Hydrology and microbial activities
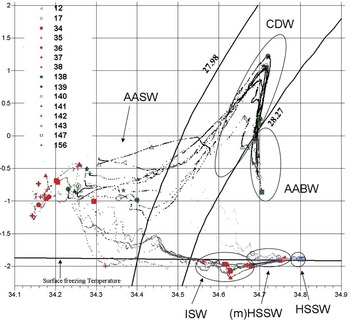
Figure 2 shows the θ/S diagram of the water column at each sampled station. Six characteristic water masses can be identified:
θ/S diagram showing the characteristic water masses. The legend indicates the name of the stations. In blue are reported the Terra Nova Bay stations, in red the Ross Ice Shelf stations and in green the Cape Adare area stations. Larger symbols indicate the sampling points.

1) AASW characterized by temperatures generally higher than the freezing point and a density lower than 27.98.
2) HSSW identified by salinities > 34.78 and temperatures near the surface freezing point, dominating the bottom layers of the TNB polynya area.
3) the modified HSSW (mHSSW) characterized by temperatures near the surface freezing point and salinities between 34.66 and 34.78 which were represented both by the intermediate layers between the surface and the HSSW in the Terra Nova Bay area (waters which are getting saltier before becoming HSSW) and by the bottom layers of the Ross Ice Shelf stations waters deriving from the Terra Nova Bay HSSW which reach the Ross Ice Shelf area and are not cold enough to be defined as ISW.
4) ISW identified by temperatures lower than the surface freezing point and salinities ranging from 34.5 to 34.7 which occupied the intermediate water column of the Ross Ice Shelf area.
5) CDW corresponding to a density between 27.98 and 28.27 and a temperature generally > 0°C and characterizing the meso- and bathypelagic of the Cape Adare area.
6) AABW with densities > 28.27 and temperatures higher than -1°C which were found in the bathypelagic of the Cape Adare area.
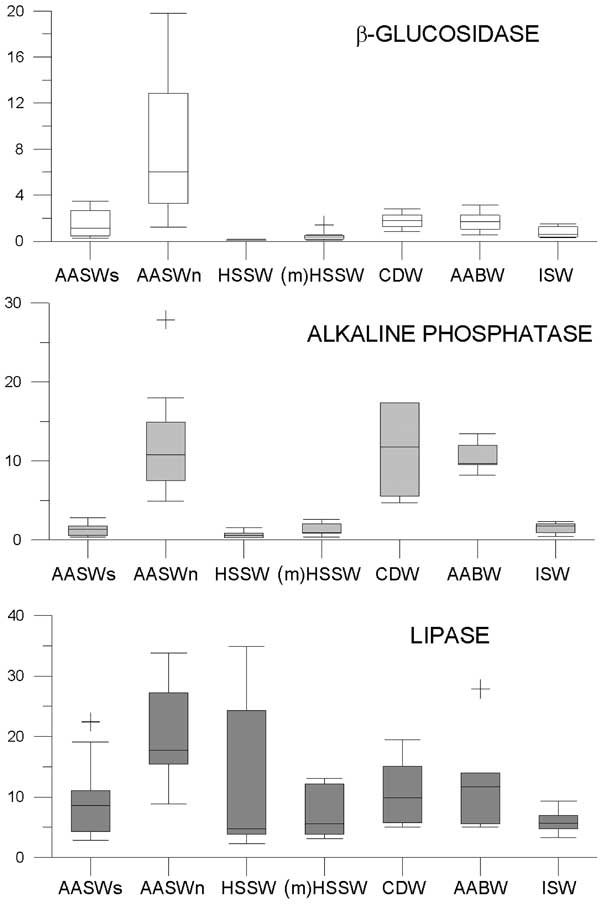
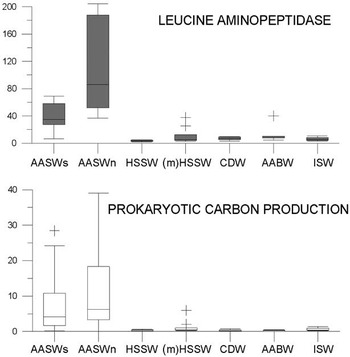
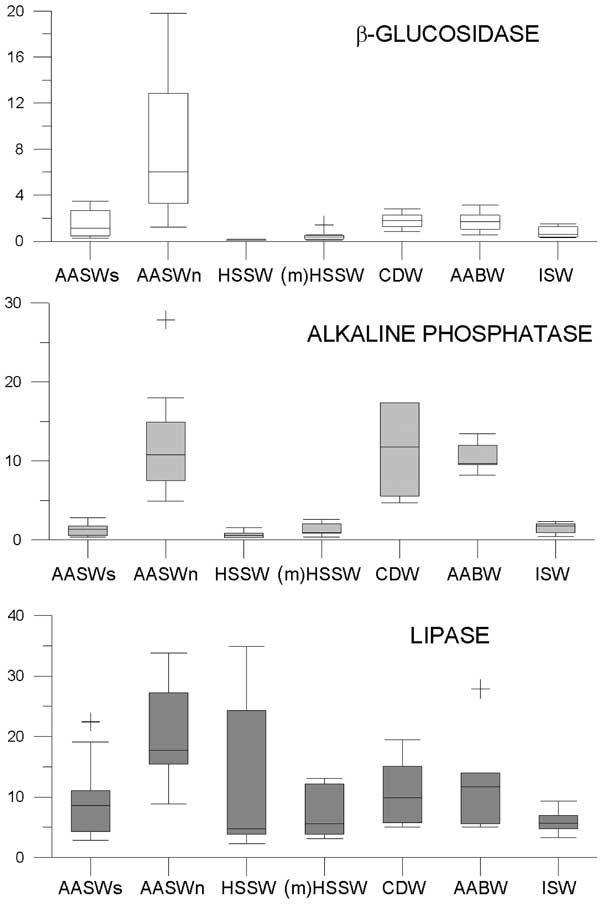
All the microbial activity values are reported in Figs 3 & 4 as box plots. Since we found significantly different activity patterns in the AASW according to the geography (t-test for BGLU P < 0.01, for APA P < 0.001, for lipase P = 0.001, for AMA P < 0.01), we divided these samples into north Antarctic Surface Waters (AASWn - comprising the station in the Cape Adare area) and south AASW (AASWs - referring to the Terra Nova Bay and Ross Ice Shelf areas). Generally AASW are characterized by low summer salinities due to ice melting. In this period the stability of the water column as a consequence of the lowered surface density is responsible for massive algal blooms especially in the southern sector of the Ross Sea (Umani et al. Reference Umani, Accornero, Budillon, Capello, Tucci, Cabrini, Del Negro, Monti and De Vittor2002, Reference Umani, Monti, Bergamasco, Cabrini, De Vittor, Burba and Del Negro2005, Povero et al. Reference Povero, Castellano, Ruggieri, Monticelli, Saggiomo, Chiantore, Guidetti and Cattaneo-Vietti2006). The high biological activity was found to enhance the total particulate matter content (Capello et al. Reference Capello, Budillon, Ferrari and Tucci2004) and reduce the inorganic nutrients concentrations, which can, in some particular cases, be exhausted by the primary productivity in certain inner parts during summer (Catalano et al. Reference Catalano, Benedetti, Predonzani, Goffart, Ruffini, Rivaro and Falconi1999 and references therein). Despite these rare cases however, in the Ross Sea nutrient concentrations are never normally limiting for biological activities (Catalano et al. Reference Catalano, Povero, Fabiano, Benedetti and Goffart1997) as evidenced by generally low APA rates found by many authors (e.g. Monticelli et al. Reference Monticelli, La Ferla and Maimone2003, Celussi et al. Reference Celussi, Paoli, Crevatin, Bergamasco, Margiotta, Saggiomo, Umani and Del Negro2009b). In general, in our dataset, the highest prokaryotic activities were found in the AASW and particularly at the northern stations. The Cape Adare area is in fact characterized by a lower trophic status with respect to the Ross Ice Shelf and the Terra Nova Bay ones and this is reflected in a major prokaryotic effort in degrading high molecular weight organic compounds in order to obtain low molecular weight molecules to be taken up. Through the ectoenzymatic activity pool it is possible to infer the organic matter quality, as enzymes are usually used to obtain products which are not easily available in the environment. In fact, in the Ross Sea a close relationship between the ectoenzymatic pool and the organic matter composition was previously found (Fabiano et al. Reference Fabiano, Povero and Misic1999, Misic et al. Reference Misic, Povero and Fabiano2002). Thus, in the AASWs, during our investigation, a higher load of labile organic matter and inorganic P can be assumed and was reflected in a generally low degradative activity. On the contrary, in the AASWn a high demand for monosaccharides, amino acids, phosphoesters, and phosphates affected the prokaryotic community. Only two exceptions occurred in the AMA and PCP analyses which had the absolute maxima in the AASWs, but were treated as outliers and were not shown in the box plots (204.5 nM h-1 and 39.0 pmol l-1 h-1, respectively). Although some “high” PCP values were found in the AASWn dataset, the median value is not substantially different from the AASWs one, highlighting generally similar leucine uptake rates in all AASW. In this environment the carbon uptake was always ≤ 1% of the one potentially mobilised by AMA, indicating how a huge amount of energy is spent in order to gain new carbon sources. It is possible that the environmental conditions such as substrate or temperature (Celussi et al. Reference Celussi, Balestra, Fabbro, Crevatin, Cataletto, Umani and Del Negro2008b) strongly affected the community by lowering the enzymes affinity and thus their efficiency.
Boxplots of β-glucosidase, alkaline phosphatase and lipase in different water masses in the Ross Sea. All values are expressed in nM h-1. The median values (-), the first (□) and third (□) quartile, the minimum (-) and maximum (-) values and the outliers (+) are shown. AASWs, n = 20; AASWn, n = 10; HSSW, n = 8; (m)HSSW, n = 10; CDW, n = 8; AABW, n = 7; ISW, n = 10.
Boxplots of leucine aminopeptidase (values expressed in nM h-1) and Prokaryotic Carbon Production (values expressed in pmol l-1 h-1) in different water masses in the Ross Sea. The median values (-), the first (□) and third (□) quartile, the minimum (-) and maximum (-) values and the outliers (+) are shown. AASWs, n = 20; AASWn, n = 10; HSSW, n = 8; (m)HSSW, n = 10; CDW, n = 8; AABW, n = 7; ISW, n = 10.

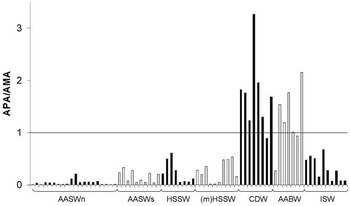
In general, we did not found any dramatic difference between the ‘deep’ water masses in terms of activity with lower values with respect to AASW both in terms of degradative rates and secondary production, although lipase showed a broad range of activity in most of the cases (except in the ISW), especially in the HSSW (from 3.8 to 34.9 nM h-1). Some peculiarities were also be found in the CDW and in the AABW. In these samples high hydrolysis rates (when compared to the other water masses) were devoted to degrading polysaccharides and phosphorilated molecules. Similarly to their surface counterpart (AASWn), these water masses would be characterized by lower monosaccharides and phosphates content. These water bodies are long segregated and are usually characterized by low oxygen concentration and high nutrient content (Catalano et al. Reference Catalano, Benedetti, Predonzani, Goffart, Ruffini, Rivaro and Falconi1999 and references therein). Furthermore, even though the slope overflow in the Cape Adare area periodically ventilates these deep waters (Bergamasco et al. Reference Bergamasco, Defendi, Budillon and Spezie2004 and references therein), by adding some newly synthesized organic matter, they are likely to contain refractory organic material which is not easy to hydrolyse and requires a higher degradation effort (found here in the BGLU dataset). The APA/AMA ratio (Fig. 5) indicates that these two water masses were the only ones in which the microbial community experienced a higher P need, with values > 1 (Sala et al. Reference Sala, Karner, Arin and Marrasé2001). Notwithstanding the higher inorganic P requirements, our data did not show a proper P-limitation (APA:AMA values slightly > 1 do not indicate this status), indirectly confirming the relatively high nutrient content characterizing these waters (Catalano et al. Reference Catalano, Benedetti, Predonzani, Goffart, Ruffini, Rivaro and Falconi1999).
APA/AMA ratios in the samples collected within different water masses.

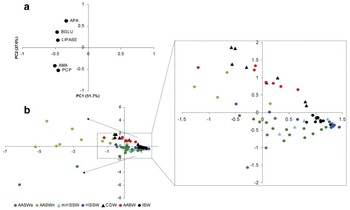
A general interpretation of these results is rather complex, consequently the patterns of microbial activities (APA, BGLU, LIPASE, AMA and PCP) were analysed using a PCA which showed a helpful distribution of variables into new linear combinations (PC). Only PCs with eigenvalues greater than one were considered. PC1 + PC2 explained 79.3% of the total variance (Fig. 6a). PC1 was found to be negatively related to all microbial activities, whereas PC2 discriminated two subsets of variables: APA + BGLU + LIPASE (positive relation) and AMA + PCP (negative relation). In the diagram of PC1 vs PC2 (Fig. 6b) the new scores highlighted a pronounced overlap among the different water masses, as an indication of small differences. However, two main gradients can be identified. Both these gradients start from a system where degradative and production rates are both extremely low, comprising ISW and some samples collected in the (m)HSSW and HSSW. A first gradient characterizes AASWn, CDW and AABW with phosphatase, lipase and glycolytic activities increasing towards the surface. A second gradient shows increasing protease and leucine uptake mainly within AASWs and (m)HSSW. As mentioned above, in the first case a higher need for monomeric sugars, phosphates and lipids was identified, whereas a higher leucine uptake and polypeptides degradation characterized the second gradient. Interestingly, this division also reflects the geography of the water bodies in the Ross Sea. The first gradient affected the northern stations while the second identified the southern sites. One aspect which typically characterizes these zones is the trophic status, with more productive systems in the south (Povero et al. Reference Povero, Castellano, Ruggieri, Monticelli, Saggiomo, Chiantore, Guidetti and Cattaneo-Vietti2006). On the other hand, the northern stations are the only ones which are outside the Ross Sea shelf break, and thus affected by a very different hydrodynamism. Whether this difference is to be attributed to the “latitude” or the in-shelf/out-shelf systems is still not clear.
Results of the Principal Component Analysis applied to microbial activities. a. The biplots of the projection of the rotated variables, and b. the sampling cases on the component-plane described by the first and the second principal components and the percentage variance for each component are indicated.

When dealing with deep samples one must take into account that decompression prior to measuring production and hydrolysis might lead to a stimulation or an inhibition of prokaryotic activity. There is evidence that deep water prokaryotic activity is overestimated if measured under decompressed conditions (Jannasch & Wirsen Reference Jannasch and Wirsen1982). However, most of the studies on compressed samples report inhibition of compounds’ uptake (Patching & Eardly Reference Patching and Eardly1997) and hydrolysis (Tamburini et al. Reference Tamburini, Garcin, Ragot and Bianchi2002) because of decompression. In any case, the compressed samples’ activity under/over estimation is restricted to 2–5-fold. Even though our activity data cannot be considered as in situ measurements, we think that an indication of the magnitude of biogeochemical processes meant as a pattern of activities can still be assumed.
Bacterial community structure
In this study we used denaturing gradient gel electrophoresis (DGGE) coupled with sequencing of separated 16S rRNA gene fragments because this technique can rapidly highlight the major variations occurring between samples and determine the dominant members of the assemblages. It has also demonstrated that DGGE can be more powerful than other fingerprinting methods (i.e. clone libraries) for comparing microbial assemblages over time and space (Castle & Kirchman Reference Castle and Kirchman2004 and references therein). DGGE and other fingerprinting techniques are suitable for highlighting the changes in microbial assemblages which occur in areas with strong gradients (in this case water masses characterized by different physical and (bio-)chemical features) because they detect the most abundant taxa (and not the rare biosphere) which carry out most ecosystem functions (Pedrós-Alió Reference Pedrós-Alió2006, Baltar et al. Reference Baltar, Arístegui, Gasol, Hernández-León and Herndl2007).
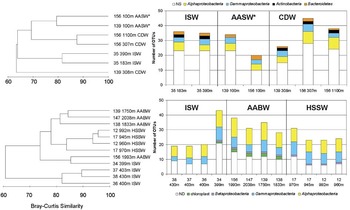
Samples for bacterial community structure analysis were collected at some selected stations and depths. The cluster analysis performed on the presence/absence matrixes and the related dendrograms separated, on a Bray-Curtis similarity of 70, from two to three subclusters in all the DGGEs (see Fig. 7 for details). In the HSSW/AABW vs. ISW case, two clusters were formed generally separating the samples collected in the ISW from those collected in the HSSW and AABW with the only exception of stn 34 399 m (ISW) which was grouped with a deep Cape Adare station. Community structures differed significantly in the comparisons between water masses (RANOSIM = 0.58, P < 0.05). In the case of CDW vs ISW the two samples belonging to the ISW formed a cluster, whereas the CDW samples at stn 156 and the surface waters close to the upper limit of the CDW (both in stn 139 and 156) were grouped together. Surprisingly, the mesopelagic at stn 139 had a very peculiar community with respect to the others and formed a separate cluster. In this case the separation into subclusters had a significance level of RANOSIM = 0.42 and P < 0.1. The formation of distinct subclusters which separate assemblages collected in different water masses confirms the major role of the physico-chemical environment in shaping the bacterial community structure as previously noted by others at lower latitudes (e.g. Baltar et al. Reference Baltar, Arístegui, Gasol, Hernández-León and Herndl2007). Previous investigations highlighted such differences in the structure of prokaryotic assemblages in the Southern Ocean. In the Antarctic Peninsula area Murray et al. (Reference Murray, Preston, Massana, Taylor, Blakis, Wu and DeLong1998) detected pronounced changes in bacterial and archaeal ribotype structure related to hydrological patterns and Church et al. (Reference Church, DeLong, Ducklow, Karner, Preston and Karl2003) found different percent contributions of Bacteria and Archaea to the total prokaryotic community in the meso- and bathypelagic layers of the CDW. At the opposite side of the continent West et al. (Reference West, Obernosterer, Zemb and Lebaron2008) reported striking differences within a naturally fertilized region with respect to a close high-nutrient low-chlorophyll scenario but they did not focus on the hydrological features of the water column (i.e. water masses detection).
Cluster analysis dendrograms (left) of the 2 DGGE fingerprints performed calculating the Bray-Curtis similarity coefficient for all pairs of samples (clusters were formed using the group average linkage between similarities) and numbers of DGGE derived OTUs attributed to different taxa according to the 16S rDNA sequences in each sample (right). An asterisk indicates the proximity of two AASW samples to the underlying Circumpolar Deep Water. NS = not sequenced.

Since every water mass has its own ‘identity’, being characterized by specific physico-chemical properties, age and organic matter content/composition, it is reasonable to expect that specialized prokaryotic assemblages inhabit these environments. Changes in microbial community structure can be a reflection of different strategies adopted to utilize particulate and dissolved organic molecules, leading to a higher efficiency in the remineralization of refractory material within meso- and bathypelagic water masses (Arístegui et al. Reference Arístegui, Gasol, Duarte and Herndl2009). Approximately 20 DGGE bands were excised from each gel to determine the phylogenetic composition of the assemblages. The most evident result is that 1) samples collected within different water masses do not differ substantially from a phylogenetic composition point of view, and 2) a clear dominance of Proteobacteria over the other groups was found in every sample (Fig. 7). Antarctic waters are known to be characterized by a high number of Alpha- and Gammaproteobacteria (Murray & Grzymski Reference Murray and Grzymski2007) which, especially in surface waters, are associated with high percentages of members of the Bacteroidetes group (Abell & Bowman Reference Abell and Bowman2005) and studies on the Ross Sea bacterial community structure basically confirm this general composition (Gentile et al. Reference Gentile, Giuliano, D’Auria, Smedile, Azzaro, De Domenico and Yakimov2006, Celussi et al. Reference Celussi, Paoli, Crevatin, Bergamasco, Margiotta, Saggiomo, Umani and Del Negro2009b). The high structural similarity found between HSSW and AABW is reflected in the phylogenic composition of these water bodies. Given the high presence of Alpha- and Gammaproteobacteria, in these samples we detected the presence of a Betaproteobacteria ribotype. The presence of this subgroup (typical of freshwaters) in the Ross Sea was previously reported both by Gentile et al. (Reference Gentile, Giuliano, D’Auria, Smedile, Azzaro, De Domenico and Yakimov2006) and Celussi et al. (Reference Celussi, Paoli, Crevatin, Bergamasco, Margiotta, Saggiomo, Umani and Del Negro2009b) and the former hypothesized a relationship between its presence and a sewage system in Rod Bay (Terra Nova Bay). Retrieving members of this group in deep (HSSW and AABW) and offshore (AABW) station would rather suggest that Betaproteobacteria constitute a very small fraction (only one band was found in the samples) of the bacterial community in the whole basin. In the AABW we also found 16S rDNA genes belonging to chloroplasts from eukaryotes, as previously reported (Celussi et al. Reference Celussi, Cataletto, Umani and Del Negro2009a). The HSSW is generated in the very productive Terra Nova Bay and we hypothesize that a large amount of these organelles are carried to the bottom waters both by sedimentation and by an active downwelling of the dense water mass (HSSW). The deep northward flowing of the HSSW and its consequent slope overflow to the AABW would carry a signal of these genes to the deep Cape Adare area. The absence of 16S genes from plastids in the HSSW DGGE bands suggests that in this water mass they do not constitute a major group (with respect to the others), even though they are probably present, and an accumulation of these genetic markers would thus occur in the deeper AABW. Surprisingly, a very small contribution of Bacteroidetes was detected in both gels. This phylogenetic subdivision is often associated with newly produced organic products in phytoplanktonic bloom conditions (Kirchman Reference Kirchman2002). Their presence in the Ross Sea deeper layers can be limited in terms of diversity because of a relatively limited content of fresh organic matter (Arístegui et al. Reference Arístegui, Gasol, Duarte and Herndl2009), confirming the low number of ribotypes previously found (Celussi et al. Reference Celussi, Cataletto, Umani and Del Negro2009a). However, even if we found little of this group, this does not mean that they are not present. We processed only the brightest bands in the gels, implying that Bacteroidetes-related ribotypes may be present in minor abundance with respect to other taxa.
Very different numbers of OTUs were found in the ISW analysed in the two gels. This water mass has two cores, the Shallow and the Deep ISW, located at different depths in the water column due to their different densities (Jacobs et al. Reference Jacobs, Fairbanks and Horibe1985). In the ISW vs CDW gel samples from the Shallow ISW were used, whereas in the ISW vs HSSW/AABW gel amplicons from the Deep ISW were run. It is likely that the differences found between the gels are at least partly due to this diversification and possibly because the shallow core of this water mass is more subjected to the particle flux from the Ross Ice Shelf (Accornero et al. Reference Accornero, Bergamasco, Monaco and Tucci1999).
Acknowledgements
This work was supported by the CLIMA and the POLAR DOVE projects of the Italian National Programme for Antarctic Research. The authors would like to thank the captain and the crew of the RV Italica for their assistance. E. Crevatin is kindly acknowledged for analytical support and H.A. Russell for language revision. We thank C. Comici, A. Gerecht, C. Manno and C. Morreale for their helpful contribution. We are grateful to three anonymous referees for their review comments and suggestions on the manuscript.