Introduction
Species richness and abundance generally increases towards the equator (Lomolino et al., Reference Lomolino, Riddle and Brown2006) with overall bee pollination services depending on fewer species in colder climates (see Schleuning et al. (Reference Schleuning, Fründ, Klein, Abrahamczyk, Alarcón, Albrecht, Andersson, Bazarian, Böhning-Gaese and Bommarco2012)). However, the species richness of Bombus (Hymenoptera: Apidae) does not decline with latitude (Loken, Reference Loken1973; Heinrich, Reference Heinrich2004) which means the number of Bombus species in the overall bee species pool increases proportionally to the north (Loken, Reference Loken1973; Berg, Reference Berg2000; Heinrich, Reference Heinrich2004; Madsen & Calabuig, Reference Madsen and Calabuig2012; Martin, Reference Martin2014).
While cultivated fields are highly disturbed and transient habitats, semi-natural field margins provide a more durable environment of food resources and nesting habitat for bees and other invertebrates (Duelli et al., Reference Duelli, Blank and Frech1991; Lagerlöf et al., Reference Lagerlöf, Stark and Svensson1992). Wild bees can spill over from semi-natural borders into the field (Marshall et al., Reference Marshall, West and Kleijn2006; Holzschuh et al., Reference Holzschuh, Steffan-Dewenter and Tscharntke2010) and pollinate crops. Differences between groups of pollinators in the ability to move into crop fields may be affected by their mobility and requirements in semi-natural habitats. For example, non-central place foragers such as hoverflies (Jauker et al., Reference Jauker, Diekötter, Schwarzbach and Wolters2009) may easily track temporal and spatial variation in resources between and within fields. For central-place foragers, such as bees, maximum foraging distance determines the length of foraging trips (Bell, Reference Bell1990; Cresswell et al., Reference Cresswell, Osborne and Goulson2000) and thus the possibility to pollinate crops at different distances to nesting habitat (Lonsdorf et al., Reference Lonsdorf, Kremen, Ricketts, Winfree, Williams and Greenleaf2009). Foraging range is positively related to body size in wild bees (Gathmann & Tscharntke, Reference Gathmann and Tscharntke2002). Solitary wild bees have a maximum foraging range of 150–1400 m and the average foraging range of many is less than 500 m (Gathmann & Tscharntke, Reference Gathmann and Tscharntke2002; Zurbuchen et al., Reference Zurbuchen, Landert, Klaiber, Müller, Hein and Dorn2010c ). In contrast honeybees and the larger bumblebees can fly up to 6000 m and regularly forage at 1000–1500 m from the nest (Walther-Hellwig & Frankl, Reference Walther-Hellwig and Frankl2000). This may results in abundance and species richness varying spatially within fields and thus species composition of bees in crop fields in general.
Many crops, such as strawberry, oilseed rape, tomato, sunflower and watermelon, depend on pollination for producing high yield (Kremen et al., Reference Kremen, Williams and Thorp2002; Albano et al., Reference Albano, Salvado, Borges and Mexia2009a ; Garibaldi et al., Reference Garibaldi, Steffan-Dewenter, Kremen, Morales, Bommarco, Cunningham, Carvalheiro, Chacoff, Dudenhöffer, Greenleaf, Holzschuh, Isaacs, Krewenka, Mandelik, Mayfield, Morandin, Potts, Ricketts, Szentgyörgyi, Viana, Westphal, Winfree and Klein2011; Bommarco et al., Reference Bommarco, Marini and Vaissière2012). Wild bees may increase the resilience of crop pollination by complementing or replacing pollination by domesticated honeybees or bumblebees and have the ability to provide sufficient crop pollination services independent from honeybees (Garibaldi et al., Reference Garibaldi, Steffan-Dewenter, Winfree, Aizen, Bommarco, Cunningham, Kremen, Carvalheiro, Harder, Afik, Bartomeus, Benjamin, Boreux, Cariveau, Chacoff, Dudenhöffer, Freitas, Ghazoul, Greenleaf, Hipólito, Holzschuh, Howlett, Isaacs, Javorek, Kennedy, Krewenka, Krishnan, Mandelik, Mayfield, Motzke, Munyuli, Nault, Otieno, Petersen, Pisanty, Potts, Rader, Ricketts, Rundlöf, Seymour, Christof Schüepp, Szentgyörgyi, Taki, Tscharntke, Vergara, Viana, Wanger, Westphal, Williams and Klein2013). Wild bee pollination and subsequent increase in crop yield depends on abundance, visitation frequency (Klein et al., Reference Klein, Steffan-Dewenter and Tscharntke2003; Morandin & Winston, Reference Morandin and Winston2005; Vázquez et al., Reference Vázquez, Morris and Jordano2005) species diversity and functional diversity (Klein et al., Reference Klein, Steffan-Dewenter and Tscharntke2003; Fontaine et al., Reference Fontaine, Dajoz, Meriguet and Loreau2005; Hoehn et al., Reference Hoehn, Tscharntke, Tylianakis and Steffan-Dewenter2008). Pollinator species vary extensively in diet breadth (Fussell & Corbet, Reference Fussell and Corbet1992; Goulson & Darvill, Reference Goulson and Darvill2004), flight period and body size (Michener, Reference Michener2000). The body size of bees is closely related to the tolerance of ambient temperatures (Heinrich & Heinrich, Reference Heinrich and Heinrich1983; Stone & Willmer, Reference Stone and Willmer1989; Heinrich, Reference Heinrich2004) foraging range (Walther-Hellwig & Frankl, Reference Walther-Hellwig and Frankl2000; Gathmann & Tscharntke, Reference Gathmann and Tscharntke2002) and within flower behaviour (Barrow & Pickard, Reference Barrow and Pickard1984; Stout, Reference Stout2000; Hoehn et al., Reference Hoehn, Tscharntke, Tylianakis and Steffan-Dewenter2008). These and other species traits found in wild bee assemblages determine the functional diversity and contribution to overall pollination services.
Insect pollination can improve strawberry shape and quality (Free & Williams, Reference Free and Williams1976; Klatt, Reference Klatt2013) and increase the fruit set by 25% (Delaplane & Mayer, Reference Delaplane and Mayer2000). Some wild bees pollinate strawberries in the field as well as in greenhouses and tunnels (De Oliveira et al., Reference De Oliveira, Savoie and Vincent1990; Wilkaniec & Radajewska, Reference Wilkaniec and Radajewska1996; Paydas et al., Reference Paydas, Eti, Kaftanoglu, Yasa and Derin1998; Albano et al., Reference Albano, Salvado, Duarte, Mexia and Borges2009b ). In addition, fruit quality increases if honeybees and wild bees co-occur, because of the differences between species in their within flower behaviour (Chagnon et al., Reference Chagnon, Ingras and Oliveira1993).
Different wild bee communities will pollinate strawberries grown in different geographical regions. To benefit wild bees and other important ecosystem service providers, farmers can adopt various strategies supported by the European Union, so-called Agri-Environmental Schemes (AES). One of the most common AES is organic farming which has been shown to benefit pollinator diversity and abundance (Ekroos et al., Reference Ekroos, Piha and Tiainen2008; Holzschuh et al., Reference Holzschuh, Steffan Dewenter and Tscharntke2008, Reference Holzschuh, Steffan-Dewenter and Tscharntke2010; Rundlöf et al., Reference Rundlöf, Nilsson and Smith2008) and also strawberry pollination (Andersson et al., Reference Andersson, Rundlöf and Smith2012). Smaller interventions that farmers can adopt without changing the growing system such as preserving hedgerows (Morandin & Kremen, Reference Morandin and Kremen2013) are possible but not as thoroughly evaluated. Hedgerows have a different vegetation structure and species composition compared with tree-less margins and the two different types of field borders may provide foraging and nesting habitat for different species of bees (Potts et al., Reference Potts, Vulliamy, Roberts, O'Toole, Dafni, Ne'eman and Willmer2005; Hannon & Sisk, Reference Hannon and Sisk2009). Different types of field borders may therefore differ in their spill-over of wild bees and in their contribution to pollination services in adjacent fields. Intensification of agriculture and loss of semi-natural habitats have resulted in large-scale loss of wild bee abundance and diversity (Kremen et al., Reference Kremen, Williams, Bugg, Fay and Thorp2004; Ricketts et al., Reference Ricketts, Regetz, Steffan Dewenter, Cunningham, Kremen, Bogdanski, Gemmill Herren, Greenleaf, Klein and Mayfield2008; Albano et al., Reference Albano, Salvado, Borges and Mexia2009a ; Holzschuh et al., Reference Holzschuh, Steffan-Dewenter and Tscharntke2010; Le Feon et al., Reference Le Feon, Schermann-Legionnet, Delettre, Aviron, Billeter, Bugter, Hendrickx and Burel2010). Hence, understanding what determines the variation of diversity and abundance of bees between and within fields is crucial to develop and conserve sustainable agriculture. Data on regional differences in wild bee community compositions and in particular how bees are spatially distributed in the landscape due to regional differences are almost completely missing. One of the reasons is the lack of coordination in choice of sampling methods among the various European studies (Goulson, Reference Goulson2003; Patiny et al., Reference Patiny, Rasmont and Michez2009; Potts et al., Reference Potts, Biesmeijer, Kremen, Neumann, Schweiger and Kunin2010).
Our aim is a better understanding of regional vs. local differences in the activity-density and community composition of wild bees in strawberry fields. We estimated how activity-density, species diversity and functional diversity varied in relation to: (i) geographical region, (ii) location in the field (crop margin vs. centre) and (iii) margin type (hedge vs. grassy margin). We hypothesize that geographical regions will differ in activity-density and species diversity of bees with northern regions having lower activity-density and diversity of bees. Bee foraging range will affect within-field bee assemblages in three ways: (a) activity-density is higher at field margins than in field centre; (b) overall bee species richness is higher at field margins than in field centre and (c) larger bees are proportionally more abundant in field centre than in margins.
Materials and methods
Geographical regions and experimental fields
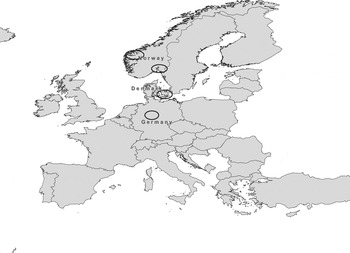
Strawberry fields from four different geographical regions on a north-south gradient of approximately 1100 km were used in this study: Göttingen, Germany (three fields); Slagelse, Denmark (three fields); Frogn, South-Norway (two fields) and Valldal, Mid-Norway (four fields) (fig. 1). We standardized local conditions of strawberry fields by conducting the survey at peak flowering, in the earliest flowering strawberry variety in each geographical region. Sampling in Germany and Denmark took place in fields growing Honeoye and in both Norwegian regions the fields used grew Korona. Each field had both a hedgerow and a mown grass margin bordering different sides of the field. Hedges were defined as a linear element with a shrubby, woody structure commonly known as hedge for the prevailing country. Therefore, hedgerow structure, appearance and species composition differed between countries. Fields selected for study within a geographical region had the same strawberry variety and they were separated by at least 2 km to be considered as independent. Approximate size of fields in Denmark and Germany were 150 × 200 m2 and in Norway 100 × 50 m2.
Map of the study regions.

Sampling of bees
Bees were collected using pan traps during spring and early summer 2011. Three sets of pan traps were placed in each strawberry field with each set consisting of three differently coloured traps with the inside bowl painted, respectively, a UV-white, a UV-yellow and a UV-white and green. One set of traps was placed in the field centre, another set 3 m into the crop parallel to the grassy margin (referred to throughout the paper as grass margin position) and the final set 3 m from and parallel with the hedge margin (referred to throughout the paper as hedge position). To reduce the number of bees being attracted by the traps into the field, the outside bowl of all the traps were painted green and traps were positioned at plant height (with 3 m distance from one another) directly among the plants in the row. Full sampling period was 5 days from 12 to16 May in Germany, 10 days in Denmark from 7 to 17 May, 15 days in South-Norway from 26 May to 10 June and 10 days in Mid-Norway from 18 to 27 June. Duration of trapping was allowed to differ between regions to increase sample size as captures were low in all regions except Germany. Bee specimens were determined to species level (table 1) and voucher specimens were deposited at the Department of Plant and Environmental Sciences, Faculty of Science, University of Copenhagen. Honeybees were included in all analyses except when bumblebees and solitary bees were analysed separately. The probability of an insect being caught in a trap is a function of the trap diameter and colour, the bees’ activity and the species’ abundance (Obrist & Duelli, Reference Obrist and Duelli2010). Sampling of individuals using pan traps thus represents bee activity-density during sampling and we will use this term in the rest of the paper to describe our sampling of individuals.
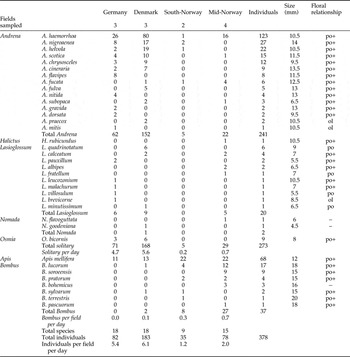
Summary of species and total number of individuals collected in this study including estimated average body size of the individual species and their floral relationship: po = polylectic; po+ = polylectic known to forage in Rosaceae; ol = oligolectic that does not forage in Rosaceae.

Size of bee species
To assess standard body size of the collected bee species, we averaged the sizes given in Fauna Helvetica for the species under the genera: Andrena (Scheuchel, Reference Scheuchel2000), Halictus, Lasioglossum (Amiet et al., Reference Amiet, Herrmann, Müller and Neumeyer2001), Nomada (Amiet et al., Reference Amiet, Herrmann, Müller and Neumeyer2007) and Osmia (Amiet et al., Reference Amiet, Herrmann, Müller and Neumeyer2004). For species of Bombus we averaged sizes for queens and for workers, using the smallest value of the size interval given for queens in Hammer & Nørgaard Holm (Reference Hammer and Nørgaard Holm1970).
Temperature measurements
Temperature was recorded hourly, using data loggers (iButton®, Texas, USA) which were placed at each field in an adjacent hedge. Two data loggers in Denmark and Mid-Norway were inoperable, respectively, so temperature data were only available from one field in Denmark and two fields in Mid-Norway.
Data analyses
All statistical analyses were performed using R, version 2.13.1 (R Development Core Team, 2012). Linear mixed effects models (Pinheiro & Bates, Reference Pinheiro and Bates2000) were fitted for all analyses except species richness and community similarity. For all models, residuals were inspected for heterogeneity and non-normality. Activity-density of solitary bees and body size of bees were log-transformed to meet model assumptions of normal distribution and homogeneity of variances. Full models included all effects and their interactions and were simplified by removing non-significant higher order interactions and non-significant effects (Bibby et al., Reference Bibby, Martinussen and Skovgaard2004). For all pairwise comparisons of means Tukey tests were used. Honeybees were included in all analyses unless otherwise specified.
To test the effects of region and within-field position on bee activity-density in total and separately on the three subgroups: all bumblebees, all solitary bees and honeybees, we used region, within-field position, trap colour and their interactions as fixed effects, while accounting for variations between fields in the given region in the random effects. As number of trap days and experimental fields differed between regions, activity-density data analysis was based on average catch per day per field. Effects on average body size of sampled bees were analysed using the region and within-field position of traps in the field as fixed factors and field site in the given region as random effect. Average size of bees was calculated for each position in the field. The temperatures recorded hourly every day from eight in the morning to six in the evening (corresponding to hours of bee activity during the specific sampling time of each region) were used to test for differences in ambient temperatures, which could affect bee activity during the day. Differences in ambient temperatures during sampling were tested by including region as fixed effect and experimental field site in the given region as random effect.
Species richness and community similarity
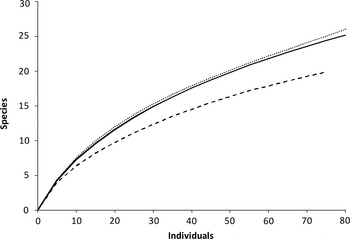
Data were rarefied to account for differences in the sampling effort between regions which were necessary to compare species richness between geographical regions and between within-field positions. Rarefaction calculates the expected number of species found at a given sample size within the limits of the total sample and produces a curve that is a plot of the number of species expected as a function of the number of individuals sampled (Magurran, Reference Magurran2004). A rarefaction of species richness data was performed within each region and each position in the field (across regions) and the resulting calculations were compared. We used 95% confidence limits to ascertain whether the regions and trap-positions differed in species richness (Magurran, Reference Magurran2004). The 95% confidence limits were calculated by doubling the standard errors provided by the rarefaction calculation (Cumming et al., Reference Cumming, Fidler and Vaux2007). If the confidence limits in the smaller sample size laid completely outside the confidence limits of the larger sample size, richness was considered to significantly differ between the two at the level of P ≈ 0.01 (Cumming et al., Reference Cumming, Fidler and Vaux2007). To compare the species composition between regions, we calculated the Morisita–Horn similarity index that is virtually independent of sample size and species richness (Wolda, Reference Wolda1981; Krebs, Reference Krebs1999) using the function Similarity Summary Table in the R-package Vegetarian (Charney & Record, Reference Charney and Record2009). The index varies from zero (no similarity) to one (complete similarity).
Results
Including honeybees, a total of 378 bees of 37 species and 7 genera were collected. Of these 361 individuals were from 29 polylectic species that forage on Rosaceae (table 1). Altogether 330 females and 48 males were sampled and of the 37 individuals of Bombus spp. sampled there were 31 workers, five queens and one male. The genus Andrena (Hymenoptera: Andrenidae) was common in all geographical regions and dominated the samples in the southern regions. Bombus (Hymenoptera: Apidae) was as frequent as Andrena in the northern study areas and virtually absent from Danish and German samples. The large majority of solitary bee species were soil-nesting (Genus: Andrena, Halictus and Lasioglossum (Michener, Reference Michener2000)) with only nine cavity-nesting individuals of the same species sampled altogether (Genus: Osmia, (Michener, Reference Michener2000)).
Effect of region and position in field on activity-density of all bees, solitary bees, bumblebees and honeybees
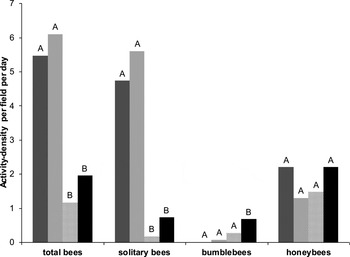
Neither trap position in the field nor the interaction between trap position and region had an effect on activity-density of all bees sampled, solitary bees, bumblebees or honeybees separately. Region had a significant effect on activity-density of all bees sampled, solitary bees and bumblebees individually but not on honeybees (fig. 2). There was no interaction between region, position in the field and trap colour. There was no effect of trap colour (UV-white, UV-yellow and UV-bicoloured) on total bee and bumblebee activity-density per day per field. UV-yellow traps caught significantly more individuals of solitary bee species than UV-white traps (Tukey test: UV-white trap vs. UV-yellow trap: z = 3.360, P = 0.002. UV-white trap vs. UV-bicoloured: z = −1.463, P = 0.309. UV-yellow trap vs. UV-bicoloured: z = 2.019, P = 0.108).
Activity-density per field per day compared between regions. Different letters above two bars in the bar chart indicate a significant statistical difference at the 5% level or below (linear mixed effect model). Dark grey bars: Germany, light grey bars: Denmark, striped bars: South-Norway, black bars: Mid-Norway.

Species richness
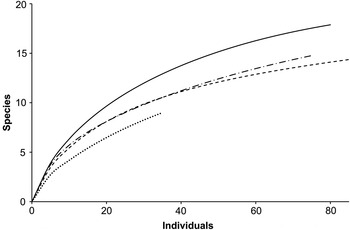
Germany had significantly higher species richness than the other regions (P ≈ 0.01). (Expected species richness with CIs at 30 individuals: Germany = 9.9–15; South-Norway = 6.8–9.0. Expected species richness with CIs at 75 individuals: Germany = 16.3–18.8; Mid-Norway = 13.9–15.7. Expected species richness with CIs at 80 individuals: Germany = 17.2–18.6; Denmark = 11.4–16.9) There was no significant difference between species richness in Denmark and the two Norwegian regions (fig. 3). Total species richness differed significantly (P ≈ 0.01) between margin and field centre with both types of margins (grass margin, hedge) having higher species richness than the centre of fields (Expected species richness with confidence intervals (CIs) at 75 individuals: grass margin: 23.4–26.8; hedge = 22.3–26.6; field centre = 19.2–20.5) (fig. 4). Species richness of solitary bees was also significantly higher (P ≈ 0.01) at both types of margins than in the field centre (expected species richness with CIs at 50 individuals: grass margin: 17–21.4; hedge = 16.6–20.6; field centre = 12.6–14.7). Too few bumblebees were caught to make a separate statistical comparison of the species richness of this genus. Denmark and Germany had the most similar species communities (table 2).
Rarefaction curves for regional bee species richness sampled in 2011. Germany (solid line), Denmark (dashed line), South-Norway (dotted line), Mid-Norway (long-dash-dot line). X-axis is individuals sampled, y-axis is mean number of species expected. The curve is a plot of the number of species expected as a function of the number of individuals sampled.

Rarefaction curves for species richness at three different trap-positions within the strawberry field. Field centre (dashed line), crop margin bordering grass strip (dotted line) and crop margin bordering hedge (solid line). X-axis is individuals sampled, y-axis is mean number of species expected. The curve is a plot of the number of species expected as a function of the number of individuals sampled.

Calculated Morisita–Horn index with standard errors.

Numbers in parentheses are the number of species the two compared regions share.
Body size
Regions significantly differed in the average size of bees, with bees being larger in both Norwegian regions compared with Denmark and Germany (Tukey test: Germany vs. Denmark: z = 0.396, P = 0.979. Germany vs. South-Norway: z = 3.767, P < 0.001. Germany vs. Mid-Norway: z = 3.781, P = 0.001. Denmark vs. South-Norway: z = 4.122, P < 0.001. Denmark vs. Mid-Norway: z = 4.204, P < 0.001. South-Norway vs. Mid-Norway: z = 0.637, P = 0.920). Bee size did not differ between within-field position of the trap.
Temperature
There was no significant difference in daily temperatures between regions during sampling. Average daily temperatures (08:00–18:00 h) during the study were: Mid-Norway: 14.1 ± 0.79 °C; South-Norway: 16.9 ± 0.93 °C; Denmark: 16.2 ± 0.59 °C and Germany: 17.4 ± 0.87 °C).
Discussion
North-south gradient in activity-density, species diversity and bee assemblage similarity
The wild bee activity-density, species diversity and community composition showed a north-south gradient, with Germany, the southernmost region, having significantly higher species richness than the other regions and Germany and Denmark having significantly higher activity-density of bees than South- and Mid-Norway. Thus, we found support for our hypothesis that both activity-density and species diversity is generally lower in northern regions. The Morisita–Horn index is nearly independent of species richness and is thus useful when comparing similarities in community compositions that differ in species richness. Denmark and Germany had by far the highest similarity in community compositions and South-Norway and Mid-Norway had the second highest similarity score. Higher similarities within the two northern and two southern regions indicate that species community composition also has a north-south gradient. As we found no significant difference in daily temperatures during sampling we assume that the differences found in activity-density among regions cannot be explained by temperature differences experienced in the study period. However, yearly differences in temperature between the regions may drive some of the differences in pollinator assemblages that we have found (Vahl & Humlum, Reference Vahl and Humlum1949; Cappelen & Jensen, Reference Cappelen and Jensen2001).
In all regions most of the species and individuals sampled were polylectic species that forage in Rosaceae (table 1) which indicate that a majority of the bees sampled may be a source of pollination for strawberries. Little is known of how males contribute to pollination but the sampled majority were females. Furthermore, unlikely pollinators of strawberry such as oligolectic species not specialized on Rosaceae and species from the parasitic genus Nomada represent only 19 individuals and thus a minority of the sample size. Honeybees were prominent in South-Norway, where they constituted 22–35 individuals of bees sampled and compared with the abundance of individual species of wild bees, honeybees were also abundant in Germany and Mid-Norway. Overall wild bees outnumbered honeybees. However, there may be annual and regional differences in the presence of honeybees in early flowering strawberries, depending both on what other flowering plants are found in the vicinity of the strawberry fields and the density of managed honeybee hives in the area. It was not possible to find strawberry fields in Denmark and Germany that did not have flowering oilseed rape fields nearby during sampling and this may have reduced honeybee abundance in these strawberry fields. Furthermore, honeybee response to pan trap stimuli is generally weak and our results may therefore also reflect an undersampling of honeybees in the strawberry field due to the use of pan traps (Grundel et al., Reference Grundel, Frohnapple, Jean and Pavlovic2011).
Solitary ground-nesting bees dominated southern samples
Significantly more individuals of solitary bees (dominated by the genus Andrena) were sampled in Germany and Denmark compared with in the Norwegian regions. Within each Norwegian region a similar number of solitary bees (also mainly Andrena) and bumblebees were sampled so the difference we found in solitary bee activity-density between northern and southern regions was driven by the generally higher activity-density of bees found in the southern regions. Ground-nesting bees (Genus: Andrena, Halictus, Lasioglossum (Michener, Reference Michener2000)) constituted the large majority of solitary bees sampled and as the majority of these were also polylectic species that forage in Rosaceae, ground-nesting bees may be important pollinators of early strawberries in all four regions. They have species-specific preferences for substrate characteristics such as vegetation cover and soil texture and moisture (Cane, Reference Cane1996) which can lead to aggregations of nests in high value nesting habitat (Michener, Reference Michener2000). Thus local disappearance of appropriate nesting habitat may have consequences for pollination services as it could lead to local extinction of such species and further loss of diversity (Cane, Reference Cane1996). In the regions we studied, management of undisturbed margins and areas surrounding the strawberry fields may thus require consideration in order to stabilize the population size and species richness of this group of wild bees.
Larger proportion of bumblebees to the north
Mid-Norway had significantly more bumblebees than South-Norway, Denmark and Germany leading to a larger average size of bees in northern compared with southern regions. Bumblebees generally have long foraging ranges, are active during a larger part of the day and in colder weather compared with other bees, which makes them reliable pollinators under unstable weather conditions (Corbet et al., Reference Corbet, Fussell, Ake, Fraser, Gunson, Savage and Smith1993; Heinrich, Reference Heinrich2004). Functional diversity can be more important for seed set than activity-density, as e.g., shown in pumpkin (Hoehn et al., Reference Hoehn, Tscharntke, Tylianakis and Steffan-Dewenter2008). Also, in strawberry, the co-occurrence of bees of different sizes can impact pollination and thus yield (Chagnon et al., Reference Chagnon, Ingras and Oliveira1993). Thus, the presence of bumblebees can increase the functional diversity of pollinator assemblages, which can be important for pollination services. The rarity of bumblebees in the south may lead to less effective pollination of early strawberries especially in cold weather. However, most northern species of bumblebees (Loken, Reference Loken1973) are active in early spring with a flight season overlapping with the flowering of early strawberries, which was the time of sampling. Bumblebees prefer some flower resources over strawberries (Free, Reference Free1968) and the rarity of bumblebees in early strawberries in Denmark and Germany may reflect a lack of preference for strawberries when there are other available flower resources such as oilseed rape fields.
Higher species diversity of bees in field margins than in field centre
We found significantly more bee species in field margins than in field centres. These results are similar to those of Morandin & Kremen (Reference Morandin and Kremen2013) who, in a study of crop margins bordering tomato fields in California's Central valley, found that both wild bee abundance and species richness decreased significantly with increasing distance from the margin. Although it has been argued that pan-traps gives the best overall indicator of bee species richness (Westphal et al., Reference Westphal, Bommarco, Carré, Lamborn, Morison, Petanidou, Potts, Roberts, Szentgyörgyi and Tscheulin2008), it has also been argued that pan-traps may result in biased sampling (Popic et al., Reference Popic, Davila and Wardle2013). In particular, the species gradient found across fields independent of any activity-density gradient could stem from oligolectic species that forage in the margin being attracted by the traps in the fields. However, we took great care avoiding traps attracting bees from a distance by painting the outside of bowls green. Furthermore, given the majority of bees sampled are known to forage in Rosaceae, it is likely that the gradient also reflects actual differences in species’ ability to reach the field centre. Future studies should attempt to also monitor flower visit frequencies.
The species richness gradient we found between field centre and field margins was driven by differences in the numbers of solitary bee species. Sample size of bumblebees was too low to do an analysis on this group alone; however, as bumblebees generally have larger foraging ranges than even large solitary bees, it is possible that bumblebee species richness does not decline towards the field centre at the field sizes tested (Walther-Hellwig & Frankl, Reference Walther-Hellwig and Frankl2000; Gathmann & Tscharntke, Reference Gathmann and Tscharntke2002). As field sizes in our study represent normal field sizes this again could mean that the field size affects spill-over of solitary bee species more than bumblebee species.
Activity-density and body size not affected by position in field
Although wild bee species diversity was higher in crop margins compared with field centres, activity-density and body size did not differ. This indicates that fewer species visited the field centre but the number of individuals of those species was sufficient to eliminate differences in activity-density between margin and centre. Distance can be of considerable importance for solitary bees. Increasing the foraging distance by a few hundred metres can e.g., have detrimental effects on individual bee fitness in terms of fewer completed brood cells per unit time (Zurbuchen et al., Reference Zurbuchen, Cheesman, Klaiber, Müller, Hein and Dorn2010b ). Solitary bees also tend to forage close to their nest (Zurbuchen et al. (Reference Zurbuchen, Bachofen, Müller, Hein and Dorn2010a , Reference Zurbuchen, Cheesman, Klaiber, Müller, Hein and Dorn b , Reference Zurbuchen, Landert, Klaiber, Müller, Hein and Dorn c )). The average size of bees sampled in the southern regions was fairly high with very little variation, despite the sample consisting almost exclusively of solitary species (table 1). Thus, it is possible that the spring active bees in the areas sampled are generally large enough to counter a spatial effect on size distribution in the fields.
A study in oilseed rape found wild bee species richness and abundance decreased and wild bee female body size increased from the field edge to the centre (Bailey et al., Reference Bailey, Requier, Nusillard, Roberts, Potts and Bouget2014). The rape seed fields were larger (200 m from edge to field middle) than the strawberry fields used in this study (25–100 m from edge to field middle, depending on the field). This suggests that the within-field pattern of wild bee species richness, abundance and body size may differ depending on field size with species richness responding at smaller scales than abundance and body size. However, trap catches in our study were relatively low and it is possible that a larger sample size would have revealed a pattern similar to that found in rape fields by Bailey et al. (Reference Bailey, Requier, Nusillard, Roberts, Potts and Bouget2014).
Conclusion
We found that species richness, but not activity-density, was lower at field centres compared with field margins, even in small fields. This suggests that the potential for increasing pollination through spill-over effects of pollinators from margins to the centre of the crop field might be limited to more mobile species. Strawberry need a high functional diversity to be fully pollinated (Klein et al., Reference Klein, Vaissiere, Cane, Steffan-Dewenter, Cunningham, Kremen and Tscharntke2007) and our results reflect the importance of field margin management and wild bee diversity for strawberry pollination. To fully understand the within-field patterns of wild bee body size, species diversity, activity-density and pollination potentials in agriculture, we would need studies on flower visitation frequencies in strawberries and further studies in other types of flowering crops. We further found that activity-density was higher in the southernmost regions. Northern regions with low activity-density and low species richness may then be more vulnerable to fluctuations in population size and more prone to experience reduced wild bee pollination services. However, as strawberries need both small and large bees to be fully pollinated (Chagnon et al., Reference Chagnon, Ingras and Oliveira1993) it is noteworthy that the proportion of large bees increased towards the north. The rarity of bumblebees and the dominance of ground-nesting bees in southern regions, at the time of early strawberry flowering, indicate that these intense agricultural areas may rely on fewer functional groups for pollination with possible consequences for yield potential. Wild bees differ to a large extent in their temperature tolerances and e.g., bumblebees can be active in colder weather. Thus, our study reveals questions on the consequences for the stability of strawberry pollination in a changing climate.
Acknowledgements
Thanks goes to Karin Westrum, Bioforsk, for identification of species of Bombus, to Jan Martin, University of Copenhagen, for assistance with trap design and construction. We also thank S. Schiele, University of Göttingen, for her essential assistance during fieldwork and Christian Ritz, Christian Bressen Pipper, Helle Sorensen and Anders Tolver, University of Copenhagen, for statistical advice. Finally, we are very grateful to all the farmers who let us have traps in their strawberry fields. This work has been funded by the University of Copenhagen, the German Research Foundation (DFG; TS 45/29-1), Bioforsk, The Swedish Research Council for Environment, Agricultural Sciences and Spatial Planning (FORMAS) and SAPES research environment.