1 Introduction
Benefit–cost analyses of criminal justice policies, early childhood education, at-risk youth programs, and other interventions that reduce crime have moved beyond the academic arena and have been used by both state and federal policymakers (Welsh et al., Reference Welsh, Farrington and Gowar2015). The Washington State Institute of Public Policy routinely assesses the benefits and costs of crime prevention strategies, and the Pew-MacArthur Results First Initiative Center works with various state governments in similar exercises. At the federal level, the National Institute of Justice now routinely calls for the inclusion of benefit–cost analyses in its funding guidelines for research and evaluation grants, and in 2012, the U.S. Department of Justice (DOJ) issued the final Regulatory Impact Assessment (RIA) of the Prison Rape Elimination Act – the first ever RIA of a criminal justice rule that included the intangible costs of crime in its regulatory analysis. Despite this growing interest in benefit–cost analysis, the most recent estimates of crime costs in the USA are more than 10 years old and often times based on crime data that are now 15–20 years old (Miller et al., Reference Miller, Cohen and Rossman1993, Reference Miller, Cohen and Wiersema1996; McCollister et al., Reference McCollister, French and Fang2010). Cost estimates are also typically limited to the major index crimes and exclude minor offenses such as vandalism and non-traditional crimes such as child maltreatment and intimate partner violence (IPV).
The costs of crime are borne by many different segments of society – starting with the victim whose loss often far exceeds the value of goods stolen or property damaged. For example, violent crime victimization results in medical costs, mental health costs, productivity losses, and less tangible quality of life losses. Some of these costs may be direct losses to victims, while others might be paid for in whole or in part through insurance, private hospitals through uncompensated care, or taxpayers. Additional costs may be borne by victim service agencies that assist these crime victims – often paid for partly by taxpayers. In addition to the victim, however, costs may be incurred by police or other first responders who arrive at a crime scene, investigate and potentially arrest an offender, in addition to the cost associated with courts and corrections. Tracking these costs can assist policymakers, insurance companies, and health care providers in assessing resource needs, comparing crime to other social problems, as well as comparing costs and benefits of crime prevention programs.
This paper estimates the incidence and costs of personal (violent and non-violent) and property crime in the USA in 2017. In addition to updating earlier estimates using more recent incidence and cost data, our analysis encompasses crime more comprehensively than prior studies. For example, we include minor crimes like vandalism and vagrancy, as well as white collar crimes such as fraud and identity theft. However, we exclude crimes that are largely perpetrated against business or government such as embezzlement, forgery, and tax evasion. The scope of our cost analysis includes the cost imposed on victims, and society’s response to victimization (e.g., police investigations, incarceration of offenders). It excludes the cost of avoidance behaviors (e.g., burglar alarms or avoiding certain high-risk neighborhoods) and the fear of crime to the public at large (see e.g., Cohen, Reference Cohen2020). Thus, costs estimated here are notably smaller (as much as 50–80 % less) than one would obtain using more comprehensive willingness-to-pay estimates from contingent valuation surveys (see e.g., Cohen et al., Reference Cohen, Rust, Steen and Tidd2004; Cohen, Reference Cohen2015) or discrete choice experiments (see e.g., Carson & Louviere, Reference Carson and Louviere2017; Picasso & Cohen, Reference Picasso and Cohen2019; Picasso & Grand, Reference Picasso and Grand2019). However, the method used in this paper has the advantage of identifying individual cost components and who bears those costs – as opposed to the more aggregate approaches based on willingness-to-pay.
2 Methods
Data on crime incidence and costs were assembled from various reporting systems and the peer-reviewed literature, details of which are explained in the following sections. All traditional “Part I” FBI crimes are included – violent crimes of criminal homicide, rape, robbery, and aggravated assault, along with property crimes of burglary, larceny-theft, motor vehicle theft, and arson.Footnote 1 In addition, we provide estimates of incidence and costs of virtually all Part II crimes including simple assaults, fraud, dealing in stolen property, vandalism, weapons violations, prostitution and commercialized vice, drug abuse violations, gambling, non-violent offenses against the family and children (e.g., child maltreatment), driving under the influence, liquor law violations, public drunkenness, disorderly conduct, vagrancy, curfew and loitering laws, and all other (except traffic) violations. Note that attempts are generally included in these definitions. In addition, we provide several subcategories of assault such as IPV and child abuse, as well as police-reported Part I offenses.
2.1 Crime counts
Unless otherwise noted, we have estimated total crime incidence – not just those reported to police. Table 1 summarizes the data sources used for each crime type. The homicide count came from the National Vital Statistics System’s (NVSS) 2017 Mortality File, produced by the National Center for Health Statistics. The NVSS data rely on determinations by the medical examiner or coroner. These are not dependent on police and/or prosecutors making such a determination.
Source of data for crime counts.

Abbreviations: FARS, Fatality Analysis Reporting System; NCVS, National Criminal Victimization Survey; NIBRS, National Incidence-Based Reporting System; NIPSVS, National Intimate Partner & Sexual Violence Survey; NSCEV, National Survey of Children’s Exposure to Violence; UCR, Uniform Crime Reports; YRBS, Youth Risk Behavior Survey.
Incidence estimates for non-fatal assault, robbery, burglary, larceny, and motor vehicle theft and the percentages of these crimes reported to police came from the National Criminal Victimization Survey (NCVS) from the Bureau of Justice Statistics. The NCVS is a weighted sample of non-fatal personal crimes and household property crimes. NCVS crime counts include series victimizations reported by respondents up to a maximum of 10 incidents per year. Series victimizations generally account for less than 2 % of NCVS crime counts. Following convention, we include only the most serious offense using NCVS hierarchies. Thus, for example, an aggravated assault that took place during the commission of a robbery would be counted as an aggravated assault – and any theft of property from the robbery would be included in the cost of the assault.Footnote 2 In some cases, due to a combination of different crime definitions and sampling frames, crimes actually reported to police as estimated by the FBI’s Uniform Crime Reports (UCR) exceed those estimated from NCVS. For example, unlike NCVS, the UCR includes burglaries and motor vehicle thefts from commercial and retail establishments, robberies against children under age 16, and crimes against institutionalized individuals. To estimate national crime rates, we multiplied the UCR reported crime rates by the NCVS ratio of crime to reported crime.
The NCVS significantly underestimates the incidence of rape and sexual assault. We used additional data beyond the NCVS, described below, to estimate unreported rapes in children, adults, and incarcerated persons. For child maltreatment, we used factors from the 2006 National Incidence Survey (Sedlak et al., Reference Sedlak, Mettenburg, Basena, Petta, McPherson, Greene and Li2010) to estimate incidents detected by sentinels from cases reported to Child Protective Services (Children’s Bureau, 2019). Unreported IPV was estimated using a published non-NCVS to NCVS ratio (Miller et al., Reference Miller, Cohen and Wiersema1996).
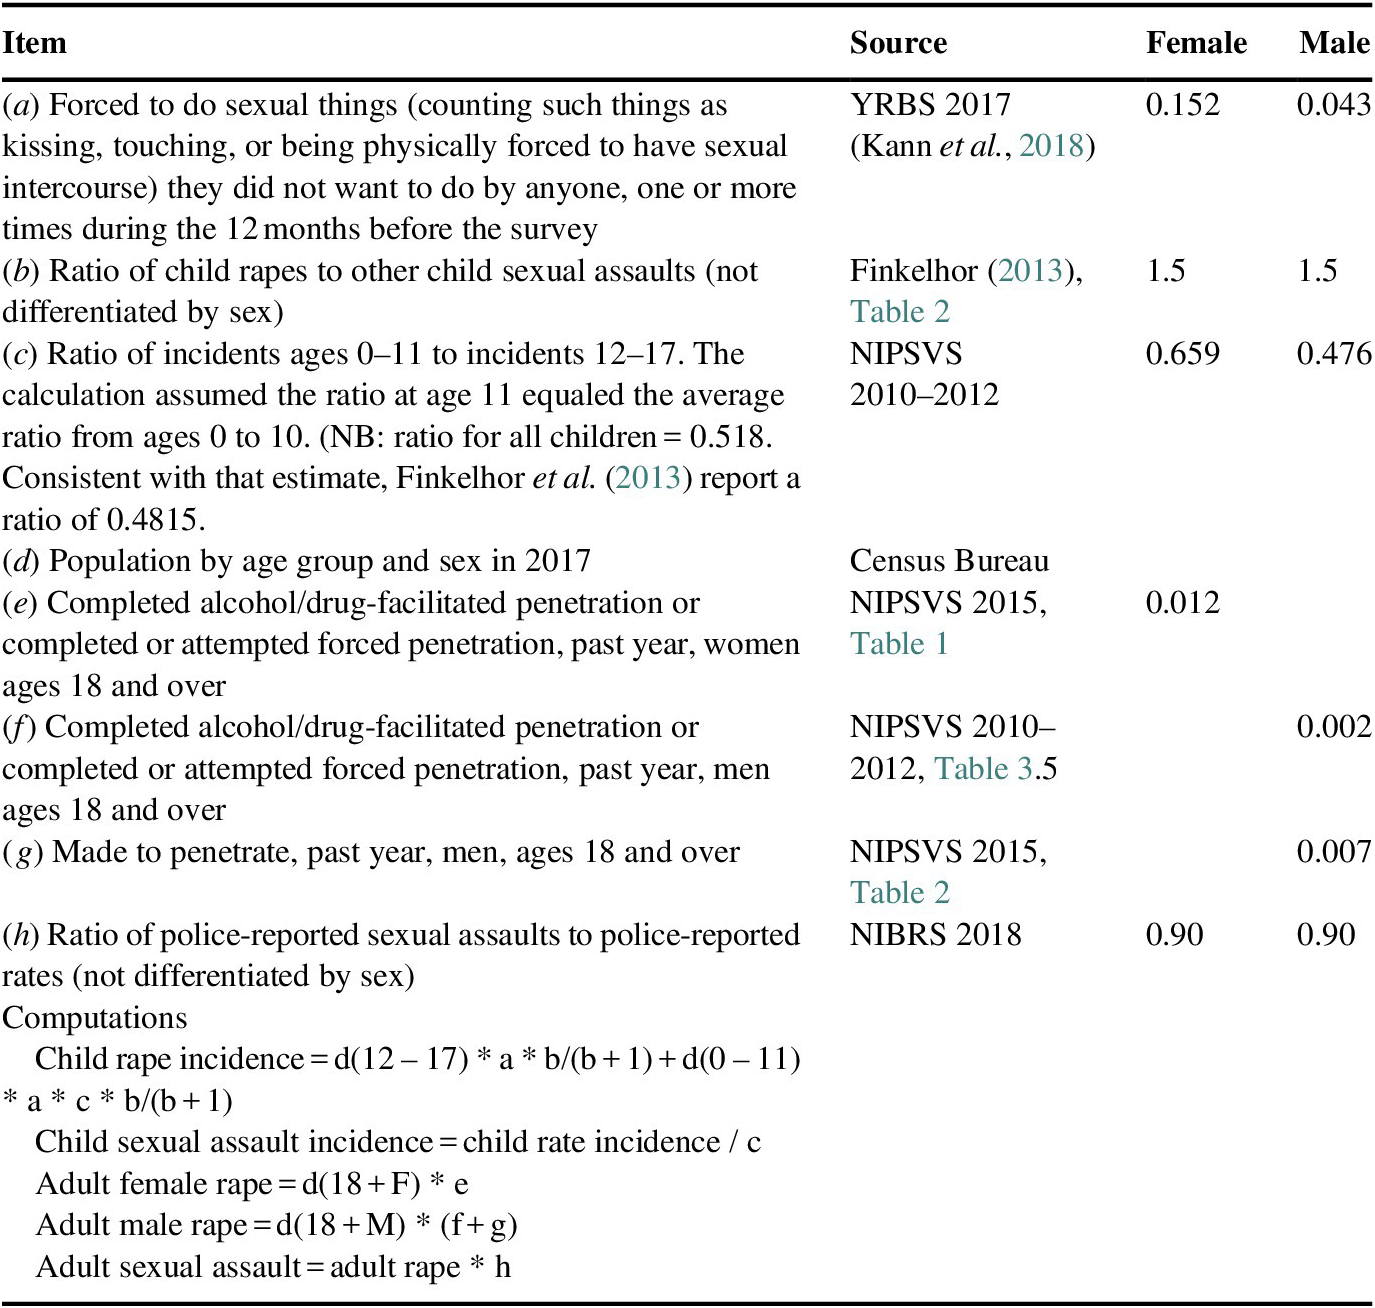
We estimated rape incidence separately for youth, adults, and the incarcerated. Table 2 details the values and definitions used in our rape and sexual assault calculations for youth and adults. We used counts by sex of rape and sexual assault rates at ages 12–17 from the 2017 Youth Risk Behavior Survey (Kann et al., Reference Kann, McManus, Harris, Shanklin, Flint and Queen2018). We decomposed that estimate using age-group-and-sex-specific ratios of sexual assaults to rapes from the National Survey of Children’s Exposure to Violence (Finkelhor et al., Reference Finkelhor, Turner, Ormrod and Hamby2009). To estimate incidence below age 12, we applied ratios from Finkelhor et al. (Reference Finkelhor, Turner, Ormrod and Hamby2009) of incidents at ages 0–11 to incidents at ages 12–17. To unduplicate our estimates, we subtracted the cases we report as child sexual abuse. At ages 18 and over, National Intimate Partner and Sexual Violence Survey (NIPSVS) data (Smith et al., Reference Smith, Chen, Basile, Gilbert, Merrick and Patel2017, Reference Smith, Zhang, Basile, Merrick, Wang, Kresnow and Chen2018) suggest 1.2 % of women were raped in 2015 and at least 0.9 % of men were raped or made to penetrate annually during 2010–2015. We computed the number of other adult criminal sexual assaults from the number of rapes by multiplying by 0.9, which is the ratio, among police-reported crimes, of sexual assaults to rapes in 2016 National Incidence-Based Reporting System data (NIBRS). NCVS data from 1990 to 2010 consistently suggest 1.5 incidents annually per non-institutionalized victim aged 12 and over (Planty et al., Reference Planty, Langton, Krebs, Berzofsky and Smiley-McDonald2013), or 1.25 incidents if a series count is capped at 10 per year (Miller et al., Reference Miller, Cohen and Wiersema1996). Because it is unclear if that serial victimization rate applies to the larger NIPSVS count, we conservatively assumed one victimization per victim. Finally, in inmate surveys (Beck et al., Reference Beck, Berzofsky, Caspar and Krebs2013a, Reference Beck, Cantor, Hartge and Smithb), 73,938 prisoners reported non-consensual sexual acts (rapes) or non-consensual sexual contact with staff or inmates (sexual assaults). Some victims are sexually assaulted multiple times during the year. We multiplied the prisoner victim counts by the survey-based average of 5.88 incidents per incarcerated victim (Beck et al., Reference Beck, Harrison, Berzofsky, Caspar and Krebs2010a, Reference Beck, Harrison and Guerino b ).
Data and computations used in calculating rape and sexual assault in community settings.

Abbreviation: NIBRS, National Incidence-Based Reporting System.
We adopted 2010 impaired driving crash counts and costs (Zaloshnja et al., Reference Zaloshnja, Miller and Blincoe2013). Those Federal estimates account for police underreporting of alcohol involvement and for crashes not reported to the police. We inflated them to 2017 dollars and updated to 2017 incidence in proportion to the change in alcohol-impaired driving deaths recorded in the Fatality Analysis Reporting System with driver alcohol level inferred where missing.
In the case of fraud and identity theft,Footnote 3 we were able to directly estimate the total number of incidents – not just those reported to police. Consumer fraud estimates are taken from a 2011 Federal Trade Commission Survey (Anderson, Reference Anderson2013), while identity theft estimates are taken from a 2016 NCVS supplemental survey (Harrell, Reference Harrell2019).
To estimate number of crimes reported to police, we started with national arrest counts for 2017 from the FBI’s UCR. By crime, we estimated the number of police-reported crimes by multiplying arrests nationally times the ratio of police-reported crimes per arrest in states reporting to the NIBRS in 2016 (data downloaded from https://ucr.fbi.gov/nibrs/2016/tables/data-tables). Incidence for Part II crimes, thus, were based on the number of crimes reported to police – not the total number of incidents. The exception is vandalism, where we assumed that 29.5 % of school vandalism reported to police applied to all vandalism incidents (National Center for Education Statistics, 2018).
2.2 Costs per crime
This paper estimates the “external costs” of crime to victims. Thus, monetary transfers from a fraud or property stolen by a burglar are considered costs even if some might argue they are a transfer of wealth and not “social costs” (see e.g., Trumbull, Reference Trumbull1990; Miller & Hendrie, Reference Miller, Hendrie, Wagenaar and Burris2013; Cohen, Reference Cohen2020, p. 27, for a discussion of criminal gains that society legally defines as lacking standing to qualify as societal costs). Although the focus is on victims (not potential victims and society at large), we include direct costs associated with victimization regardless of who pays; hence, we include the cost of emergency services, health care, and victim services even if these are paid for by government agencies, third parties, or non-profits. Unless otherwise noted, all costs are estimated on the basis of the incident – regardless of when costs occur and whether or not a crime results in arrest. Following the definitions used by both the NCVS and the FBI, attempted crimes are included. Thus, to the extent victim harm is higher when a crime is completed, our estimates of the cost per crime understate costs of completed crimes. This is also one reason why the average cost per “police reported” crime is higher than for crimes not reported to police. Victim costs are based on the present value of lifetime costs to victims for offenses incurred in 2017. Costs are averaged over all victims – whether or not they incurred a crime cost category (e.g., quality of life costs are estimated over all victims including those who might not have incurred such costs), and are stated in 2017 dollars.Footnote 4 Further, police investigation, criminal justice, and offender lost productivity are estimated per victim – whether or not the crime was reported to police, an arrest was made, or an offender was incarcerated.
Table 3 summarizes the data sources used to estimate each cost category. To estimate medical costs and lost productivity, we used 2010–2018 NCVS data to capture the percentage of rape/sexual assault, simple assault, aggravated assault, and robbery victims admitted to hospital and the percentage treated in the emergency department and released. We then computed the lifetime medical and work loss costs per victim by place of treatment by applying a previously published injury cost model that estimates the relationship between type of injuries and healthcare costs (Corso et al., Reference Corso, Finkelstein, Miller, Fiebelkorn and Zaloshnja2006; Lawrence & Miller, Reference Lawrence and Miller2014; Zonfrillo et al., Reference Zonfrillo, Spicer, Lawrence and Miller2018) using 2014 Healthcare Cost and Utilization Program national discharge samples from the last year coded in the diagnosis coding system that the model requires. Since we are unaware of any victim-based surveys of mental health care costs, we relied upon a previously published national survey of mental health providers who identified the proportion of their client population being treated for crime-related victimization (Cohen & Miller, Reference Cohen and Miller1998). Property losses are taken from NCVS survey data (Miller et al., Reference Miller, Cohen and Wiersema1996). Public services are primarily police costs per police-reported crime taken from Hunt et al. (Reference Hunt, Saunders and Kilmer2019), with additional costs for emergency services (Miller et al., Reference Miller, Cohen and Rossman1993) and victim assistance programs (Miller et al., Reference Miller, Cohen and Wiersema1996). The latter are small costs based on very old studies which are the only available studies that estimate these costs on a per-crime basis. Court costs per reported crime are taken from Hunt et al. (Reference Hunt, Anderson and Saunders2017). The cost associated with incarceration and perpetrator work loss was based on the methodology in Miller et al. (Reference Miller, Cohen and Wiersema1996) using the updated data sources from McCollister et al. (Reference McCollister, French and Fang2010).
Source of data for crime costs.

Abbreviation: HCUP, Healthcare Cost and Utilization Program; NCVS, National Criminal Victimization Survey.
Quality of life costs were based on the “willingness-to-award” methodology discussed in further detail below and based on the most recent data (Miller et al., Reference Miller, Cohen and Hendrie2017). The quality of life loss estimates exclude a “risk of death” component.Footnote 5 This approach makes our crime costs consistent with unintentional injury costs (Zaloshnja et al., Reference Zaloshnja, Miller, Romano and Spicer2004; Miller et al., Reference Miller, Finkelstein, Zaloshnja, Hendrie and Liller2012; Zonfrillo et al., Reference Zonfrillo, Spicer, Lawrence and Miller2018) that frequently are used along with crime costs in benefit–cost analyses and reduces the concern that users will inadvertently double-count costs.
The cost of interpersonal violence estimates in the literature often ignore important components that are not traditionally available through criminal justice surveys. In the case of rape and sexual assault costs, in the absence of national surveys, we added published costs of sexually transmitted diseases and pregnancy to the rape and sexual assault costs from detailed studies conducted in Iowa and Minnesota (Miller, Reference Miller2007; Yang et al., Reference Yang, Miller, Zhang, LeHew and Peek-Asa2014).
To value child maltreatment, we adapted medical plus mental health costs per substantiated case from Fang et al. (Reference Fang, Brown, Florence and Mercy2012). We adjusted the updated estimates downward to be conservative; in particular, we assumed elevated medical costs did not extend beyond the 4-year period post-treatment that the medical cost data actually covered (rather than accepting Fang et al.’s assumption that they continued for seven more years). We also opted against including Fang et al.’s (Reference Fang, Brown, Florence and Mercy2012) adult earnings losses years after child maltreatment. We added national child welfare costs for 2017 (Rosinsky & Williams, Reference Rosinsky and Williams2018). Unlike Fang et al. (Reference Fang, Brown, Florence and Mercy2012), using a small-study estimate that 38 % of adoption does not result from child maltreatment (Neil, Reference Neil2000), we removed those extraneous adoption costs from the estimates, arriving at an estimate of $9652 per maltreated child. We added police and judicial costs for handling maltreatment cases from Lee et al. (Reference Lee, Aos and Miller2008).
We adapted Fang’s (Reference Fang, Brown, Florence and Mercy2012) special education service costs for child maltreatment. Fang assumes these services continue for 9 years. However, Holt et al. (Reference Holt, McGrath and Herring2007) found that nationwide 33 % of children receiving special education in kindergarten did not continue beyond that year, 16 % continued in first grade but not third grade, 16 % did not receive services in first grade but resumed by third grade, and only 35 % received services in all three grades. These counts include children needing services because of physical, cognitive, or emotional issues, including severe permanent disabilities. Moreover, among a national sample of more than 1000 children with substantiated maltreatment before 12 months of age, no maltreatment-related special education use was ongoing 56 months later (Scarborough & McCrae, Reference Scarborough and McCrae2008). Conservatively, we assumed special education usage due to maltreatment declined by one third annually once it commenced, with none continuing beyond 3 years. For remaining cost factors, we inflated Miller et al.’s (Reference Miller, Cohen and Wiersema1996) costs of maltreatment by type (physical abuse, sexual abuse, etc.) weighted with the type distribution of cases from the most recent National Incidence Survey on Child Abuse and Neglect (Sedlak et al., Reference Sedlak, Mettenburg, Basena, Petta, McPherson, Greene and Li2010).
For FBI Part I (index) crimes (rape, robbery, aggravated assault, burglary, larceny, and motor vehicle theft), we include average unit costs across crimes regardless of police-report status. Total costs per case are higher for police-reported than unreported crimes because (a) reporting rises with crime severity and (b) only reported crimes involve police investigation, adjudication, and sanctioning.
For Part II crimes, where possible, we estimated average victim costs for all offenses regardless of police-report status. With the following exceptions, we inflated cost estimates to 2017 dollars from McCollister et al. (Reference McCollister, French and Fang2010). We based costs for identity theft on out-of-pocket costs to victims and the number of hours they spent clearing up the issue from the NCVS survey (Harrell, Reference Harrell2019). The cost of non-identity theft fraud is based on an earlier published NCVS fraud survey (Titus et al., Reference Titus, Heinzelmann and Boyle1994) that reported average victim losses. For vandalism, we estimated property damage to be $390 based on several local studies. Specifically, $390 is the average, inflated to 2017 dollars and adjusted to national prices using the ACCRA index, of the cost per incident in parks in Boise, Idaho during 2008–2011 and 2013–2015 ($261; City of Boise, various years), a national convenience sample of schools in roughly 2005–2008 ($442) (Phillips, Reference Phillips2011), and a cohort of juveniles in Philadelphia in 1972–1984 ($429) (Cohen & Piquero, Reference Cohen and Piquero2009). Other Part II crimes are largely victimless (e.g., gambling, prostitution, drugs) and thus there are no direct victim-related costs. Any ancillary harms associated with those crimes are either classified as other crimes (e.g., assaults involved with drug dealing) or considered voluntarily-induced harms (e.g., financial losses due to illegal gambling), and not external costs. However, these crimes do involve police and court-related costs which are included here. Since there are no victim surveys that would provide national estimates of the incidence of victimless crimes, both the number of crimes and their associated costs are based solely on police reported estimates.
3 Results
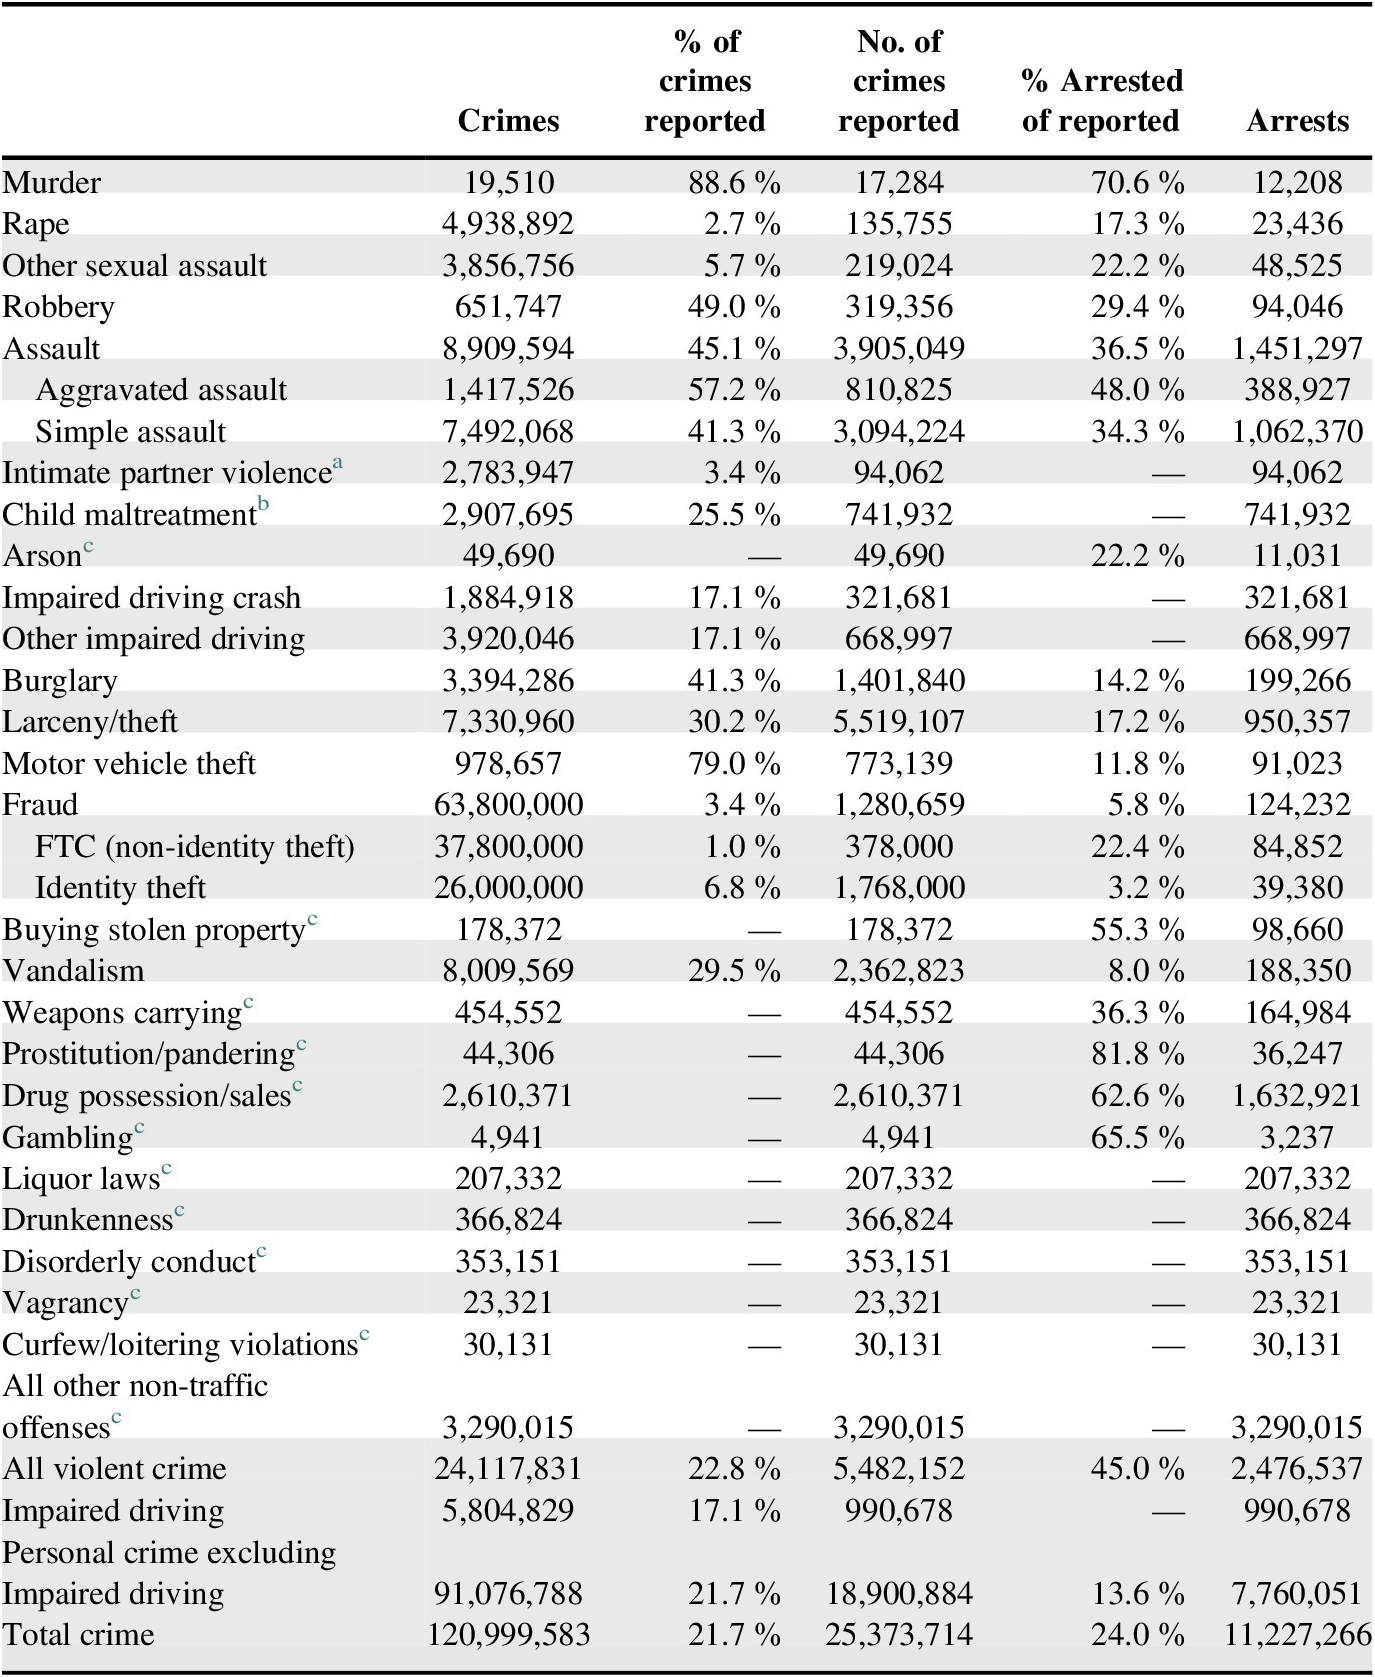
Table 4 lists all crimes and their frequencies. Approximately 121 million crimes were committed in the USA in 2017. An estimated 21.7 % of these offenses are reported to police – about 26 million offenses, resulting in about 11.2 million arrests. Some offenses such as murder and motor vehicle theft are almost always reported to police (88.6 and 79 % respectively), while about 5 % or less of rape, sexual abuse, IPV, and fraud are reported to police. The estimated incidence of most other Part II offenses is only available through police reports; thus the percentage reported to police for these offenses is unknown.
Crimes, police reporting, arrests, and percentage of arrestees, USA, 2017.

a Excludes cases police reported as assaults. Including those cases in intimate partner violence would cause our estimates not to track police-reported crime counts.
b Victims in 2010, many of whom experience multiple victimizations.
c No national incidence estimates available; based on number reported to police.
Violent crimes (murder, rape and sexual assault, robbery, physical assault, IPV, child maltreatment, and arson)Footnote 6 represent about 20 % of these incidents, 24 million crimes. Personal crimes (excluding impaired driving) represent 75 % of all cases – over 90 million offenses – although the majority of those offenses (68 million) are fraud. In addition, there were 5.8 million impaired driving offenses including 1.9 million involving automobile crashes.
In descending order, the 10 most frequently perpetrated crimes were fraud (including identity theft), assault, vandalism, larceny, rape, impaired driving (non-crash-involved), sexual assault (excluding rape), burglary, child maltreatment, and IPV. Drug possession/sale, physical assaults, larceny, child maltreatment, and impaired driving led to the largest number of arrests.
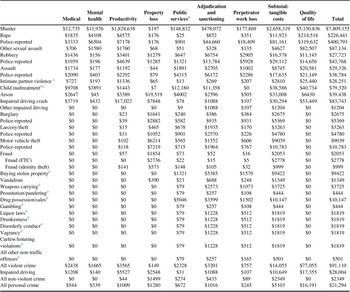
Table 5 summarizes unit costs per crime. The first three columns of Table 5 represent the direct financial burden imposed on victims, whether or not they ultimately pay these costs out-of-pocket. Many of the costs included in these columns are borne by insurance companies, employers, and taxpayers. The first column reports on average medical costs, followed by mental health costs, the value of lost productivity (which includes an estimate of the value of lost household services), and property losses. Lost productivity per offense is highest for murder – an estimated $1.8 million based on the present value of future lost earnings and household production for murder victims. There are generally no medical costs for the Part II crimes in Table 5 (shown in the bottom half). If physical injuries were involved, the crimes would be classified higher on the hierarchical listing as a Part I crime. The same is generally true for mental health – although there is evidence that fraud victims in particular may suffer psychological trauma that we have been unable to account for.Footnote 7
Costs per crime by cost category including crimes not reported to police, USA, 2017.

a Public services include police, fire, EMS, victim services. Violent crimes are rape, other sexual assault, robbery, assault, intimate partner violence, child maltreatment. and arson.
b Excludes cases police reported as assaults.
c Annual costs per child maltreated.
d No national incidence estimates available; based on number and costs per offense of incidents reported to police.
The fourth column, “public services” includes the cost of emergency services, police investigation, child protective services, and victim services. The column labeled “adjudication and sanctioning” includes the cost of courts (including public defenders, prosecutors, judges, and juries), jail and prison, probation and parole officers, and diversion programs such as drug courts. These costs are typically much higher per offender who goes through the process than shown in Table 5. Recall that costs here are reported on a “per offense” or “police-reported” basis. Thus, the $1429 reported cost for adjudication and sanctioning per police-reported burglary, for example, actually represents a cost per arrestee of $10,063 (once the 14.2 % of reported offenses that lead to an arrest as shown in Table 1 are taken into account). Also note that the adjudication and sanctioning cost “per burglary offense” shown in Table 5 is lower, $452, because by definition those that are not reported to police do not involve these public expenditures. Similarly, the value of perpetrator work loss is on a per offense basis – and only a small percentage of offenses result in an ultimate incarceration. The eighth column sums up all of these tangible costs and represents the out-of-pocket monetary costs per criminal offense. Finally, we add the monetary value of pain, suffering, and lost quality of life. Again, only Part I and other violent crimes (as well as child maltreatment) are assumed to reduce victim quality of life. Thus, to the extent fraud and other crimes involve mental anguish, these costs would be higher. The last column of Table 5 adds these intangible costs to the tangible subtotal.
Weighted average costs across all crimes included in this study are estimated to be $21,272 (in 2017 dollars); $91,110 for violent crime, $28,004 for impaired driving, and $2349 for non-violent crimes (excluding impaired driving). Crimes with the largest unit costs are homicide ($7,809,155), rape ($226,441), sexual assault ($87,134), impaired driving crashes ($83,743), child maltreatment ($79,320), arson ($39,438), assault ($29,326), and robbery ($27,723).
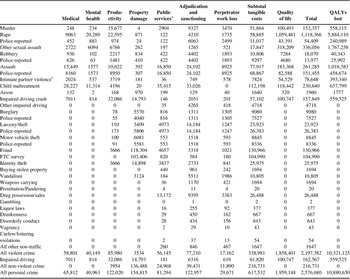
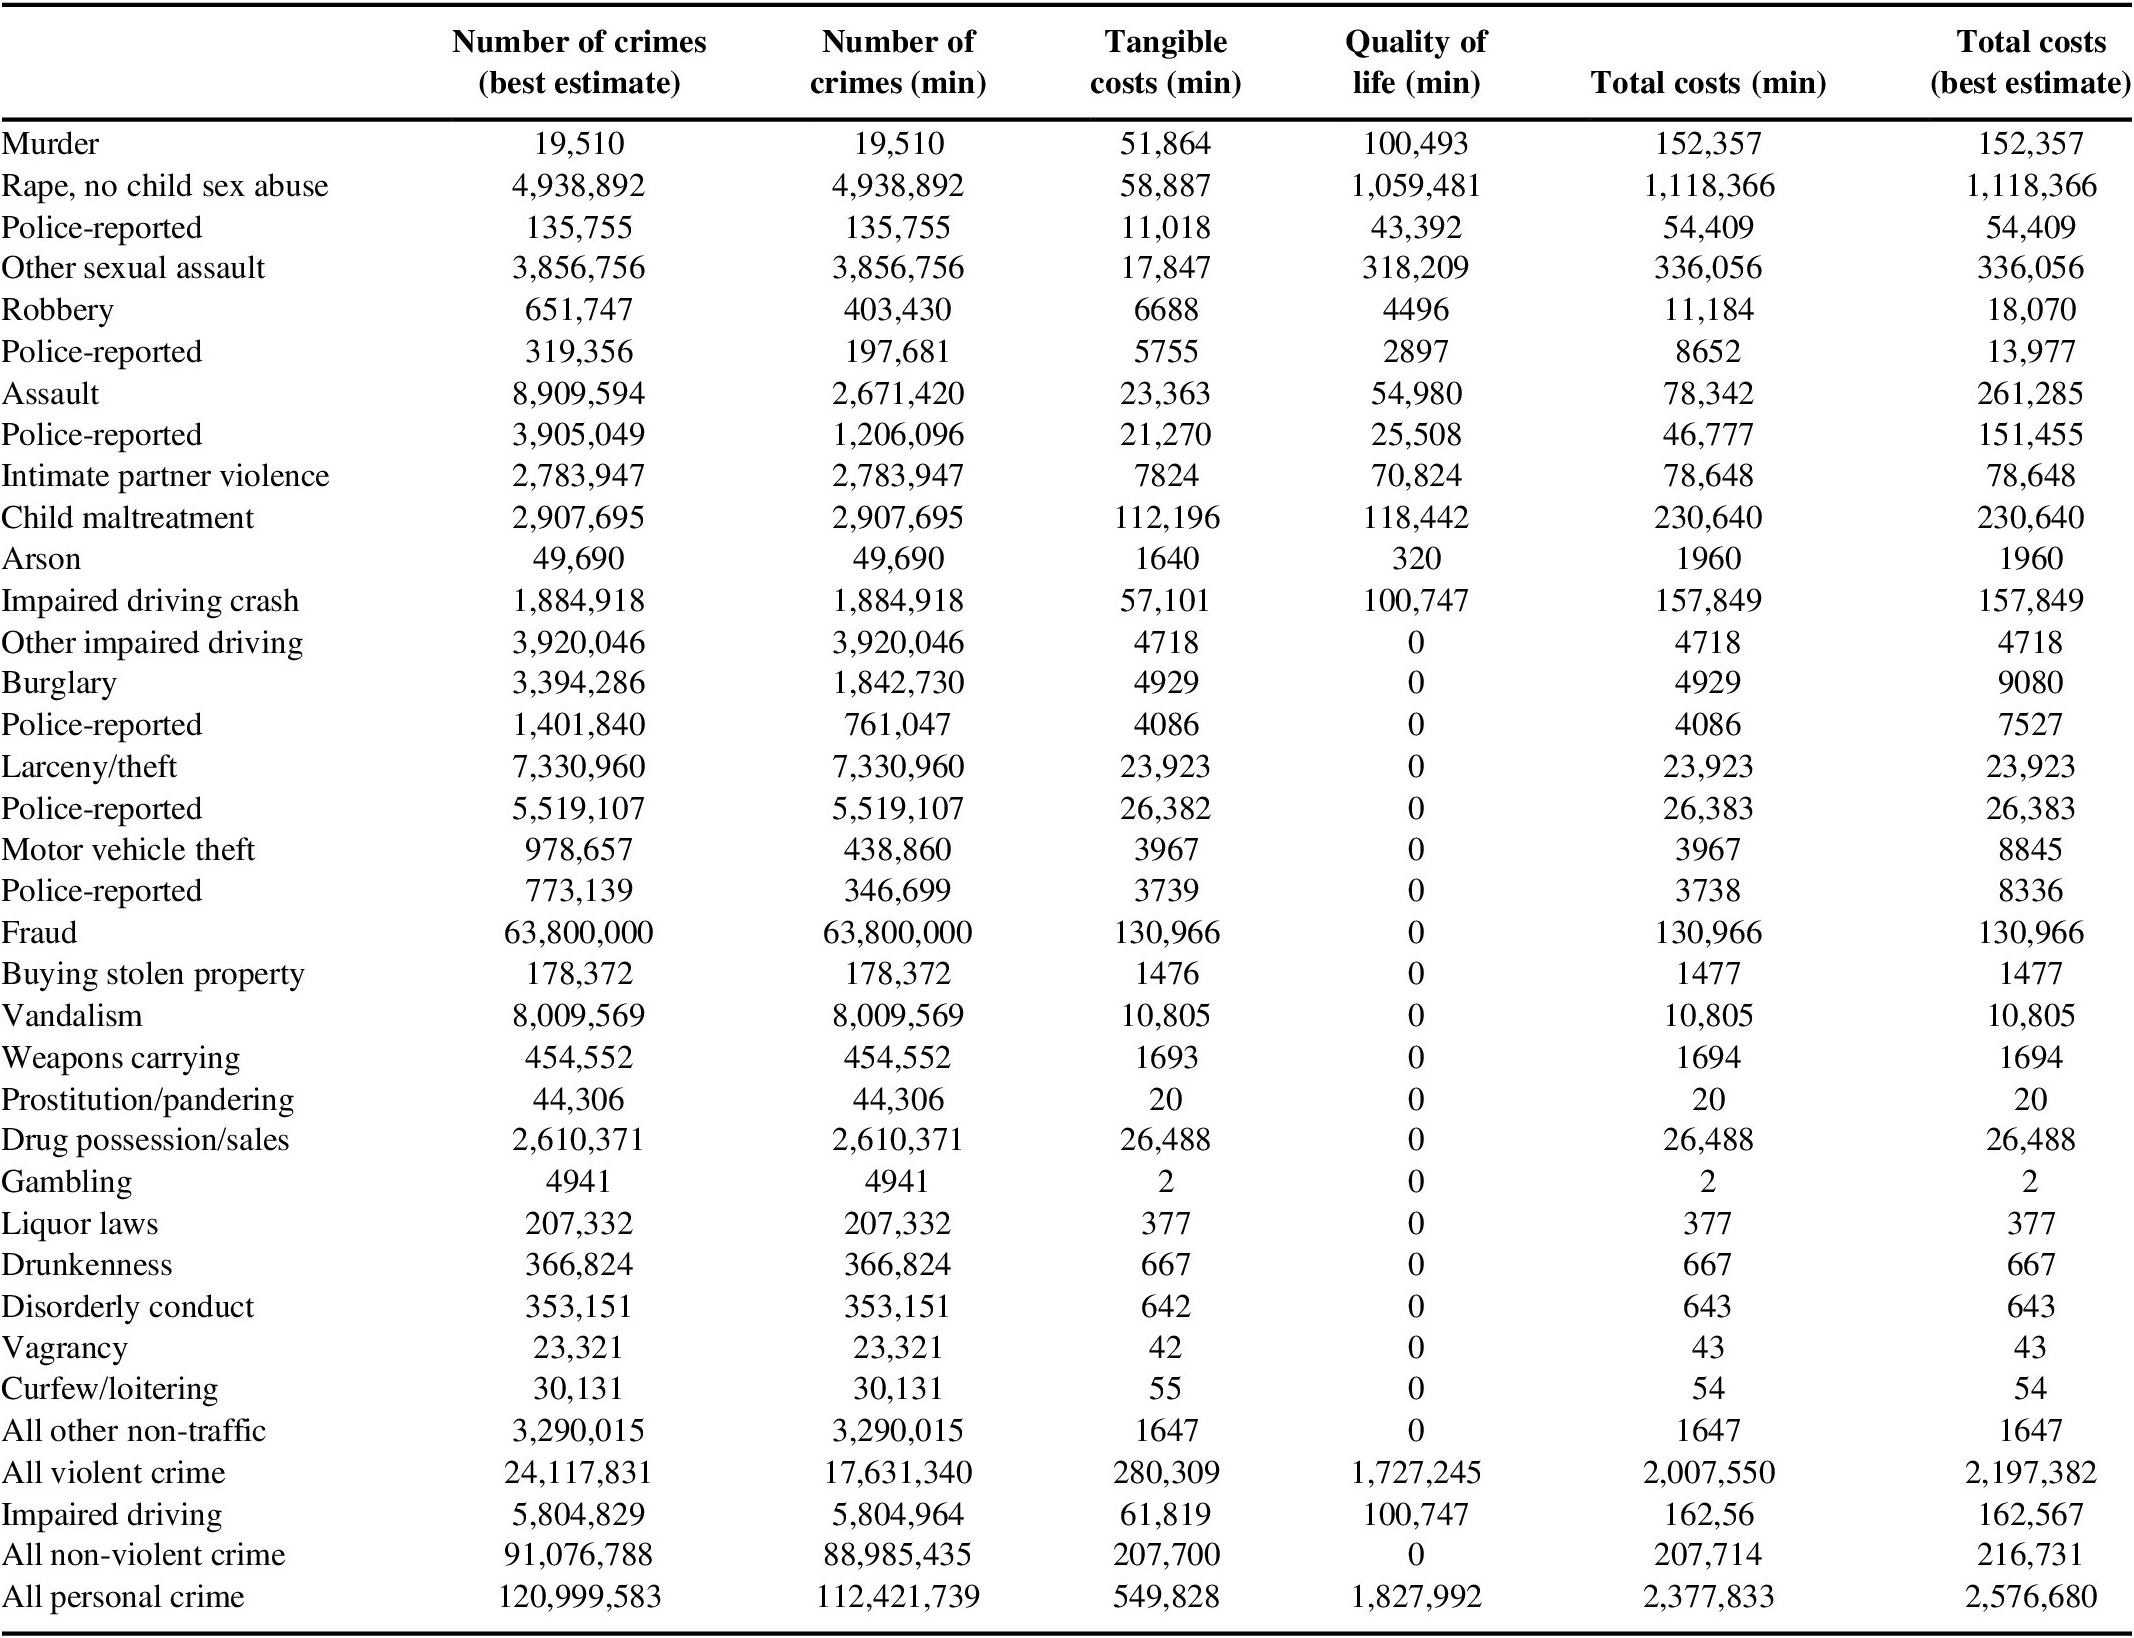
Table 6 combines the number of crimes from Table 4 with each of the cost categories shown for individual crimes in Table 5. For example, the average medical costs for murder victims were estimated to be $12,735 in Table 5. Multiplied by 19,510 murders, total medical costs associated with murder are estimated to be $248 million. Productivity losses are nearly 150 times higher at $35.7 billion because productivity losses for murder victims are based on the present value of their future remaining lifetime earnings. The largest tangible crime costs are due to fraud – totaling an estimated $131 billion, followed by child maltreatment ($112 billion), physical assault ($78 billion), rape and sexual assault combined ($77 billion), impaired driving crashes ($60 billion), and murder ($52 billion). However, once quality of life costs are factored in, rape becomes the most costly ($1.12 trillion), followed by other sexual assault ($336 billion), assault ($261 billion), child maltreatment ($231 billion), and murder ($152 billion). Our sexual crime classification warrants a caveat. Child maltreatment includes 180,630 cases of child sexual abuse that cost an average of $194,623 each and $35.2 billion in aggregate (not tabulated). Including those crimes, sexual violence costs total $1.49 trillion.
Total costs of crime (millions of dollars) and QALYs lost by crime, USA, 2017.

Note: Numbers may not add due to rounding.
Abbreviation: QALY, quality-adjusted life year.
a Public services include police, fire, EMS, victim services. Violent crimes are rape, other sexual assault, robbery, assault, intimate partner violence, child maltreatment, and arson.
b Excludes cases police reported as assaults.
The last column of Table 6 departs from the monetary valuation reported throughout this study and instead presents an estimate of the “quality-adjusted life years” (QALYs) lost by type of crime. QALYs losses are a standardized measure of the quality and quantity of years of perfect health lost due to physical and/or mental health losses (Robinson & Hammitt, Reference Robinson and Hammitt2013). For example, the total QALY loss due to murder is estimated to be 558,115 – which represents an average of 28.6 QALYs for each of the 19,510 murders shown in Table 4 (approximately 28.6 years of healthy life remaining for the average murder victim). Principal contributors to the 10.9 million lost QALYs were rape (5.9 million), sexual assault (1,8 million), assault (1.0 million), child maltreatment (0.68 million), impaired driving crashes (0.56 million), and murder (0.56 million).
Nationally, estimated crime costs totaled $2.57 trillion including $620 billion in monetary costs and quality of life losses valued at $1.95 trillion (Table 6). Quality of life accounted for 76 % of the costs. The largest monetary cost components – each accounting for 5–6 % of the total, included adjudication and sanctioning; property losses; and productivity losses (both victim and perpetrator). Combined, health and mental health care accounted for 4 % of costs.
Violent crime accounted for 85 % of total costs. Whereas homicides were responsible for only 6 % of costs, 56 % of costs were due to rape and other sexual assaults. Homicide incidence was less than 0.02 % of all crimes in 2017. In contrast, homicide had the highest per crime costs ($7.8 million) over any other crime by a factor of almost 20.
4 Discussion
This paper updates and expands the scope of annual cost of crime estimates in the USA for 2017. Approximately 121 million crimes committed in the USA in 2017 resulted in $620 billion in direct monetary costs and $1.95 trillion in intangible pain, suffering, and lost quality of life costs. Combined, the cost of crime in 2017 was $2.6 trillion. 85 % of the total cost was due to violent crime; while 55 % of the total monetary cost was due to violent crime. Homicides had the highest unit cost for any type of crime.
These estimates account for quality of life lost by victims and their families. We chose to focus on the cost to victims and values from a “willingness-to-award” approach (Miller et al., Reference Miller, Cohen and Wiersema1996, Reference Miller, Cohen and Hendrie2017; Cohen & Miller, Reference Cohen and Miller2003). The estimates are based on non-economic damage awards when third parties are held liable for a violent crime. For example, they include jury verdicts and settlements from assaults that occurred in poorly lit parking lots or by perpetrators who were served by a bartender when they clearly were intoxicated. The quality of life values were taken from regression results reported in Cohen and Miller (Reference Cohen and Miller2003) and Miller et al. (Reference Miller, Cohen and Hendrie2017) that estimate the non-pecuniary portion of jury awards and settlements as a function of underlying injuries, medical costs, and demographic characteristics of physical and sexual assault victims. While critics of this approach often claim that jury awards have high variability with some awards being extreme, this methodology explicitly excludes punitive damages and adjusts out the effects of extreme high outliers on awards (for a detailed discussion and further citations to the substance of these critiques, see Cohen, Reference Cohen2020, pp. 159–162). For example, as shown in Table 5, the average police-reported robbery victim results in $8079 in medical costs, mental health costs, lost wages, and property losses. Our estimated value of lost quality of life for that case is $14,656 – less than twice the pecuniary losses. Similarly, the average victim loss in a police-reported assault is $4864 with the estimated quality of life cost of $22,821. These regressions imply juries compensating losses due to physical assault use a value of $7.8 million for a lifetime of work and quality of life (inflated to 2017 dollars with the employment cost index), or net of work loss, of approximately $222,500 per QALY.
Costing a homicide at $7.8 million is conservative. Rather than willingness to award, most values for homicide losses are based on a different valuation approach – willingness to pay – mandated in 1989 for use in analyses of Federal regulations that save lives (U.S. Office of Management and Budget (OMB), 1989). In 2017 dollars, direct estimates of what people are willing to pay to prevent a homicide range from $6.7million (Kochi & Taylor, Reference Kochi and Taylor2011) to $16 million (Cohen et al., Reference Cohen, Rust, Steen and Tidd2004) to $43.5 million (Scotton & Taylor, Reference Scotton and Taylor2011). Widely cited systematic reviews recommend values between $5.7 million (Miller, Reference Miller1990) and $10 million (Viscusi & Masterman, Reference Viscusi and Masterman2017) in 2017 dollars for all injury deaths. This widely accepted approach infers how much people are willing to pay to save their lives from what they pay for small changes in their chance of being killed or injured.
The willingness-to-award estimates for physical assault we used build on non-monetary quality of life loss scores for physical injury (Miller et al., Reference Miller, Pindus, Douglass and Rossman1995; Spicer et al., Reference Spicer, Miller, Hendrie and Blincoe2011) that also underlie widely cited costs of unintentional injury (Miller & Blincoe, Reference Miller and Blincoe1994; Miller et al., Reference Miller, Finkelstein, Zaloshnja, Hendrie and Liller2012; Zaloshnja et al., Reference Zaloshnja, Miller and Blincoe2013; Zonfrillo et al., Reference Zonfrillo, Spicer, Lawrence and Miller2018). A model that included those scores but no other information about the injury explained 48 % of the variance in 956 awards for physical assault and 13 % of the variance in 270 sexual assault awards (Miller et al., Reference Miller, Cohen and Hendrie2017). Identical data sets and methods were used to estimate medical costs and productivity losses for unintentional injury and crime. Thus, our estimates are consistent with valuations of other injury prevention benefits. They can be combined in analyses, for example, of relative burden of crime and crashes and related police resource allocations.
4.1 Policy implications and yardsticks
Rape, impaired driving crashes, child maltreatment, sexual assault, physical assault, robbery, and arson are the most severe non-fatal violent crimes as measured by cost per crime (Table 5). To avoid double counting, homicides that occur during the commission of another violent crime are counted in homicide costs. However, it is illustrative to incorporate these costs into the underlying crime. As shown in Table 7, for example, an estimated 2372 fatalities occurred during a robbery, which would increase the average cost of a robbery from $27,723 to $55,941. Identifying homicides that co-occur with other crimes is important for costing the true impact of those crimes.
Cost per crime including risk of death.

Note: All deaths were valued at $7,809,155.
Impaired driving and assault resulted in the most fatalities. Using fatalities as the metric, an impaired driving crash might appear to be a violent crime: it results from an illegal act and sometimes causes injury or death. Because the FBI does not include impaired driving fatalities in its list of violent crimes, we excluded impaired driving from the violent summary category. We have excluded it from the personal crime summary category as well. While an impaired driving trip is less severe than an assault, it is much more severe than any property crime, by cost per crime. Our data indicate that the severity of outcomes suggests reconsidering the current “no-man’s-land” classification where impaired driving trips are currently, and placing them among violent crimes. Based on the DOJ’s violent crimes definitions, drunk driving trips not resulting in injury or death would be classified as “attempted or threatened” violent crimes. Drunk driving crashes, like violent crimes are more likely than most crimes to be reported to the police in the USA (Hart & Rennison, Reference Hart and Rennison2003). Despite an increase in police enforcement and judicial sanctioning, however, non-fatal drunk driving is still only lightly sanctioned in some jurisdictions.
Crimes against the person and property impose a major burden in the USA. The 121 million crimes included here cost $620 billion in direct monetary costs in 2017. This represents about 3.2 % of U.S. Gross Domestic Product (GDP) – $1900 for every person in the USA. This exceeds the $590 billion spent on the military or the $450 billion spent on all social welfare programs that year. Crime-related medical and mental health care expenditures totaled about $90 billion – which represents about 2.5 % of U.S. health care expenditures. Although GDP does not include quality of life costs or household production, as a point of comparison, the total cost of $2.6 trillion (including those costs) is the equivalent of about 10 % of GDP. While these costs are certainly significant, it is also true that traditional street crimes have been declining over the past 25 or more years. In fact, in 2017, both police-reported property and violent crime rates were about half what they were in 1993 – when the last national crime cost estimates were published (Miller et al., Reference Miller, Cohen and Wiersema1996). At the time, tangible costs were estimated to be $105 billion – about 1.5 % of GDP, and total costs were estimated to be $450 billion – the equivalent of about 6.5 % of GDP. The fact that we estimate tangible crime costs as a percentage of GDP to be significantly higher, however, is dependent entirely upon our expanded definition of crime – including better information about the extent of sexual assault, child maltreatment, and IPV, as well as inclusion of fraud and identity theft. Thus, crime continues to be a serious national problem. Dozens of cost-beneficial crime prevention interventions exist (Aos & Drake, Reference Aos and Drake2013; Aos, Reference Aos2015). Given the size of the Nation’s crime bill, providing adequate funding to implement them seems a priority.
4.2 Limitations and strengths
Our analysis covers a broader range of crimes than prior estimates. It is one of the first to draw on emerging NIBRS data to support more complete estimates of police-reported crimes from arrest counts, a method explored by McCollister and colleagues. While our unit of analysis is crime incidence, for some Part II crimes, we only have estimates of the number of crimes reported to police. The estimates assume the ratio of police-reported crimes to arrests in NIBRS states applies to other states; that introduces an unknown level of uncertainty into our incidence estimates. The IPV estimates rely on older models of underreporting factors.
We excluded sexual contact between prison and jail inmates and facility staff that the U.S. DOJ classifies as “willing activity.” While the term almost equates to consensual sexual activity, the DOJ notes that all sexual contact between staff and inmates is legally non-consensual (Beck et al., Reference Beck, Berzofsky, Caspar and Krebs2013a). By excluding these contacts, we make a conservative estimate, which is consistent with our other assumptions.
Both the measurement of crime rates and their associated costs are subject to considerable uncertainty. Because this paper relies upon scores of disparate data sources and assumptions, it is not possible to characterize the level of uncertainty using standard statistical methodologies. With Crystal Ball software (Oracle Corp., Redwood Shores, CA), we used Monte Carlo simulation with 800,000 iterations to bootstrap 95 % uncertainty intervals for the unit costs and total costs. The bootstrap generally used standard deviations of 10 % with normal distributions for both incidence and costs. For quality of life, we substituted the actual 11.35 % standard error from Miller et al. (Reference Miller, Cohen and Hendrie2017) for the hypothesized 10 %, and we drew police cost variation from Hunt et al. (Reference Hunt, Saunders and Kilmer2019).
Table 8 shows the uncertainty intervals. The coefficients of variation (standard deviation as a fraction of the mean) show that the most uncertain estimates are for unit costs of rape ($178,769–$274,181), sexual assault ($68,798–$105,500), an impaired driving offense ($22,184–$34,666), and a non-violent crime ($1438–$3018). Impaired driving costs also were the most uncertain in aggregate. Compared to the aggregate costs of $2.6 trillion shown in Table 6, the estimated 95 % uncertainty interval is between $2.2 and $3.0 trillion. Total monetary costs (mean $615 billion) range from $563 to $669 billion, while total quality of life costs (mean $1.96 trillion) range between $1.59 and $2.38 trillion).
95 % confidence limits and coefficients of variation for the unit costs and total costs.

As a sensitivity check, we also estimated incidence and costs using two alternative crime count estimates. As noted in the crime count section, we adjusted NCVS crime rates upwards based on an analysis of UCR and NCVS reported crime. Using the lower crime estimates for assault, robbery, burglary, and motor vehicle thefts implied using NCVS only, both total incidence and cost of crime are reduced by about 7 %, from 121 million to 112 million crimes, and from $2.12 trillion to $1.98 trillion. Details are shown in Table 9.
Sensitivity analysis: total costs of crime (millions of dollars), USA, 2017 comparison of best estimate (based on NCVS/UCR reporting ratios) versus min (NCVS only) values.

Note: Numbers may not add due to rounding.
As a second sensitivity check, we increased the estimated number of adult rape and sexual assaults by incorporating a series multiplier of 1.25 – increasing the number of rapes in Table 4 to 5,602,993, and the number of other sexual assaults to 4,454,448. This would increase the total cost associated with rape in the USA shown in Table 6 to $1.27 trillion, and the cost of sexual assault to $388 billion. The total cost of crime would increase from $2.61 trillion to $2.79 trillion.
As further documented in Yang et al. (Reference Yang, Miller, Zhang, LeHew and Peek-Asa2014), Miller et al. (Reference Miller, Fulton and Lee2018), and Table 2, our incidence estimates for rape, other sexual assault, child sexual abuse, and other child maltreatment rely on self-report or sentinel report. They derive from congressionally mandated, large and periodically updated Federal studies, supplemented with other large surveys of or about children. Standard deviations in these studies primarily are around 10 % of the mean. Despite rigorous pilot testing, survey question structure and procedures, however, may skew the results, either by causing a telescoping of responses or a reluctance to report.
Our estimates omit many white collar and corporate crimes where incidence estimates or costs are not available. In many cases of white collar and corporate crime, victims are unaware of the offense; and even if they are aware, there is no national database estimating either their incidence or harm. Two exceptions are the case of fraud and identity theft, government sponsored, nationally representative surveys provide estimates of both incidence and costs. As shown here, these are two very common and costly offenses. Aside from these two offenses, it has been estimated elsewhere that the cost of white collar and corporate crime might easily exceed that of traditional crimes (Cohen, Reference Cohen2020, Chapter 11).
We omitted the costs of preventing and avoiding crime (such as enhanced lighting or burglar alarms), crime-related fear to communities including to those who witness crime. Including these costs could easily double the cost estimates or more. Estimates that are more comprehensive based on “willingness-to-pay” to reduce the risk of crime are between 1.5 and 10 times the cost based on the approach used here. For example, Cohen et al. (Reference Cohen, Rust, Steen and Tidd2004) estimate that the willingness-to-pay to reduce rape and sexual assault was 1.6–2.7 times higher than the cost to victims (including the value of their pain and suffering) and criminal justice costs. Similarly, willingness-to-pay to reduce burglary is 4.8–6.9 times higher than the cost of burglary to victims and criminal justice costs; while they are 5.5–9.9 times higher for armed robbery. While we have used the most recent data available on both the number of crimes and the cost per crime, some of the cost data are still quite dated and updated primarily by the rate of inflation. For example, while we used physical injury data from NCVS between 2005 and 2014 and applied 2014 medical cost data to estimate medical costs, data on mental health care costs are from a 1993 survey of mental health care providers. To the extent mental health care utilization has increased, cost might now be even higher. On the other hand, to the extent there have been significant structural changes in the way offenders are treated (e.g., diverted from prison into less costly alternatives or lower average time served), incarceration costs might now be lower. In some cases, incarceration rates or time served might be higher (e.g., drunk drivers or sexual assault offenders) – leading to higher costs per offender. These are areas ripe for future research.
Funding
Partial support for this research came from numerous projects that needed crime costs—NIH grants R01 HD094801, R01MH095767, R44DA040318, and 5R01DA021624; contracts with the AB InBev Foundation, Health Resources and Services Administration/Children’s Safety Network, and U.S. Consumer Product Safety Commission; and a grant from the Pew Foundation. None of the funders have reviewed this work, so all findings and opinions are strictly those of the authors.