1. Introduction
Magma generation and processes play important roles in the material differentiation of the Earth and the continental crust (Rudnick, Reference Rudnick1995; Foley et al. Reference Foley, Tiepolo and Vannucci2002). The course of magma from its source to intrusion into wall rock usually involves several petrogenetic processes, e.g. the partial melting of a source, assimilation and fractional crystallization, which contribute to the compositional diversity of magmas and associated rocks (Depaolo, Reference Depaolo1981; Spera & Bohrson, Reference Spera and Bohrson2001; Annen et al. Reference Annen, Blundy and Sparks2005). Intrusive complexes or batholiths with distinctive geochemical signatures, such as high Sr/Y and high Ba–Sr signals, have attracted great attention, with significant implications for petrogenesis and tectonics (Drummond & Defant, Reference Drummond and Defant1990; Fowler et al. Reference Fowler, Henney, Darbyshire and Greenwood2001). High Sr/Y magmatic rocks usually have adakitic signatures (high Sr and low Y and Yb concentrations with high Sr/Y and La/Yb ratios), which are related to continental crustal evolution and recycling, specific geodynamics and porphyry-type Cu ± Mo ± Au deposits (Xu et al. Reference Xu, Shinjo, Defant, Wang and Rapp2002; Martin et al. Reference Martin, Smithies, Rapp, Moyen and Champion2005; Castillo, Reference Castillo2012). Meanwhile, high Ba–Sr intrusions usually vary from appinite to granite and are characterized by high alkali, Ba–Sr and light rare earth element (LREE) concentrations and low heavy REE (HREE) concentrations, carrying important information on their petrogenesis and geodynamics in orogenic belts or subduction zones (Tarney & Jones, Reference Tarney and Jones1994; Fowler et al. Reference Fowler, Kocks, Darbyshire and Greenwood2008; Bruand et al. Reference Bruand, Storey and Fowler2014; Pan et al. Reference Pan, Zhang, Xu, Guo, Luo and Wang2016; Zhu et al. Reference Zhu, Li, Chen, Tang, Wang, Chen, Liu, Xiao and Chen2018).
The North China Craton (NCC) is one of the most important regions when studying the complicated evolution of the continental lithosphere, as this region experienced craton destruction during the Phanerozoic (Wu et al. Reference Wu, Lin, Wilde, Zhang and Yang2005; Xu, Reference Xu2007; Zheng et al. Reference Zheng, Xie, Liu, Chen, Wang, Guo, Ga and Li2007a; Zhang, Reference Zhang2009). The Cretaceous Period is considered as the major time of intense magmatism and mineralization in the NCC (Xu et al. Reference Xu, Yang, Pei and Yu2009a; Zhu et al. Reference Zhu, Yang and Wu2012). These Cretaceous magmatic rocks are complex products of multiple sources, e.g. asthenospheric mantle, enriched lithospheric mantle, ancient basement, and reworked and juvenile crustal materials (Zhang et al. Reference Zhang, Sun, Zhou and Ying2005; Yang et al. Reference Yang, O’Reilly, Walker, Griffin, Wu, Zhang and Pearson2010; Chen et al. Reference Chen, Jahn, Arakawa and Zhai2013; Huang et al. Reference Huang, Xu, Liu, Li, Chen and Li2017). More significantly, high Sr/Y magmatic rocks and high Ba–Sr intrusions have been found in the central and eastern NCC during the Cretaceous Period (Zhang et al. Reference Zhang, Wang, Qian, Yang, Wang, Zhao and Guo2001; Qian et al. Reference Qian and Hermann2002; Wang et al. Reference Wang, Yang, Deng, Santosh, Zhang, Liu, Li, Huang, Zheng and Zhao2014; Ma et al. Reference Ma, Xu, Zheng, Griffin, Hong and Ma2016 a; Wang et al. Reference Wang, Zeng, Chen, Cai, Yan, Hou and Wang2017). These high Sr/Y magmatic rocks in the NCC usually show adakitic features that imply their special genetic and geodynamic links to a subducted oceanic slab (Wang et al. Reference Wang, Xu, Lu, Fu, Lu, Yang and Zhao2016a), thickened or delaminated lower continental crust (Gao et al. Reference Gao, Rudnick, Yuan, Liu, Liu, Xu, Ling, Ayers, Wang and Wang2004; Liu et al. Reference Liu, Li, Guo, Hou and He2012; Xu et al. Reference Xu, Zhou, Pei, Yang, Gao, Li and Yang2013; Yang et al. Reference Yang, Xu, Zhao, Huo, Shi and Yang2016), fractional crystallization processes (Gao et al. Reference Gao, Santosh, Hou, Wei, Ma, Chen and Wu2012; Ma et al. Reference Ma, Xu, Zheng, Sun, Griffin, Wei, Ma and Yu2016b), or inheritance from source materials at the normal crustal level (Qian & Hermann, Reference Qian, Chung, Li and Wen2010; Jiang et al. Reference Jiang, Carlson and Guo2011; Ma et al. Reference Ma, Zheng, Xu, Griffin and Zhang2015). Meanwhile, the Cretaceous high Ba–Sr intrusions in the NCC are related to the partial melting of the enriched subcontinental lithospheric mantle and subsequent crust–mantle interaction (Wang et al. Reference Wang, Zeng, Chen, Cai, Yan, Hou and Wang2017) or the mixing of melts from the basement and juvenile mafic lower crust (Wang et al. Reference Wang, Yang, Deng, Santosh, Zhang, Liu, Li, Huang, Zheng and Zhao2014) and are possibly linked to the post-collisional lithospheric extension (Qian et al. Reference Qian and Hermann2002) or subduction of the Palaeo-Pacific Plate (Wang et al. Reference Wang, Yang, Deng, Santosh, Zhang, Liu, Li, Huang, Zheng and Zhao2014).
In the southern Taihang Mountains, the eastern part of the central NCC, a series of Early Cretaceous intrusions crop out, varying from mafic to intermediate and felsic rocks (Wang et al. Reference Wang, Fan, Zhang and Peng2006; Chen et al. Reference Chen, Tian, Jahn and Chen2008; Xu et al. Reference Xu, Li, Pang and He2009b; Ying et al. Reference Ying, Zhang and Tang2011), and some of these intrusions have genetic relationships with skarn-type iron deposits (Zheng et al. Reference Zheng, Griffin, O’Reilly, Yu, Zhang, Pearson and Zhang2007b; Shen et al. Reference Shen, Santosh, Li, Zhang, Yin, Dong, Wang, Ma and Yu2013; Deng et al. Reference Deng, Li and Wen2015). Each intrusive complex shows a certain rock association, e.g. monzogabbro–monzonite, monzonite–quartz monzonite and syenite–granite (Chen et al. Reference Chen, Jahn and Suzuki2004; Sun et al. Reference Sun, Xiao, Zhan, Wu, Zhu, Huang, Bai and Zhang2015). The petrogenesis of these intrusions and related geodynamic processes beneath the central NCC during the Early Cretaceous are still controversial, such as magmatic mixing (Chen et al. Reference Chen, Chen and Jahn2009), fractionation of a water-saturated magma (Gao et al. Reference Gao, Santosh, Wei, Ma, Chen and Wu2013; Wang et al. Reference Wang, Zeng, Chen, Cai, Yan, Hou and Wang2017), mantle-derived magmas involving delaminated lower continental crust (Xu et al. Reference Xu, Li, Pang and He2009b; Sun et al. Reference Sun, Xiao, Zhu, Wu, Deng, Bai and Wen2014) or assimilation of peridotite by monzodiorite magma at crustal depths (Qian & Hermann, Reference Qian, Chung, Li and Wen2010). Then, the source, petrogenesis and tectonic implications of the Early Cretaceous intrusive rocks in the southern Taihang Mountains are still not completely known. In this paper, we present petrological, zircon U–Pb–Hf isotopic and whole-rock elemental and Sr–Nd isotopic geochemical data for the monzonites and quartz monzonites of the Early Cretaceous Fushan pluton, southern Taihang Mountains, with the aim of constraining their geochronology and petrogenesis and giving implications for their tectonic setting.
2. Geological background and samples
The NCC is mainly composed of Archaean–Palaeoproterozoic metamorphic basement and Proterozoic to Cenozoic covers (Zhao & Cawood, Reference Zhao and Cawood2012) and is bounded to the north by the Central Asian orogenic belt and to the south and east by the Qinling–Dabie–Sulu orogenic belt (Li et al. Reference Li, Zhao, Liu, Cao, Yu, Li, Somerville, Yu and Suo2018 a) (Fig. 1a). The central NCC is an important transitional region between the eastern and western parts of the NCC, approximately overlapping the geological Palaeoproterozoic Trans-North China Orogen and geophysical North–South Gravity Lineament (NSGL). The Trans-North China Orogen is a Palaeoproterozoic orogenic belt formed by the amalgamation of the eastern and western blocks of the NCC (Zhao & Cawood, Reference Zhao and Cawood2012). The NSGL is a geophysical boundary between the eastern and western parts of the NCC and separates two topographically, tectonically and seismically different regions (Xu, Reference Xu2007). In the central NCC, there are several Archaean–Palaeoproterozoic basements, e.g. the Wutai and Zanhuang complexes in the Taihang Mountains, which are dominantly composed of schist, gneiss, amphibolite, marble and banded iron formations (Zhao & Cawood, Reference Zhao and Cawood2012). After a long period of stability, intense structural deformation developed in the central NCC during the late Middle Jurassic, with many NE-trending folds and thrust faults, and the directions of tectonic lines converted from the previous E–W to the NE-NNE direction (Li et al. Reference Li, Guo, Xu, Somerville, Cao, Yu, Wang, Suo, Liu and Zhao2015). Meanwhile, voluminous late Mesozoic magmatic intrusions are exposed in the regions of the Taihang Mountains, central NCC, such as the Han–Xing and Fuping–Wutai districts (Chen et al. Reference Chen, Jahn and Suzuki2004). The Han–Xing district in the south Taihang Mountains is mainly composed of diorite, monzonite and syenite, and the Fuping–Wutai district in the north Taihang Mountains is mainly composed of monzonitic granite and granodiorite (Gao et al. Reference Gao, Santosh, Wei, Ma, Chen and Wu2013; Li et al. Reference Li, Santosh, Li and Guo2014; Sun et al. Reference Sun, Xiao, Zhan, Wu, Zhu, Huang, Bai and Zhang2015).
(a) Tectonic units of the North China Craton (after Zhao & Cawood, Reference Zhao and Cawood2012); (b) distribution of Mesozoic magmatic intrusions in the southern Taihang Mountains (after Sun et al. Reference Sun, Xiao, Zhan, Wu, Zhu, Huang, Bai and Zhang2015); (c) geological map of the Fushan pluton (modified after a 1:25 000 geological map of Changzhi City and its peripheral area, 2008).

The Han–Xing district, which is named after two cities (Handan and Xingtai), has outcrops of an Archaean–Proterozoic basement covered by unmetamorphosed Palaeozoic limestones that are intruded by a number of dioritic and monzonitic plutons (Fig. 1b). The Han–Xing district is famous for its numerous iron skarn deposits along the contact belts between the Mesozoic intrusions and Middle Ordovician carbonate rocks (Zheng et al. Reference Zheng, Griffin, O’Reilly, Yu, Zhang, Pearson and Zhang2007b; Shen et al. Reference Shen, Santosh, Li, Zhang, Yin, Dong, Wang, Ma and Yu2013). The Mesozoic magmatic belt in this district is mainly composed of the Fushan, Wu’an and Hongshan intrusive complexes (Chen et al. Reference Chen, Jahn and Suzuki2004). The Fushan intrusive rocks are composed of monzogabbro, diorite, monzonite and quartz monzonite. The Wu’an intrusive rocks are mainly composed of diorite, monzonite and quartz monzonite, and the Hongshan pluton includes syenite and granite.
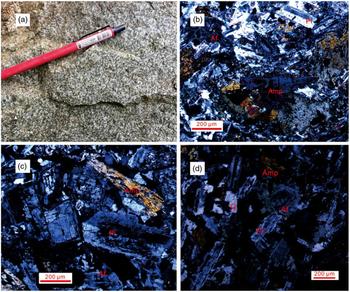
The studied samples were collected from the Fushan pluton, including monzonite and quartz monzonite (Figs. 1c and 2a). The monzonite samples are medium-grained and consist of hornblende (20–30 vol. %), plagioclase (35–45 vol. %), K-feldspar (20–30 vol. %), Fe–Ti oxides (<10 vol. %) and a few accessory minerals, e.g. zircon and apatite (Fig. 2b, c). The quartz monzonites are also medium-grained and consist of plagioclase (40–50 vol. %), K-feldspar (25–30 vol. %), quartz (<10 vol. %), hornblende (<15 vol. %), Fe–Ti oxides (<5 vol. %) and a few accessory minerals, e.g. zircon and apatite (Fig. 2d).
(a) Macroscopic image of monzonitic rocks. (b–d) Photomicrographs of representative samples (cross-polarized light): (b) monzonite (QS35-10); (c) monzonite (QS35-4); (d) quartz monzonite (QS35-11). (Amp = amphibole, Q = quartz, Af = alkali–feldspar, Pl = plagioclase.)

3. Analytical methods
3.a. Zircon U–Pb dating and Lu–Hf isotope analyses
The zircon grains were separated by density and magnetic techniques followed by hand-picking under a binocular microscope. Cathodoluminescence (CL) imaging was performed by a JEOL (JSM-6510) scanning electron microscope fitted with a Gatan MiniCL detector to show the internal structures. In situ zircon U–Pb dating was conducted by laser ablation inductively coupled plasma mass spectrometry (LA-ICP-MS) at the Testing Center of Shandong Bureau, China Metallurgical Geology Bureau (Jinan, China). A Thermo Scientific iCAP™ Q ICP-MS instrument was equipped with a GeoLasPro 193 nm ArF Excimer Laser (Coherent Inc.) laser ablation system. The diameter of the laser ablation craters was 32 µm. The analytical procedure and precision are described by Li et al. (Reference Li, Li, Suo, Dai, Guo, Ge and Lin2018 b), and the detailed procedures follow Liu et al. (Reference Liu, Gao, Hu, Gao, Zong and Wang2010). The zircon standard Plešovice (337 ± 0.37 Ma) (Sláma et al. Reference Sláma, Košler, Condon, Crowley, Gerdes, Hanchar, Horstwood, Morris, Nasdala, Norberg, Schaltegger, Schoene, Tubrett and Whitehouse2008) was used as an external standard.
The in situ zircon Lu–Hf isotopes were measured using a Neptune Plus Multi-Collector ICP-MS (MC-ICP-MS, Thermo Fisher) in combination with a GeoLas HD 193 excimer ArF laser ablation system at the Guangxi Key Laboratory of Hidden Metallic Ore Deposits Exploration, Guilin University of Technology (Guilin, China). The detailed analytical procedures, precision and data calibration are described by Huang et al. (Reference Huang, Xu, Chen, Wu, Zeng, Xiong, Chen and Yu2016). The analytical spots used a beam size of 45 µm, and the standard zircon GJ-1 was used to evaluate the reliability of the analytical data, which yielded a weighted mean 176Hf/177Hf ratio of 0.282006 ± 0.000004 (2σ, n = 20). This value was in good agreement with the recommended value (0.282000 ± 0.000005, Morel et al. Reference Morel, Nebel, Nebel-Jacobsen, Miller and Vroon2008). The ε Hf(t) values were calculated using chondritic ratios of 176Hf/177Hf = 0.282785 and 176Lu/177Hf = 0.0336 (Bouvier et al. Reference Bouvier, Vervoort and Patchett2008) and a decay constant λ for 176Lu of 1.865 × 10⁻¹¹ a−1 (Scherer et al. Reference Scherer, Münker and Mezger2001). The single-stage Hf model ages (T DM1) were calculated based on a depleted mantle source with 176Hf/177Hf = 0.28325 and 176Lu/177Hf = 0.0384 (Vervoort & Blichert-Toft, Reference Vervoort and Blichert-Toft1999), the two-stage Hf model ages (T DM2) were calculated using an average continental crustal value (176Lu/177Hf = 0.015) (Griffin et al. Reference Griffin, Wang, Jackson, Pearson, O’Reilly, Xu and Zhou2002), and the evolution of the lower mafic crust using a value of 176Lu/177Hf = 0.022 (Amelin et al. Reference Amelin, Lee, Halliday and Pidgeon1999).
3.b. Major and trace element and Sr–Nd isotope analyses
The whole-rock major and trace element compositions were analysed at the Testing Center of Shandong Bureau, China Metallurgical Geology Bureau. For the major element analyses, the prepared samples were fused using a lithium tetraborate (Li2B4O7) – lithium metaborate (LiBO2) – lithium fluoride (LiF) flux with a fluxing agent of lithium bromide (LiBr). The resultant fused disc was measured by X-ray fluorescence spectrometry (XRF, ARL 9900XP instrument) for the major element compositions, with analytical precision and accuracy better than 5 %. For the trace element analyses, the sample powders (˜100 mg, <200 mesh) were digested in Teflon bombs by hydrofluoric and nitric acids (3 mL HF and 2 mL HNO3) and heated in an oven for 48 hours at ˜185 °C. Then, the solution was evaporated to dryness at ˜130 °C, 2 mL HNO3 was added and the solution was distilled to dryness again. After drying, 1.5 mL HNO3 and 1.5 mL ultrapure water were added for redissolution, and the solution was heated in a bomb at ˜180 °C for 12 hours and then the final solution was diluted to 100 mL. The trace elements were measured by a Thermo X Series 2 ICP-MS, and the analytical accuracies were better than 10 %.
Whole-rock Sr–Nd isotope analyses were performed on a Finnigan MAT-262 thermal ionization mass spectrometer (TIMS) at the Key Laboratory of Crust–Mantle Materials and Environments, Chinese Academy of Sciences, University of Science and Technology of China (Hefei, China). The sample powders (˜100 mg, <200 mesh) for the Sr–Nd isotopic analyses were dissolved in HClO4–HF for ˜7 days in Teflon screw-cap beakers at ˜200 °C. Details of the separation and concentration of Sr, Nd and REEs and the analytical techniques are given in Chen et al. (Reference Chen, Satir, Ji and Zhong2002). The measured data were normalized to 86Sr/87Sr = 0.1194 and 146Nd/144Nd = 0.7219 (Thirlwall, Reference Thirlwall1991). The measured 87Sr/86Sr ratios were 0.710247 ± 0.000012 (2σ, n = 6) for the NBS987 standard and 0.703983 ± 0.000009 (2σ, n = 3) for the AGV-2 standard. The measured 143Nd/144Nd ratios were 0.512116 ± 0.000009 (2σ, n = 6) for the Jndi-1 standard, and 0.512793 ± 0.000010 (2σ, n = 3) for the AGV-2 standard.
4. Results
4.a. Zircon U–Pb ages
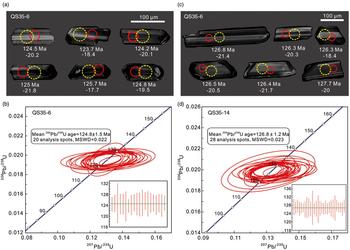
The zircon U–Pb dating results are listed in Supplementary Table S1 in the online Supplementary Material (available at https://doi.org/10.1017/S0016756819000256). Zircon grains from a monzonite sample (QS35-14) are euhedral to subhedral and display oscillatory zoning (Fig. 3a), which is typical of magmatic zircon. Twenty-eight analytical spot analyses were obtained on 28 zircon grains. These analyses record 191–1000 ppm Th, 140–454 ppm U and high Th/U ratios (1.0–2.2). The zircons are concordant with 206Pb/238U ages of 126.1–127.7 Ma, yielding a weighted mean 206Pb/238U age of 126.8 ± 1.2 Ma (MSWD =0.023, n = 28) (Fig. 3b). This age is interpreted as the crystallization age of the monzonite.
CL images of representative zircons and zircon U–Pb concordia diagrams. (a, b) Monzonite sample (QS35-14); (c, d) quartz monzonite sample (QS35-6). Red solid circles indicate U–Pb dating spots, whereas yellow dashed circles indicate Hf isotope analysis spots. Ages and ε Hf( t) values are also shown for each spot.

Zircon grains from a quartz monzonite sample (QS35-6) are also euhedral to subhedral and display oscillatory zoning (Fig. 3c), typical for magmatic zircon. Twenty-two analytical spot analyses were obtained on 22 zircon grains and record 165–3377 ppm Th and 167–1088 ppm U with high Th/U ratios (1.0–3.1). The zircons show concordant 206Pb/238U ages ranging from 123.7 to 125.7 Ma, yielding a weighted average of 124.6 ± 1.5 Ma (MSWD = 0.022, n = 22) (Fig. 3d). This age is interpreted as the formation age of the quartz monzonite.
4.b. Major and trace elements
The whole-rock major and trace element data for the samples are listed in Supplementary Table S2 in the online Supplementary Material (available at https://doi.org/10.1017/S0016756819000256). The geochemical compositions of the samples fall mainly into the range of monzonite and quartz monzonite on the TAS (total alkali silica) diagram (Fig. 4a). The monzonite samples have intermediate SiO2 (55.71–61.31 wt %) and high K2O and Na2O contents, showing calc-alkaline, magnesian (FeOT/(FeOT + MgO) values of 0.5–0.7) and peraluminous to metaluminous features with A/CNK values (Al2O3/(CaO + K2O + Na2O) mole ratio) of 0.97–1.11 and A/NK values (Al2O3/(K2O + Na2O) mole ratio) of 1.38–1.76 (Fig. 4b, c, d). The monzonites have high Fe2O3 T (4.04–8.44 wt %), MgO (2.79–6.05 wt %) and CaO contents and moderate Al2O3, TiO2 and P2O5 contents (Fig. 5). The quartz monzonites (SiO2, 63.06–65.05 wt %) display variable geochemical features with the monzonites, e.g. calc-alkaline to alkalic, magnesian to ferroan, and metaluminous characteristics (A/CNK values of 0.7–0.8; A/NK values of 1.4–1.8) (Fig. 4b, c, d). The quartz monzonites have higher SiO2 and Al2O3 and lower MgO (0.29–1.93 wt %), Fe2O3 T (1.98–4.27 wt %), CaO, TiO2 and P2O5 contents than the monzonites (Fig. 5). They also show lower Cr (6–26 ppm), Ni (4–10 ppm) and V (34–74 ppm) concentrations than those of the monzonites (Cr = 23–257 ppm, Ni = 10–88 ppm and V = 117–163 ppm).
(a) (K2O + Na2O) vs SiO2 (TAS; after Le Maitre, Reference Le Maitre2002); (b) A/CNK vs A/NK (after Maniar & Piccoli, Reference Maniar and Piccoli1989); (c) FeOT/(FeOT+ MgO) vs SiO2; and (d) (Na2O + K2O–CaO) vs SiO2 (after Frost et al. Reference Frost, Barnes, Collins, Arculus, Ellis and Frost2001). All samples were normalized to 100 % after excluding the loss on ignition (LOI). A/CNK = Al2O3/(CaO + Na2O + K2O) in mole ratio; A/NK = Al2O3/(Na2O + K2O) in mole ratio. Data sources: Early Cretaceous intrusive rocks in the southern Taihang Mountains: Dongye pluton (gabbro) (Wang et al. Reference Wang, Fan, Zhang and Peng2006), Fushan pluton (Dong et al. Reference Dong, Chen and Zhou2003; Chen et al. Reference Chen, Jahn and Suzuki2004; Peng et al. Reference Peng, Wang, Guo and Peng2004; Xu et al. Reference Xu, Li, Pang and He2009b) and other plutons (Chen et al. Reference Chen, Jahn and Suzuki2004; Sun et al. Reference Sun, Xiao, Zhu, Wu, Deng, Bai and Wen2014, Reference Sun, Xiao, Zhan, Wu, Zhu, Huang, Bai and Zhang2015).

Variations in (a) SiO2 vs MgO, (b) Fe2O3 T, (c) Al2O3, (d) CaO, (e) Na2O, (f) TiO2. All samples were normalized to 100 % after excluding LOI. Data sources as shown in Figure 4.

The trace element compositions of the monzonites and quartz monzonites are similar. Their chondrite-normalized REE patterns show enrichment in LREEs and nearly flat HREE patterns ((La/Yb)N = 10–24; (La/Sm)N = 3.3–6.8; (Gd/Yb)N = 1.8–2.3), with slightly positive Eu anomalies (Eu/Eu* = 1.0–1.2) (Fig. 6a, b). In the primitive mantle-normalized spider diagram (Fig. 6c, d), most samples show significant enrichment in Ba and Sr and depletion in Nb and Ta with variable Rb depletion.
(a) Chondrite-normalized REE patterns and (b) primitive mantle-normalized trace element diagrams for the monzonitic rocks in the Fushan pluton. Normalization values are from McDonough & Sun (Reference McDonough and Sun1995).

4.c. Sr–Nd isotopes
The whole-rock Sr–Nd isotope compositions of the samples are listed in Supplementary Table S3 in the online Supplementary Material (available at https://doi.org/10.1017/S0016756819000256). The initial 87Sr/86Sr ratios and ε Nd(t) values are calculated using their zircon U–Pb ages obtained in this study. The monzonites show calculated initial 87Sr/86Sr ratios ranging from 0.70653 to 0.70763 and ε Nd(t) values ranging from −13.6 to −17.6 (Fig. 7), with two-stage Nd model ages (T DM2 (Nd)) of 1.7–2.0 Ga. The quartz monzonites have similar ε Nd(t) values (−15.6 to −18.6) and higher initial 87Sr/86Sr ratios (0.70766–0.70819) than the monzonites, with T DM2 (Nd) ages of 1.9–2.1 Ga.
Initial 87Sr/86Sr vs ε Nd( t) diagram. Data sources: Early Cretaceous intrusive rocks in the southern Taihang Mountains as shown in Figure 4; Late Mesozoic magmatic rocks in the NCC: high Sr/Y lava in the NCC (Ma et al. Reference Ma, Zheng, Xu, Griffin and Zhang2015); mafic rocks in the Taihang Mountains (Wang et al. Reference Wang, Fan, Zhang and Peng2006); asthenospheric mantle-derived mafic rocks (107–78 Ma) (Ma et al. Reference Ma, Jiang, Hofmann, Dai, Hou, Zhao, Chen, Li and Jiang2014); EM1-SCLM and EM2-SCLM (Li et al. Reference Li, Li, Suo, Somerville, Huang, Liu, Wang, Han and Jin2018 c); LCNC (lower crust of North China) (Jiang et al. Reference Jiang, Guo and Chang2013); NCC lower crust and NCC upper crust (Jahn et al. Reference Jahn, Wu, Lo and Tsai1999).

4.d. Zircon Hf isotopes
The zircon Lu–Hf isotope compositions are listed in Supplementary Table S4 in the online Supplementary Material (available at https://doi.org/10.1017/S0016756819000256). The zircon grains from the monzonite (sample QS35-14) have calculated initial176Hf/177Hf ratios of 0.282077–0.282205 and ε Hf(t) values of −21.8 to −17.3 (Fig. 8). The zircons show depleted mantle model ages (T DM1 (Hf)) of 1.7–1.5 Ga and two-stage Hf model ages (T DM2(Hf)) of 2.5–2.2 Ga. The zircon grains from the quartz monzonite (sample QS35-6) have initial 176Hf/177Hf ratios (0.282076–0.282189), ε Hf(t) values (−21.8 to −17.8), T DM1 (Hf) ages (1.7–1.5 Ga) and T DM2 (Hf) ages (2.5–2.3 Ga) similar to those of the monzonite sample.
Zircon 206Pb/238U ages vs ε Hf( t) diagram. Data sources for other intrusive rocks in the southern Taihang Mountains: diorite, monzonite, and syenite (Chen et al. Reference Chen, Tian, Jahn and Chen2008; Sun et al. Reference Sun, Xiao, Zhu, Wu, Deng, Bai and Wen2014, Reference Sun, Xiao, Zhan, Wu, Zhu, Huang, Bai and Zhang2015).

5. Discussion
5.a. Timing of Early Cretaceous magmatism in the Han–Xing district
The zircon U–Pb dating of the monzonite (QS35-14) and quartz monzonite (QS35-6) samples yields emplacement ages in the Early Cretaceous, 126 ± 1 Ma and 124 ± 1 Ma, respectively. The previous geochronological studies, e.g. whole-rock Rb–Sr and mineral K–Ar dating, show scattered ages (˜218–63 Ma, summarized by Sun et al. (Reference Sun, Xiao, Zhan, Wu, Zhu, Huang, Bai and Zhang2015)) for the Mesozoic intrusions from the Han–Xing district and adjacent regions in the southern Taihang Mountains, central NCC. Recently, more precise dating results, e.g. zircon U–Pb and mineral 40Ar–39Ar dating, have been conducted for these igneous rocks. In the Fushan pluton, the zircon U–Pb dating of the intrusive rocks mainly yields emplacement ages of ˜128–125 Ma (Peng et al. Reference Peng, Wang, Guo and Peng2004; Xu et al. Reference Xu, Li, Pang and He2009b; Deng et al. Reference Deng, Li and Wen2015). In the Wu’an complexes, zircon U–Pb dating shows that the diorite and monzonite were emplaced ˜134–127 Ma (Chen et al. Reference Chen, Tian, Jahn and Chen2008; Deng et al. Reference Deng, Li and Wen2015; Sun et al. Reference Sun, Xiao, Zhu, Wu, Deng, Bai and Wen2014, Reference Sun, Xiao, Zhan, Wu, Zhu, Huang, Bai and Zhang2015). In the Hongshan pluton, the zircon U–Pb dating of the syenite shows emplacement ages of ˜135–130 Ma (Chen et al. Reference Chen, Tian, Jahn and Chen2008; Sun et al. Reference Sun, Xiao, Zhan, Wu, Zhu, Huang, Bai and Zhang2015) and a Rr–Sr isochron age of ˜138 Ma (Chen et al. Reference Chen, Tian, Jahn and Chen2008; Sun et al. Reference Sun, Xiao, Zhan, Wu, Zhu, Huang, Bai and Zhang2015). The Early Cretaceous gabbroic rocks in the southern Taihang Mountains were emplaced ˜125 Ma (Wang et al. Reference Wang, Fan, Zhang and Peng2006). The Early Cretaceous intrusions in the adjacent regions of the Handan–Xingtai district, southern Taihang Mountains, show similar ages of ˜131–118 Ma (Peng et al. Reference Peng, Wang, Guo and Peng2004; Ying et al. Reference Ying, Zhang and Tang2011; Li et al. Reference Li, Santosh, Li and Guo2014; Wang et al. Reference Wang, Zeng, Chen, Cai, Yan, Hou and Wang2017). Meanwhile, the hydrothermal zircon U–Pb and phlogopite 40Ar–39Ar dating for magnetite-bearing skarns yields ages ranging from 137 to 129 Ma, which implies that the timing of the iron skarn mineralization is consistent with the emplacement ages of the ore-related intrusions in the Handan–Xingtai district (Zheng et al. Reference Zheng, Griffin, O’Reilly, Yu, Zhang, Pearson and Zhang2007b; Shen et al. Reference Shen, Santosh, Li, Zhang, Yin, Dong, Wang, Ma and Yu2013; Deng et al. Reference Deng, Li and Wen2015). In addition, previous geochronological studies show that the late Mesozoic magmatism in the eastern NCC mainly happened in the Early Cretaceous (˜136–115 Ma) time with a giant igneous event (Wu et al. Reference Wu, Lin, Wilde, Zhang and Yang2005; Zhang et al. Reference Zhang, Zhao, Davis, Ye and Wu2014). Then, intense late Mesozoic magmatic activity concentrated in the Han–Xing district and adjacent regions, southern Taihang Mountains, developed in the Early Cretaceous (˜138–118 Ma).
5.b. Petrogenesis of monzonites and quartz monzonites
5.b.1. Crustal contamination and fractional crystallization
The Fushan pluton intruded into the Upper Cambrian to Ordovician carbonate rocks and carried small xenoliths from the country rocks, especially the peridotite xenoliths in the dioritic rocks (Xu et al. Reference Xu, Yang, Gao, Pei and Yu2010), implying that the melts were derived from the deep lithosphere and that the magma was emplaced rapidly. Meanwhile, the Sr–Nd isotopes of magmatic rocks in the Fushan pluton show nearly consistent ε Nd(t) values and slightly decreased Rb/Nb ratios with variable SiO2 contents (Fig. 9a, b). These features suggest that the melt assimilation with the wall rock was insignificant before their emplacement.
(a) SiO2 vs ε Nd( t), (b) SiO2 vs Rb/Nb and (c) Nb/La vs Nb/Zr diagrams. Data sources: Early Cretaceous intrusive rocks in the southern Taihang Mountains as shown in Figure 4. End-members used in the mixing model: mafic magma (sample 20HD-78 in Wang et al. Reference Wang, Fan, Zhang and Peng2006); acid lava (sample LMT-3 in Gao et al. Reference Gao, Santosh, Hou, Wei, Ma, Chen and Wu2012); lower crustal xenoliths from the central NCC: pyroxene-rich mafic granulite (JN0918 in Jiang et al. Reference Jiang, Carlson and Guo2011), intermediate granulite (JN0811 in Jiang et al. Reference Jiang, Carlson and Guo2011) and felsic granulite (ZB-20 in Liu et al. 2001, Reference Liu, Gao, Yuan, Zhou, Liu, Wang, Hu and Wang2004).

The major elemental compositions of the samples show broad distributions and variations and decrease with the increasing SiO2, including CaO, MgO, Fe2O3 T, TiO2 and P2O5, while Al2O3 and Na2O show the opposite trend (Fig. 5). These results indicate that the magmas of the Fushan pluton experienced a certain amount of fractional crystallization. The varied abundances and variations of the major and trace elements, e.g. MgO, Ni, Cr and the CaO/Al2O3 ratio, indicate the significant fractionation of ferromagnesian phases such as pyroxene (Fig. 10a, b). Meanwhile, the obvious fractional crystallization of amphibole is displayed by the variations in Ba and Sr and the Ba/Rb and Rb/Sr ratios (Fig. 1c, d), which are consistent with the presence of amphibole in the earlier phase of the rocks in the Fushan pluton but its absence in the rocks of the later phase. The separation of feldspar in the Fushan rocks appears minor, as suggested by the positive correlation between Al2O3 and SiO2 (Fig. 10b) and positive Ba, Sr and Eu anomalies (Fig. 6). The fractionation of the minor and accessory minerals, e.g. titanite and apatite, is also shown by the related elemental variations in the TiO2 and P2O5 contents (Fig. 5e, f). Thus, the above arguments suggest that the fractionation of ferromagnesian minerals, e.g. amphibole, was significant at the earlier stage of magma evolution in the magma chamber, while the feldspar removal was minor during the magma evolution process.
Element variations of (a) CaO/Al2O3 vs MgO; (b) Cr vs Ni; (c) Ba vs Sr; and (d) Rb/Sr vs Sr. Data sources as shown in Figure 4.

5.b.2. Source of magma
The monzonites and quartz monzonites have intermediate SiO2 with relatively high mafic components, such as high Fe2O3 T, MgO, Cr and Ni contents with high Mg# values (Figs. 5a, b and 10a), implying that the parental magma was derived from the mantle, which is in accordance with previous studies (Chen et al. Reference Chen, Jahn and Suzuki2004; Xu et al. Reference Xu, Li, Pang and He2009b). The monzogabbros, monzonites and quartz monzonites from the Fushan pluton display nearly uniform Sr–Nd–Hf isotope components, suggesting they were not generated from a single juvenile lithospheric mantle or asthenospheric mantle (Huang et al. Reference Huang, Xu, Chen, Wu, Zeng, Xiong, Chen and Yu2016). They are all enriched in large ion lithophile elements (LILEs) and LREEs and depleted in high field strength elements (HFSEs); these features suggest that they could be derived from enriched lithospheric mantle similar to the EM-1 type enriched mantle (Fig. 7). A considerable amount of amphibole occurs in the monzonites, indicating that the parental magma of the monzonites included a quantity of water. Therefore, the enriched lithospheric mantle could have experienced fluid-related subduction metasomatism (Fig. 11b). The high Ba/Rb and low Rb/Sr ratios also imply the presence of amphibole in the mantle source of monzonites, rather than phlogopite (Furman & Graham, Reference Furman and Graham1999) (Fig. 11c). In addition, the mantle metasomatism would considerably increase the concentrations of incompatible trace elements (e.g. Ba, Th, U, Sr and LREEs) in the mantle source by metasomatic agents, e.g. silicate melts, carbonate melts or C-H-O-rich fluids (Rudnick et al. Reference Rudnick, McDonough and Chappell1993; Tarney and Jones, Reference Tarney and Jones1994; Blundy and Dalton, Reference Blundy and Dalton2000). Compared with silicate metasomatism, carbonatitic metasomatism is often characterized by extreme LILE enrichment and obvious REE fractionation (Rudnick et al. Reference Rudnick, McDonough and Chappell1993; Blundy and Dalton, Reference Blundy and Dalton2000). Most samples show moderate LILE enrichment, and even depletion in Rb, and no HREE fractionation, which suggest silicate metasomatism rather than carbonatitic metasomatism. The samples show low Dy/Yb (1.6–1.9) and (Gd/Yb)N ratios (2.0–2.3) (Figs. 6, 11d), which suggest that they were mainly derived from spinel-facies mantle. The ancient Proterozoic isotopic model ages of the Fushan monzonites and quartz monzonites from Nd and Hf isotopes suggest that the enriched lithospheric mantle source could have been metasomatized by ancient subducted crustal materials. Therefore, the parental magma of the monzonites and quartz monzonites could mainly have been derived from the partial melting of a spinel-facies amphibole-bearing ancient (EM1-like) enriched lithospheric mantle source.
Diagrams of (a) La/Nb vs Ba/Nb (after Jahn et al. Reference Jahn, Wu, Lo and Tsai1999); (b) [Ta/La]N vs [Hf/Sm]N (after La Fleche et al. Reference La Fleche, Camire and Jenner1998). N stands for primitive mantle-normalized. (c) Rb/Sr vs Ba/Rb; (d) SiO2 vs Dy/Yb (after Davidson et al. Reference Davidson, Turner, Handley, MacPherson and Dosseto2007). Data sources as shown in Figure 4.

5.c. Genesis of high Ba–Sr and high Sr/Y signals
Previous studies have shown that other Early Cretaceous magmatic rocks in the Taihang Mountains also display high Ba–Sr or high Sr/Y signatures, and their genesis has been debated for a long time, with several suggestions such as the magma mixing of siliceous crustal melts and basaltic magma from metasomatized mantle (Chen et al. Reference Chen, Tian, Jahn and Chen2008, Reference Chen, Jahn, Arakawa and Zhai2013; Wang et al. Reference Wang, Zeng, Chen, Cai, Yan, Hou and Wang2017), partial melting of the delaminated lower crust interacting with mantle peridotite (Xu et al. Reference Xu, Yang, Gao, Pei and Yu2010), partial melting of the ancient lower continental crust emphasizing source inheritance (Qian & Hermann, Reference Qian, Chung, Li and Wen2010) or efficient magmatic processes of crystal fractionation (Gao et al. Reference Gao, Santosh, Hou, Wei, Ma, Chen and Wu2012). In this study, the Fushan monzonites and quartz monzonites exhibit two important geochemical features: high Ba–Sr and high Sr/Y signatures. They display the geochemical features of high Ba (289–2454 ppm) and Sr (395–1756 ppm), similar to the defined high Ba–Sr intrusions (Ba and Sr in excess of 1000 ppm) (Fig. 1c), high alkali elements and varying MgO (<16 wt %) and SiO2 (>47 wt %) contents (Fowler et al. Reference Fowler, Henney, Darbyshire and Greenwood2001). Most of the samples also have high Sr/Y (>20) signatures with high Sr (>350 ppm), low Y (<17 ppm) and Yb (<1.8 ppm) contents, and a lack of obvious Eu anomalies, similar to adakitic rocks (Drummond & Defant, Reference Drummond and Defant1990; Martin et al. Reference Martin, Smithies, Rapp, Moyen and Champion2005; Castillo, Reference Castillo2012) (Fig. 12). Firstly, the samples show some geochemical features different from those of typical adakitic rocks in modern subduction zones, which have higher La/Yb ratios and depleted Sr–Nd isotopes (Castillo, Reference Castillo2012). Additionally, the adakitic rocks, formed by the partial melting of a thickened/delaminated lower crust, usually have an obvious depletion and high differentiation in HREEs related to garnet in the restites, while these samples mainly show flat HREE patterns without obvious differentiation in HREEs (Figs. 6a, b and 10f) and are mainly derived from an enriched subcontinental lithospheric mantle (SCLM) source, which could not involve many thickened/delaminated lower crustal components. Previous studies have shown that the magma mixing of crust- and mantle-derived magmas played an important role in the genesis of the Early Cretaceous magmatic rocks in the NCC (Chen et al. Reference Chen, Tian, Jahn and Chen2008, Reference Chen, Jahn, Arakawa and Zhai2013). The mantle-derived magmatic rocks were developed in the central and eastern NCC during the Early Cretaceous, e.g. mafic dykes and intrusions (Wang et al. Reference Wang, Fan, Zhang and Peng2006). These rocks imply that the magmatic underplating influenced the deep crust beneath the central NCC (Zhai et al. Reference Zhai, Fan, Zhang, Sui and Shao2007). In addition, the deep crustal xenoliths carried by Cenozoic basalts in the NCC are usually dated to ˜160–140 Ma (Liu et al. 2001, Reference Liu, Gao, Yuan, Zhou, Liu, Wang, Hu and Wang2004; Jiang et al. Reference Jiang, Guo and Chang2013). These crustal xenoliths are considered as products of basaltic magmatic underplating into the lower crust during the late Mesozoic (Late Jurassic to Cretaceous), which then experienced the fractional crystallization of a magma chamber in the lower crust (Liu et al. Reference Liu, Gao, Yuan, Zhou, Liu, Wang, Hu and Wang2004). These mafic, intermediate and felsic granulite crustal xenoliths are used to represent the components of the lower to middle crust beneath the central NCC (Liu et al. Reference Liu, Gao, Jin, Hu, Sun, Zhao and Feng2001). The mixing of two end-members was modelled by the Early Cretaceous mantle-derived gabbro in the southern Taihang Mountains with different crustal xenoliths or volcanic rocks. The model results show that the elemental and isotopic features of the Fushan monzonites and quartz monzonites are not simply modelled by a mantle-derived magma mixed with a Cretaceous felsic or intermediate magma (Fig. 9a, b, c).
(a, b) Sr/Y vs Y (after Drummond & Defant, Reference Drummond and Defant1990; Ma et al. Reference Ma, Zheng, Xu, Griffin and Zhang2015); (c, d) La/Yb vs Yb (after Castillo, Reference Castillo2012) diagrams. (a) Partial melting curves calculated for the mafic lower crust of the NCC with different restites after Ma et al. (Reference Ma, Zheng, Xu, Griffin and Zhang2015). (c) partial melting trends of (a) eclogite (50:50 pyroxene: garnet), (b) 25 % garnet amphibolite (25:75), (c) 10 % garnet amphibolite (10:90) and (d) amphibolite, all with a starting N-MORB bulk composition after Castillo (Reference Castillo2012). (b, d) Modelled Rayleigh fractionation of hornblende: curves 1 and 2 after Richards & Kerrich (Reference Richards and Kerrich2007) and curve 3 after Gao et al. (Reference Gao, Santosh, Hou, Wei, Ma, Chen and Wu2012).

Even though the magma mixing model is required in their genesis, at least one of two other factors is needed to explain the high Ba–Sr and high Sr/Y signatures; one factor is that either crust- or mantle-derived magmas inherited these signatures from their sources, and the other factor is that magmatic processes such as crystal fractionation induced these features. The high Ba–Sr intrusions usually have varied rock types from appinite to granite with evolution from mafic to intermediate-acid rocks (Fowler et al. Reference Fowler, Henney, Darbyshire and Greenwood2001; Ye et al. Reference Ye, Li, Li and Zhang2008). Their high Ba–Sr features are usually inherited from the source, while the contents of Ba and Sr are obviously influenced by magmatic evolution, e.g. fractional crystallization (Fowler et al. 2001, Reference Fowler, Kocks, Darbyshire and Greenwood2008). The end-members of the mafic magma for the Fushan pluton are the monzogabbros (Chen et al. Reference Chen, Jahn and Suzuki2004; Xu et al. Reference Xu, Li, Pang and He2009b). The above arguments suggest that the fractionation of ferromagnesian minerals was significant during the earlier stage of magma evolution in the magma chamber, while the feldspar removal was minor. Thus, the monzonites are cogenetic with the monzogabbros and could be the products of a later stage in the magmatic evolution from mafic to intermediate rocks. The Fushan monzogabbros have lower SiO2 and higher MgO and Fe2O3 contents than the monzonites, with high Sr (569–732 ppm) and Ba (116–907 ppm) contents (Chen et al. Reference Chen, Jahn and Suzuki2004). Meanwhile, some contemporaneous gabbros occur near the Fushan pluton in the southern Taihang Mountains. For example, the Cretaceous (125 Ma) Dongye gabbro intrusions show features similar to those of the monzogabbros in their Sr (444–758 ppm) and Ba (409–899 ppm) values (Wang et al. Reference Wang, Fan, Zhang and Peng2006). However, the Fushan monzonite samples have higher Sr (395–1756 ppm) and Ba (289–1997 ppm) than the monzogabbros and gabbro intrusions (Fig. 8e). The fractional crystallization of amphibole could lead to obvious increases in the Ba and Sr concentrations, and the fractionation of feldspar would result in an obvious Sr decrease and varying Ba concentrations. The Fushan pluton indicates the fractional crystallization of amphibole and some feldspar from monzonites to quartz monzonites with increased Sr and Ba (Fig. 1c, d). Then, on the basis of the high Ba–Sr features inherited from the magmatic source, the high Ba–Sr contents could also reflect a great contribution by fractional crystallization.
The Fushan monzonite samples have low Yb (1.5–1.8 ppm) and Y (13–17 ppm) contents with high Sr/Y ratios (23–121). The Fushan monzogabbros and Dongye gabbro intrusions have similar low Yb (1.0–2.2 ppm) and Y (12–20 ppm) contents but lower Sr/Y ratios (28–57) (Wang et al. Reference Wang, Fan, Zhang and Peng2006; Chen et al. Reference Chen, Tian, Jahn and Chen2008). It is necessary to note that the monzogabbros with low SiO2 contents in the Fushan pluton also show geochemical features of adakitic rocks, with similarly low Yb and Y contents but lower Sr/Y ratios than the monzonites. These results imply that the geochemical features of the Fushan pluton, especially the low Yb and Y, are inherited from their original magma chamber or magma source. In addition, the Sr/Y ratios increase from the monzogabbros to monzonites, which could be related to the increased Sr contents with similar Y and Yb contents. As mentioned above, the Fushan pluton could have experienced a significant process of crystal fractionation from mafic to intermediate rocks, which may have facilitated the increase in the Sr content. The study of the genesis of adakitic rocks shows that the fractionation of hornblende usually induces higher Sr/Y ratios with increased Sr contents. In addition, the modelled partial melting curves show that the Fushan intrusive rocks are different because they are simply explained by the partial melting trends and the mafic lower crust of the NCC with different restites, which usually require a large degree of partial melting (Ma et al. Reference Ma, Zheng, Xu, Griffin and Zhang2015) (Fig. 12a) and a normal mid-ocean ridge basalt (N-MORB) bulk composition (Castillo, Reference Castillo2012) (Fig. 12c). Meanwhile, the modelled Rayleigh fractionation of hornblende can usually induce such Sr/Y and La/Y ratios (Fig. 12b, d). Therefore, the geochemical features of the Fushan intrusive rocks, e.g. high Ba–Sr concentrations and high Sr/Y ratios, are not only inherited from the magma source but also significantly enhanced by crystal fractionation during the magmatic evolution, e.g. the hornblende fractionation increased the Ba–Sr concentrations and Sr/Y ratios.
5.d. Tectonic implications
The destruction of the eastern NCC is mainly revealed by investigations of the magmatism and peridotite xenoliths, suggesting that a relatively cold, thick and refractory cratonic lithospheric mantle during the Palaeozoic was replaced by a hot, thin and fertile mantle during the Meso-Cenozoic (Gao et al. Reference Gao, Rudnick, Yuan, Liu, Liu, Xu, Ling, Ayers, Wang and Wang2004; Wu et al. Reference Wu, Walker, Yang, Yuan and Yang2006; Zheng et al. Reference Zheng, Griffin, O’Reilly, Yang, Li, Zhang, Zhang and Liou2006; Zhang, Reference Zhang2009; Zheng, Reference Zheng2009). The major hypotheses for this mechanism of destruction of the eastern NCC include the thermal–tectonic erosion of the Archaean lithospheric keel (Xu et al. Reference Xu, Yang, Pei and Yu2009a; Zheng, Reference Zheng2009), a peridotite–melt reaction to transform the lithospheric mantle (Zhang, Reference Zhang2009), the delamination of thickened lower continental crust and lithospheric mantle (Gao et al. Reference Gao, Rudnick, Yuan, Liu, Liu, Xu, Ling, Ayers, Wang and Wang2004; Xu et al. Reference Xu, Zhou, Pei, Yang, Gao, Li and Yang2013) and the multiple subduction and water addition events (Niu, Reference Niu2005; Windley et al. Reference Windley, Maruyama and Xiao2010). Some studies have argued for a lithospheric gravitational instability process that may explain the mechanism for the coexistence of ancient and juvenile lithospheric mantle components within the present-day NCC lithosphere (Wang et al. Reference Wang, Huang and Zhong2015, Reference Wang, Huang, Zhong and Chen2016 b). More importantly, the subduction of the Palaeo-Pacific Plate has received increasing recognition of its key role in the geodynamic processes beneath the East Asia continent, including the eastern NCC (Zhu et al. Reference Zhu, Yang and Wu2012; Zheng et al. Reference Zheng, Xu, Zhao and Dai2018).
The Early Cretaceous is considered as the major period for the destruction of the eastern NCC, which was accompanied by intense magmatism and mineralization (Xu et al. Reference Xu, Yang, Pei and Yu2009a; Zhu et al. Reference Zhu, Yang and Wu2012). The Cretaceous magmatism not only happened on the margin of the NCC but also produced a series of mafic to intermediate intrusions in the central NCC, including the Fushan pluton (Li, Reference Li2013; Zhang et al. Reference Zhang, Zhao, Davis, Ye and Wu2014). There are also some metamorphic core complexes (Liu et al. Reference Liu, Shen, Ji, Guan, Zhang and Zhao2013), extensional basins (Li et al. Reference Li, Zhao, Dai, Liu, Zhou, Santosh and Suo2012 b), and gold and iron deposits (Li et al. Reference Li, Bi, Selby, Chen, Vasconcelos, Thiede, Zhou, Zhao, Li and Qiu2012 a; Deng et al. Reference Deng, Li and Wen2015) that are coeval with the large-scale Early Cretaceous magmatism in the eastern and central NCC. These features imply that the eastern and central NCC were under a lithospheric extensional setting during the Early Cretaceous. Compared with the eastern NCC, the southern Taihang Mountains of the central NCC were mainly in an intracontinental setting during the late Mesozoic and could have experienced the Late Triassic – Late Jurassic and Late Jurassic – Early Cretaceous intracontinental orogenic processes inherited from the pre-existing thrust tectonics developed at an Early to Middle Triassic comprehensive collisional stage (Li et al. Reference Li, Guo, Xu, Somerville, Cao, Yu, Wang, Suo, Liu and Zhao2015). Meanwhile, the lithosphere beneath the central NCC could be complex, with the coexistence of ancient and newly accreted mantle and crustal components (Zheng et al. Reference Zheng, O’Reilly, Griffin, Lu, Zhang and Pearson2001; Tang et al. Reference Tang, Zhang, Ying, Su, Chu, Xiao and Zhao2013; Zhang et al. Reference Zhang, Zhu, Santosh, Ying, Su and Hu2013). These juvenile crustal and mantle materials could be related to asthenospheric upwelling and magmatic underplating under a lithospheric extensional setting (Zhai et al. Reference Zhai, Fan, Zhang, Sui and Shao2007; Tang et al. Reference Tang, Zhang, Ying, Su, Chu, Xiao and Zhao2013; Zhang et al. Reference Zhang, Zhu, Santosh, Ying, Su and Hu2013). Thus, these tectonic and magmatic events imply that the central NCC was under lithospheric extension in an intracontinental setting in the Early Cretaceous.
Studies of plate reconstructions show the Mesozoic geodynamic process of Palaeo-Pacific subduction beneath the East Asia continent, and the age of the subducting slab of the Palaeo-Pacific Plate gradually became younger (Seton et al. Reference Seton, Müller, Zahirovic, Gaina, Torsvik, Shephard, Talsma, Gurnis, Turner and Maus2012; Müller et al. Reference Müller, Seton, Zahirovic, Williams, Matthews, Wright, Shephard, Maloney, Barnettmoore and Hosseinpour2016). According to the width of the present subduction zone, the mantle wedge beneath the arc system seems to be unable to have extended to the central NCC (Maruyama et al. Reference Maruyama, Hasegawa, Santosh, Kogiso, Omori, Nakamura, Kawai and Zhao2009). Meanwhile, the present geophysical and seismic tomography display the stagnation of the Pacific Plate in the mantle transition zone beneath the East Asia continental margin and the formation of a big mantle wedge (Huang & Zhao, Reference Huang and Zhao2006; Zhao et al. Reference Zhao, Maruyama and Omori2007; Liu et al. Reference Liu, Zhao, Li and Wei2017). Some geochemical studies have suggested that the Mesozoic process could have been similar to the current subduction of the Pacific Plate beneath East Asia, forming a stagnant slab that extended down to the mantle transition zone (Li & Wang, Reference Li and Wang2018; Xu et al. Reference Xu, Li, Hong, Ma, Ma and Sun2018). Recently, reconstructions of the time-dependent dynamic topography of Eastern China have indicated that the slab of the Palaeo-Pacific Plate subducted into the deeper section of the upper mantle beneath East Asia during the Early Cretaceous (Cao et al. Reference Cao, Flament, Müller and Li2018). Meanwhile, the sinking and roll-back of the Palaeo-Pacific slab happened from the late Early Cretaceous to Late Cretaceous (Cao et al. Reference Cao, Flament, Müller and Li2018). In addition, the lithospheric extensional setting of the eastern NCC during the late Mesozoic is suggested to be related to the possible slab roll-back of the Pacific Plate (Yang et al. Reference Yang, O’Reilly, Walker, Griffin, Wu, Zhang and Pearson2010; Li et al. Reference Li, Li, Suo, Somerville, Huang, Liu, Wang, Han and Jin2018 c). Accordingly, the lithospheric extensional setting under the central NCC could have been related to the sinking and roll-back of the Palaeo-Pacific slab. Then, the slab sinking and roll-back of the Palaeo-Pacific Plate could have created an ancient big mantle wedge beneath East Asia and induced a lithospheric extensional process in the central NCC within an intracontinental setting during the Early Cretaceous.
6. Conclusions
A comprehensive geochronological, geochemical and Sr–Nd–Hf isotopic study of the monzonites and quartz monzonites from the Fushan pluton in the southern Taihang Mountains, central NCC, has led to the following conclusions: (1) zircon U–Pb dating results indicate that the Fushan pluton was emplaced during 126–124 Ma; (2) the primary magma of the Fushan pluton was a product of the partial melting of spinel-facies amphibole-bearing ancient (EM1-like) enriched lithospheric mantle; (3) the particular geochemical features of the Fushan pluton, e.g. high Ba–Sr and low Y and Yb contents with high Sr/Y ratios, are not only inherited from the magma source but also significantly enhanced by crystal fractionation during magmatic evolution, e.g. hornblende fractionation increased the Ba–Sr concentrations and Sr/Y ratios; and (4) the Fushan pluton was formed by lithospheric extension in an intracontinental setting in the central NCC during the Early Cretaceous, which was related to the slab sinking and roll-back of the Palaeo-Pacific Plate beneath East Asia.
Supplementary material
To view supplementary material for this article, please visit https://doi.org/10.1017/S0016756819000256.
Author ORCIDs
Xi-Yao Li, 0000-0001-9750-5408, San-Zhong Li 0000-0002-3436-2793
Acknowledgements
We thank Dr. Deering Chad and two anonymous referees for their valuable comments. This research was funded by the National Science and Technology Major Project (grant number 2016ZX05004001); the National Key Research and Development Program of China (grant numbers 2017YFC0601401, 2016YFC0601002); the National Natural Science Foundation of China (grant numbers 41602042, U1606401); and the Scientific and Technological Innovation Project (grant number 2016ASKJ13) of Qingdao National Laboratory for Marine Science and Technology. This work was also supported by the Taishan Scholar Program to Prof. San-Zhong Li.