Introduction
Despite formal equality and legal protection against discrimination, women remain underrepresented in the ranks of elected office in the United States. After an election in 2018 which some dubbed the second “Year of the Woman,” women still hold just 23.7% of seats in the US House and Senate. A woman’s election comes at the end of a long process of deciding to run for office, campaigning, and earning citizens’ votes; in this article, we examine the process by which women enter the political pipeline. Our prominence thesis posits that women who hold prominent statewide positions simultaneously reflect and alter the culture of a state to be more accepting of women politicians and in turn increase the number of women serving in state government. We examine multiple mechanisms by which prominent women may affect the gender composition of state legislatures, with a particular focus on differential effects by partisanship, because not only are politicians’ careers heavily guided by their party affiliation, the parties also diverge on many salient women’s issues and thus represent their constituents differently.
Scholars have argued that, as a consequence of political–cultural changes spurred by prominent women in politics, more women candidates will emerge and voters will be more open to voting for those candidates as women occupying political leadership roles becomes more normalized, which in turn creates a self-reinforcing cycle of electing more women to office (see, e.g., Ladam, Harden, and Windett Reference Ladam, Harden and Windett2018). Others have found that this self-reinforcing cycle is either very short-lived or nonexistent (Broockman Reference Broockman2014; Gilardi Reference Gilardi2015). Existing scholarship has largely ignored the effects of partisanship, however. Upon examining the effect of prominent women officeholders on same-party women’s representation in state legislatures, we find a positive prominence effect among Democratic women, and a negative prominence relationship among Republican women. That is, we find that as the number of prominent Democratic women officeholders increases, the number of Democratic women in state legislatures also increases. And as the number of prominent Republican women officeholders grows, the number of Republican women in state legislatures declines. Our findings suggest that scholars should not assume that women will necessarily serve as role models or inspiration for other women to run for office, but should closely examine the partisan context in which elected officials serve.
This article tests two mechanisms by which prominent women officeholders may exert influence on the gender composition of state legislatures, stemming from two important theories about women in politics. The first is the view that prominent women officeholders will inspire other women to launch their own political careers. We call this the pioneering women hypothesis, because it centers around the role of the individual women. In other words, individual women who have achieved success in prominent elected office may serve as role models and inspire other women to enter politics at the beginning stages of a political career, which would be reflected in the number of women elected to state legislatures. The second hypothesis we test posits that it is not that individual women are serving as role models, but that women elected to prominent statewide office reflect a cultural reality about that state, which makes the climate more welcoming for women to enter politics at all levels. We call this the pioneering states hypothesis. Together, the pioneering states and pioneering women frameworks represent the mechanism by which we expect the prominence thesis to work.
In the next section, we review the relevant literature and further develop the pioneering women and pioneering states hypotheses. After describing our data, we present evidence that the role model effect for women is limited when pooled across party lines, but present in differing ways for Democratic and Republican women. We conclude with suggestions for future research to expand upon the role of partisanship with regard to the role model effect for women legislators.
Running for Office: Existing Frameworks
The number of women serving in government holds normative importance because of its implications for the representation of women citizens. The descriptive representation of women, racial and ethnic minorities, and other groups historically excluded from positions of power in American society provides an opportunity for government to become more responsive to the needs of all of its citizens. By virtue of their shared life experiences, women and minority lawmakers are often better able to recognize and respond to the unique needs of constituents with whom they share these traits (Mansbridge Reference Mansbridge1999). Their presence in positions of power is important symbolically, providing a concrete example that people with certain traits can also succeed (Gay Reference Gay2002; Scherer and Curry Reference Scherer and Curry2010; Tate Reference Tate2001; Reference Tate2003). Descriptive representation can also translate into substantive representation (Gamble Reference Gamble2007; Lowande, Ritchie, and Lauterbach Reference Lowande, Ritchie and Lauterbach2019); Swers (Reference Swers2002; Reference Swers2013) shows that women serving in the US House and Senate systematically introduce more bills that are responsive to women’s needs, even controlling for differences in party platforms.
State legislatures are an essential vehicle for studying women’s descriptive representation for several reasons. First, because state legislatures are often a launching pad for political careers (Maestas et al. Reference Maestas, Fulton, Maisel and Stone2006), they are a good place to look when trying to explain the behavior of women who may be responding to inspiration from other women. A greater proportion of women in state legislatures also means that there will be more women in the conventionally qualified candidate pool for higher office. Furthermore, the breadth and diversity of state legislatures allow us to utilize a relatively large scope of data to make statistical comparisons. Forty-nine states have a bicameral legislature, each providing data on gender balance. Reliable data on legislative bodies’ gender composition reach back 44 years.Footnote 1 Our broad dataset allows us to leverage real-world trends in a variety of social and political environments to isolate any effect of prominent women officeholders that may be present. State legislatures’ importance goes beyond convenience, of course. Considering the impact of state legislatures on citizens’ daily lives and the fact that state legislatures remain one of the most accessible parts of American democracy, the democratic consequences of understanding the descriptive makeup of these legislative bodies are important in and of themselves.
Despite recent advances, gender imbalance in the highest rungs of politics persists. Scholars debate what is keeping women from prominent political positions. Some, such as Teele, Kalla, and Rosenbluth (Reference Teele, Joshua and Rosenbluth2018), find that implicit expectations about traditional social roles can force women into a double bind and make them less appealing candidates in the eyes of many voters.Footnote 2 Dolan (Reference Dolan2014), in contrast, has argued that abstract stereotypes that voters hold about women and men do not seem to guide vote choice when respondents are asked to choose between real-life men and women candidates. Other scholars (Bystrom Reference Bystrom, Carroll and Fox2018; Carlin and Winfrey Reference Carlin and Winfrey2009; Fridkin, Carle, and Serignese Reference Fridkin, Carle, Woodall and Rose2012) have looked to the media as a source of biased coverage, a line of thinking that gained considerable momentum in the popular press during the 2016 presidential campaign. However, Hayes and Lawless (Reference Hayes and Lawless2016) find that media coverage of women candidates is not nearly as biased as is usually presumed. Perhaps the most persuasive argument against bias as the main factor preventing women from holding public office is evidence that women who run win at equal rates as men (Burrell Reference Burrell1994; Clark et al. Reference Clark, Darcy, Welch, Ambrosius and Flammang1984; Darcy and Schramm Reference Darcy and Schramm1977; Lawless and Fox Reference Lawless and Fox2010, 49–50; Lawless and Pearson Reference Lawless and Pearson2008; Sanbonmatsu Reference Sanbonmatsu2006; Seltzer, Newman, and Leighton Reference Seltzer, Newman and Leighton1997). Nevertheless, existing research indicates that prominent women officeholders may have a greater effect on the number of women running for office than the number elected (Ladam, Harden, and Windett Reference Ladam, Harden and Windett2018). We treat the issue of women candidacies as separate from that of women elected to office, and focus on the number of women elected because the greatest impact on women’s representation comes through policy changes officials make once elected to office. However, since virtually all elected officials begin as candidates, mechanisms that increase a woman’s likelihood of running for office ultimately affect the number of women elected. Thus, while we focus on the number of women elected to state legislatures, we also consider the factors that go into making a woman into a candidate.
The first framework, which we call the pioneering women hypothesis, looks at the ability of women politicians to inspire other women to follow in their professional footsteps. Other scholars have used the term “role model effect” for this phenomenon. Campbell and Wolbrecht (Reference Campbell and Wolbrecht2006) show that girls and young women not yet old enough to vote or run for office anticipate being more politically active in adulthood when they are exposed to women role models as candidates and elected officials. We test the role model effect in a more limited time frame. The primary mechanism for the pioneering women hypothesis is the quantity of prominent officeholders increasing the visibility of women in public office, improving the electoral chances of subsequent women politicians. Due to the complex nature of assessing a politician’s job performance, particularly when gender is a consideration, we focus on women running for, and winning, office. Assessments of women’s performance once in office are another way that a state’s receptiveness to women politicians may change over time (Wagner Reference Wagner2019).
If the pioneering women hypothesis is true, we would expect a woman’s election to a high office to lead to at least a temporary increase in women serving in the state legislature within a few years. Indeed, Ladam, Harden, and Windett (Reference Ladam, Harden and Windett2018) find a significant effect of women role models on the number of female candidates for state office in following elections. Like us, they classify role models as women in higher office within the same state, rather than the same office in a neighboring jurisdiction. Our data, however, consider the party of both the prominent women officeholders and the state legislative officeholders. This allows us to test whether there is a role model effect that transcends party or if the phenomenon is mainly a party-congruent one (see, e.g., Reingold and Harrell Reference Reingold and Harrell2010), if it exists at all.
Other scholars have defined neighboring peers as role models and subsequently find the role model effect to be fleeting or nonexistent. Gilardi (Reference Gilardi2015), for example, examines the role model effect among women running for municipal office in Switzerland. He finds evidence for a strong role model effect, but one that lessens over time. Leveraging the unique political situation in Switzerland (women gained the right to participate in electoral politics quite late, in 1970), he posits that early electoral success by women is a powerful motivator to convince other potential candidates to run, but that the effect wears off relatively quickly as the popular understanding of women’s position in the political realm shifts.
Gilardi acknowledges that his data cover a limited geographic and historical context. Evidence from the United States shows no peer effect on either the number of women candidates or the number of women elected when a neighboring district is “treated” with an elected woman in a previous election (Broockman Reference Broockman2014).Footnote 3 These contradictory findings indicate that context matters for the way the role model effect plays out. The impact that one woman’s success has on others who might possibly follow in their footsteps varies across time and space.
Another view in the literature posits that women are constrained by a patriarchal society that discourages women from running for office in the first place. Women are less likely to think of themselves as qualified for office, less likely to be willing to subject themselves to a grueling and invasive campaign, and less open to being approached and asked to run by a party gatekeeper (Lawless and Fox Reference Lawless and Fox2010). Lawless and Fox contend that women are constrained by both a “masculinized ethos” and a “gendered psyche.” The masculinized ethos concept refers to the assumption that men are better leaders than women, which privileges masculinity and discourages women from considering taking on leadership roles themselves. The gendered psyche concept says that women will not be comfortable entering into a patriarchal system. Women are therefore constrained by a system that devalues their femininity and are further socialized to think that they have less to contribute. Further support for the gendered psyche theory comes from Kanthak and Woon’s (Reference Kanthak and Woon2015) experimental evidence that women are specifically averse to the idea of participating in a competitive election, whereas men are not. This research suggests that gender socialization leads many women to avoid the intrusive, competitive environment of political campaigns, regardless of their assessments of their own qualifications for the job.
Under the gendered psyche theory, more women reaching prominent political positions should indicate a changing culture in the state. It would predict a gradually increasing acceptance, by voters as well as potential candidates, of women inhabiting higher political positions, normalizing women as politicians and leaders. We test this cultural argument with what we call the pioneering states hypothesis. If the pioneering states hypothesis is true, we would expect prominent officeholders to be something of a proxy for the changing culture of the state, and to see more women serving in government at all levels in response to women having held prominent office in that state in the past. Here, we would expect that states that elected their first prominent woman officeholder longer ago would have more women in the state legislature, because the cultures of those states would have shifted to be more accepting of powerful women earlier and the state’s residents would have had longer to adjust to these expectations. In other words, while the pioneering women hypothesis asks how many women have been elected to prominent office in a state, the pioneering states hypothesis asks how long the state has been electing women to prominent office. We test this hypothesis by running regression models that include an independent variable representing the number of years since a state first elected a woman to the US Senate or governor’s mansion.
Data and Variable Specification
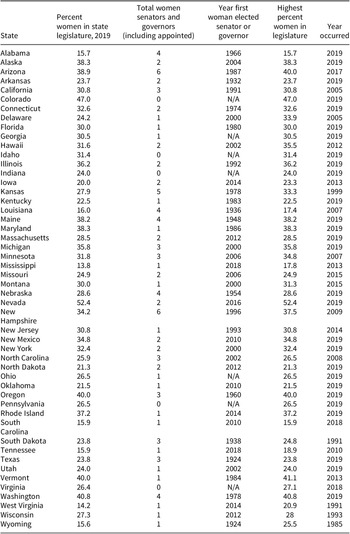
Our dataset considers all US state legislatures as the unit of analysis, spanning from 1975 to 2019. This allows us to utilize 2,250 unique observations. It is important to note that, because state legislators are elected to terms that encompass multiple years, there is relatively little turnover from the years immediately following elections (usually odd-numbered years) to the next year in any given state’s legislature.Footnote 4 A complete table of descriptive statistics including the percentage of women in each state’s legislature, the total number of women senators and governors in each state’s history, and the year that the first woman in each state won a US Senate seat or governorship is presented in Table 1.
Women in state legislatures
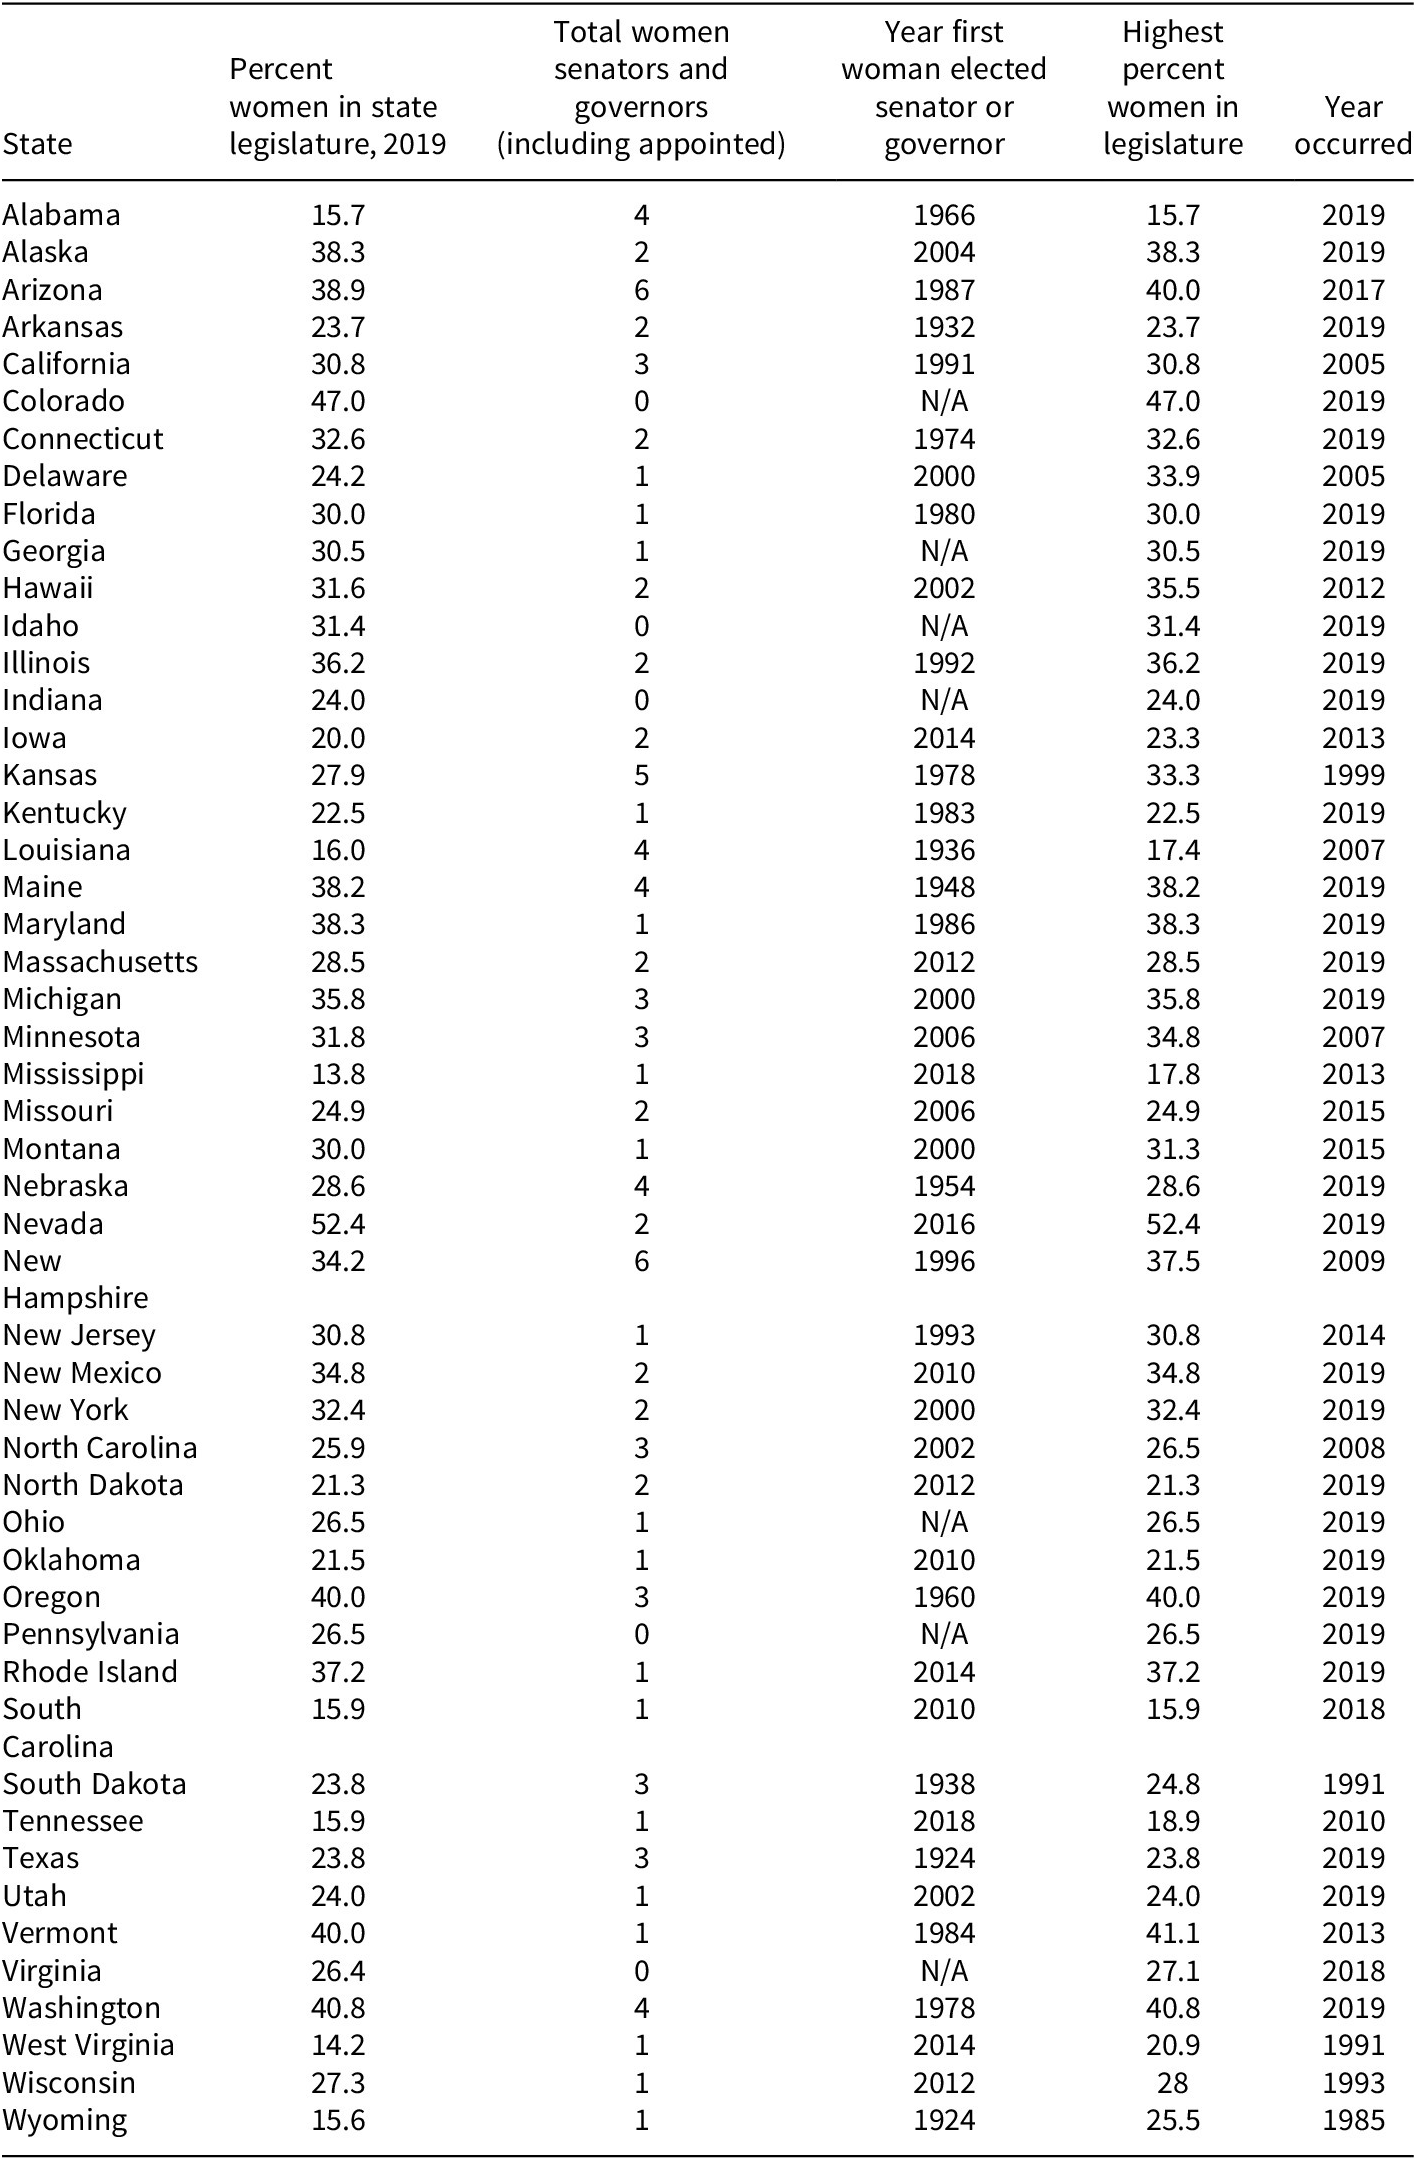
As a result of the 2018 elections, 2019 is a high-water mark for women’s representation in state legislatures, with an average of 28.8% women. Overall, 29 states saw their highest share of women comprising the state’s legislature in 2019. As we show, this increase is almost entirely driven by Democrats. Also following the 2018 elections, Nevada became the first state in US history to have more women than men serving in the state legislature, with 52.4% women. On the other hand, the lowest percentage of women in a state legislature is in Alabama, with 15.7%. The 2018 election also saw the first ever election of a woman Senator or Governor in two states, Mississippi and Tennessee. Five states (Colorado, Idaho, Indiana, Pennsylvania, and Virginia) have never had a woman serving as governor or senator. New Hampshire, on the other hand, has the highest number of women serving in a state’s history with six.
For each state legislature, we collected data using several variables that describe regional and cultural aspects of the state as well as measures for the prominence of women officeholders in that state. We describe each variable more fully in the next two sections.
Dependent Variables
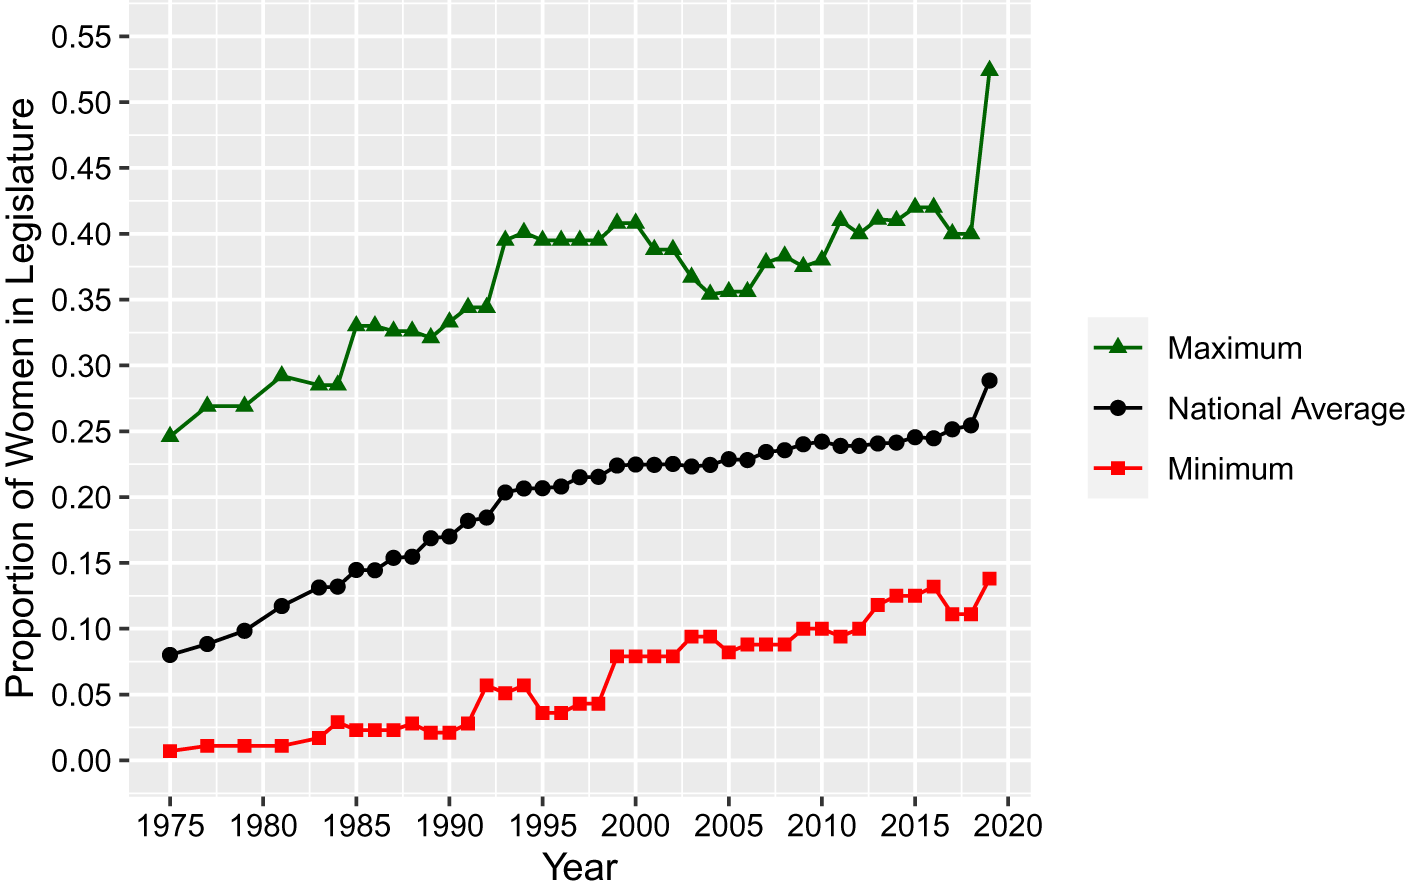
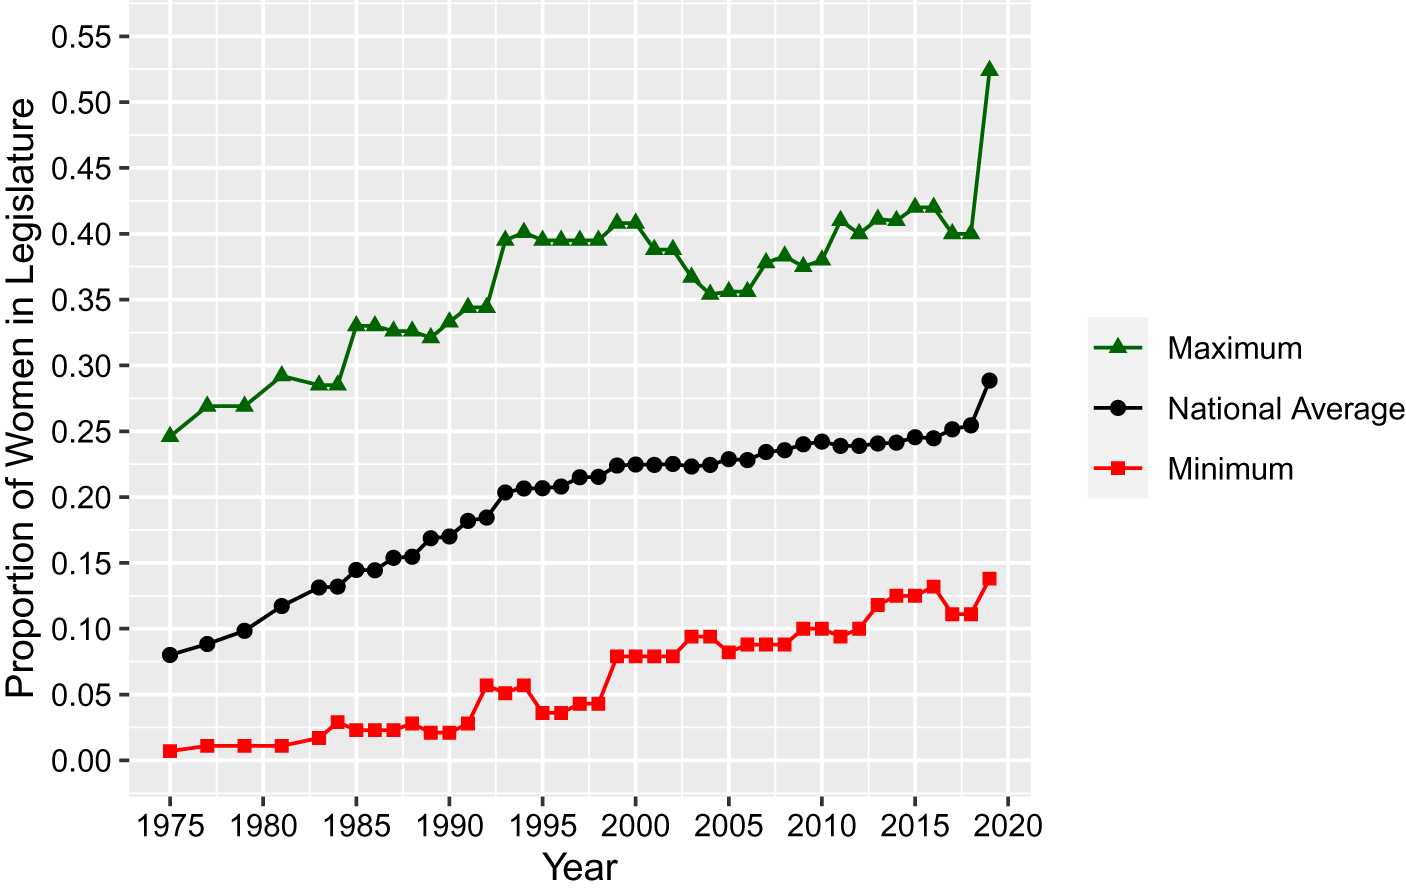
In our first set of analyses, the dependent variable is the percentage of women (of all parties) comprising each state’s legislature. The number of women serving in state legislatures has generally increased over time, although increases have been uneven within and across states. Figure 1 shows the overall historical trend more clearly. It charts the national average, maximum, and minimum proportion of women in state legislatures from 1975 to 2019. Again, 2019 stands out as landmark year for women’s representation in state legislatures, although the national average still stands under 30%.
Proportion of women in state legislatures, 1975–2019.
If the prominence thesis is correct, then states with more prominent women officeholders should have a higher proportion of women in their state legislatures. This should hold for both the pioneering women and pioneering states version of the theory. This is not uniformly what we observe, however. While nationally the number of women in state legislatures has been increasing, Wyoming, for instance, displays the opposite trend. Though an early leader both in granting women the right to vote and electing women to public office,Footnote 5 the proportion of women serving in the Wyoming legislature had decreased for several years before a slight uptick in 2019; the state now ranks 48th in this measure. Nevada and Colorado, by contrast, rank first and second respectively in percentage of women in the state legislature, yet neither state has a particularly long history (or any history at all, in Colorado’s case) of electing women to statewide office.
The cases of Colorado and Nevada suggest alternative explanations may better explain the issue. For example, it is possible that women are only more likely to run for and win election to the state legislature if a prominent woman officeholder hails from the same party.Footnote 6 To test for party-congruent effects, we evaluate whether prominent Democratic officeholders increase the share of Democratic women in state legislatures and whether prominent Republican officeholders increase the share of Republican women in state legislatures. Thus, our dependent variable in the partisan models is the proportion of each legislative party that are women for each state, from 1983 to 2019.Footnote 7
Perhaps by only measuring variance in the number of state legislative officeholders—which is to say, candidates who won elections to those seats in the first place—we are at risk of underestimating a prominence effect. It is possible that pioneering women and pioneering states inspire more women to run for office, but that many of those candidates ultimately end up losing their elections and would thus be omitted from an analysis with a dependent variable that only measured state legislative officeholders.Footnote 8 To account for this possibility, we utilize CAWP (2019) data, which count the number of women candidates who ran in state legislative elections from 2000 to 2018.Footnote 9 This additional dependent variable allows us to estimate models that act as a robustness check for our legislative officeholder models. The data include the partisan affiliation of the candidates, allowing us to also check for same-party candidate effects.
Independent Variables
Our analyses measure the prominence of women officeholders in six ways. First, we include a variable for the number of years since the first woman senator or governor in the state’s history was elected. This specification tests the pioneering states hypothesis. We did not include women senators or governors who attained office by means other than an election in this measure.Footnote 10 Several women were appointed to be US senators in the 1930s, 1940s, and 1950s; they were often appointed by governors to finish their husbands’ terms or to hold his seat until a special election could be held if their husband could no longer serve for some reason.Footnote 11 Similarly, many female lieutenant governors took over for male governors who retired, resigned, or died while in office.Footnote 12 In cases of appointment or succession, the facts that the female officeholders were not elected to those positions in their own right and that they often only served for a short amount of time are potentially confounding factors that would limit both the women officeholders’ visibility and their power to dispel notions of masculinized ethos and gendered psyche by winning those elections themselves. The pioneering states version of the prominence thesis holds that as the number of years since the first woman senator or governor was elected increases, then the current observed percentage of women in the state’s legislature will increase, because the idea of women holding political office in the state should be more normalized and ingrained the earlier a woman was elected.
The other ways of measuring prominent women officeholders that we test speak to the pioneering women version of the prominence thesis. The second variable we include in our models, therefore, is the total number of women senators and governors elected in the state’s history. The more women senators and governors who serve, the more opportunities there are to inspire other women to join their ranks, which should in turn lead to a higher percentage of women comprising state legislatures. Following this line of thinking, our third measure of prominence accounts for the total number of years in which women have held office in the US Senate or their state’s governor’s mansion. If states routinely elect and reelect the same women to prominent offices, that should signal to women that it is possible to survive and thrive at the highest levels of their state’s politics. For example, as of 2019 California had elected three women US senators in its history: Barbara Boxer, Dianne Feinstein, and Kamala Harris. Senator Boxer served in the Senate from 1993 to her retirement in 2017 (Senator Harris won the election to replace Boxer), while Senator Feinstein has served since 1992. Simply noting that California has elected three women senators ignores the fact that the state has been represented exclusively by women in the US Senate for 24 years. This measure of prominence captures that longevity.
Our fourth and fifth explanatory variables expand our definition of what it means to be a “prominent” officeholder. In these two measures, we include all statewide elected positions and members of the US House as prominent officeholders (combined with the total number of senators and governors), respectively. US representatives are certainly prominent politicians, but we do want to make note of two caveats that explain why we treat this measure differently than the senators-and-governors-only measure. First, the US Senate and state governorships are two of the highest elected offices in the country other than the presidency and vice presidency, which as of 2019 had never been held by a woman.Footnote 13 And second, a focus on the House of Representatives could yield potentially uneven regional effects within states. A House member would be a more prominent political figure to those in her district than she would be to those in her state’s other districts, while a US senator or governor should theoretically be equally visible throughout her state.Footnote 14 Due to this variability, we have separated analyses that include House members into their own models.
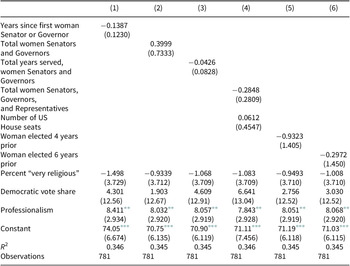
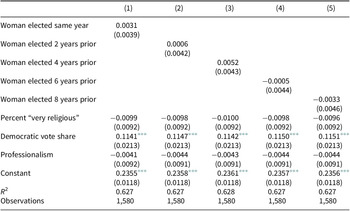
The sixth and final way that we measure prominence is by measuring the lagged effects of electing a woman senator or governor. We conducted analyses to explore how long it takes for a prominent woman politician’s election to have an effect on the composition of state legislatures. We created binary variables that indicate whether a woman was last elected to the Senate or the governorship that year, two years prior, four years prior, six years prior, or eight years prior. If a concurrent election has the greatest effect, that means there is a cohort effect, and prominent women officeholders tend to come in to office along with state legislators. If there is a lag, which is what we expect to find, the visibility of a woman’s campaign as well as her time spent governing may exert greater influence over the ambitions of women considering running for the state legislature. Because US senators are elected every six years and most governors are elected every four years, we include four-year and six-year lags in our main regression tables.Footnote 15
For either version of the prominence thesis to be persuasive, the effect of prominent women officeholders should be apparent independent of other factors that could possibly explain the participation of women in state politics, such as the state’s culture and general attitudes toward women. To account for cultural explanations in various ways, we introduce several control variables at points throughout our statistical analyses. Three of these variables are binary indicators of a state’s regional location—West, South, and Northeast (with Midwest serving as the reference category). The Western region is particularly interesting, because these states’ beginnings as western territories led many of them to grant women the right to vote and run for office quite early. If the pioneering states hypothesis were true and the number of years a state has had women serving in government affects its cultural acceptance of women, then we would expect western states to have a higher proportion of women in their state legislatures.
We include two other control variables in our analyses that attempt to capture states’ cultures and attitudes toward women. For our single year, 2019 models, we include a binary indicator of whether or not the state ratified the Equal Rights Amendment (ERA) during the 1970s.Footnote 16 We expect states that ratified the amendment during the 1970s to be more progressive in their attitudes toward women and, by extension, to be more accepting of women in politics generally. Additionally, for all of our models, we utilized American National Election Studies data on the percentage of respondents identifying as “very religious.” We expect states that are more religious to have less progressive attitudes toward women and be less likely to elect women to office.
Finally, we include two control variables to account for additional political and institutional characteristics of the states. The first control measures the state’s partisanship: the average Democratic presidential vote share in the previous two presidential elections. Women are more likely than men to identify with the Democratic Party (Box-Steffensmeier, De Boef, and Lin Reference Box-Steffensmeier, De Boef and Lin2004; Wirls Reference Wirls1986). However, as Junn (Reference Junn2017) notes, this gender gap is largely driven by women of color who are far less likely than white women to identify with the Republican Party. Cassese and Barnes (Reference Cassese and Barnes2019) also show that a simple focus on the “partisan gender gap” masks underlying race and class differences among voters, Phillips (Reference Phillips2018) argues that white women’s desire for descriptive representation does not necessarily translate to their voting behavior, and Junn and Masuoka (Reference Junn and Matsuoka2019) demonstrate that white women are the only group of women voters who consistently support Republican presidential candidates. It is a broader limitation of our data that we cannot directly examine the role of race and intersectionality in the election of women to office. Regardless, this measure should account for the more liberal attitudes toward women in the Democratic Party. Partisanship is therefore an important indicator for the electoral climate toward women in a state.Footnote 17 The second political–institutional control measures the extent to which the state’s legislature is professionalized. Scholars have noted that more professionalized state legislatures tend to be negatively associated with women’s descriptive representation (Diamond Reference Diamond1977; Hogan Reference Hogan2001; Squire Reference Squire1992). To account for this effect, we include Squire Index scores (Squire Reference Squire2012; Reference Squire2017) for each state. Using the US Congress as a baseline, the Squire Index measures on a scale from 0 to 1 the extent to which each state’s legislature compares to Congress on measures of professionalism including staff size, salary, and session length. States with scores closer to 1 are considered to be more professionalized.
Our test proceeds in four parts. First, we utilize ordinary least squares regression models to test whether any of our specifications of prominent officeholders can explain the composition of state legislatures in 2019. Second, we expand our models over time controlling for state and year fixed effects. Third, we test whether women holding prominent office can explain the percentage of same-party women comprising their party in the state’s legislature over time. And finally, we conduct robustness checks for our models with state legislative candidates as the dependent variable.
Results and Discussion
The Contemporary Composition of State Legislatures
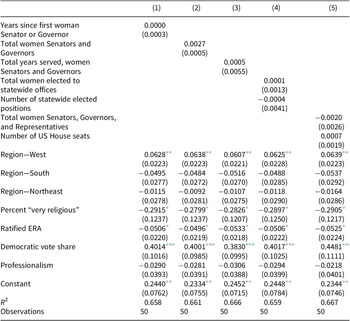
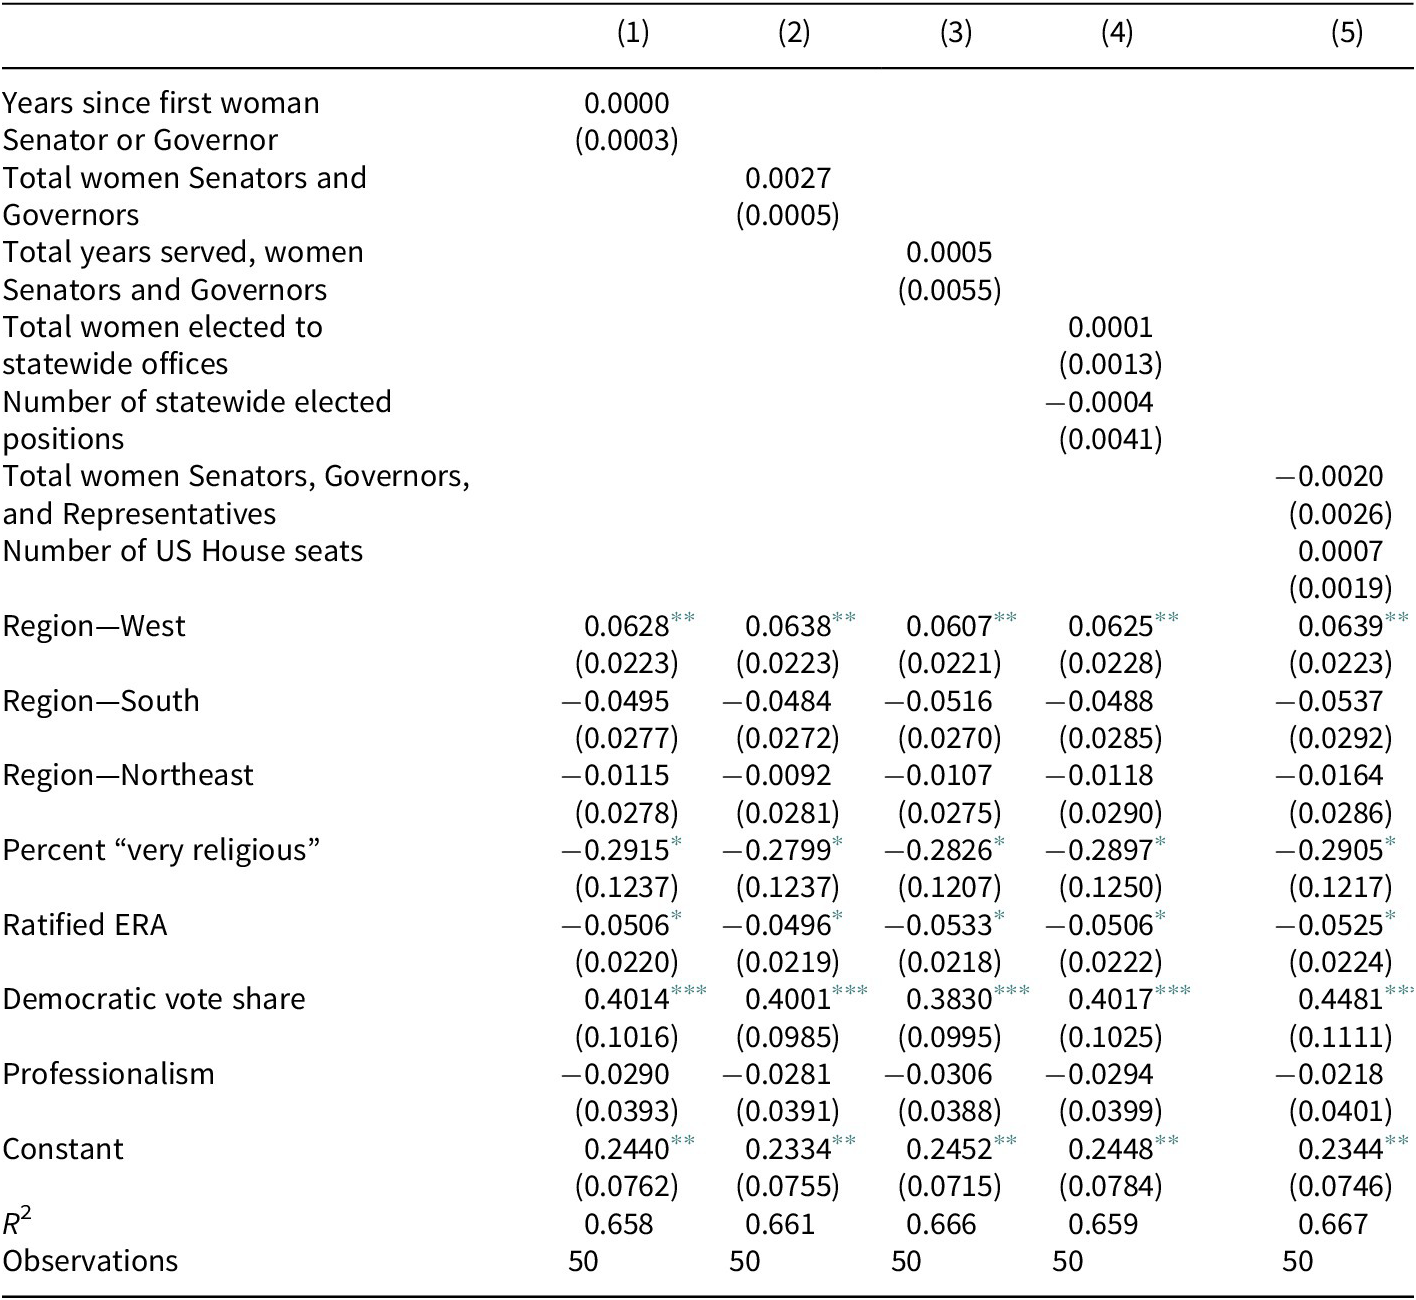
Table 2 displays the results of ordinary least squares regressions explaining the effect of office-holder prominence on the percentage of women in state legislatures in 2019. None of our models here provide evidence to suggest that prominent women officeholders—defined in five different ways—have any effect on the percentage of women that comprise each state’s legislature. The variable indicating the number of years since the state’s first elected female senator or governor did not have any predictive power, contrary to the idea that a state’s culture would be more accepting of women if it elected a woman earlier in its history. This first set of results suggests that a state electing women to prominent statewide office early on its history does not necessarily establish a permanent culture of electing women to political office more broadly.
Effect of officeholder prominence on proportion of women in state legislatures, 2019
Note. Standard errors in parentheses.
Abbreviation: ERA, Equal Rights Amendment.
∗ p < 0.05;
∗∗ p < 0.01;
∗∗∗ p < 0.001.
Neither the total number of women senators and governors nor the cumulative tenure of every woman senator and governor who has served in the state had a significant effect on the percentage of women comprising state legislatures. Expanding the definition of a prominent officeholder to include all offices that are elected statewide or to include House members did not produce a statistically significant effect. Thus, electing more prominent officeholders also does not appear to account for an increase in women comprising state legislatures in 2019, which casts doubt on the pioneering women hypothesis. Instead, the current gender composition of state legislatures seems to be better explained by regional, cultural, and partisan factors.
As expected, states which are more heavily Democratic-leaning at the presidential level are significantly more likely to elect more women to the state legislature. States that are more religious tended to have fewer women in their legislatures, which we also expected. Less expected was the effect of having ratified the ERA. There was a strong and statistically significant negative correlation between having ratified the ERA and the percentage of women in state legislatures in 2019. Future scholars should explore whether there has been a change in attitudes toward gender equality in some ERA states or whether these states simultaneously hold positive attitudes toward issues of importance to women and negative attitudes toward electing women to office.
Prominence over Time: Pooled Results
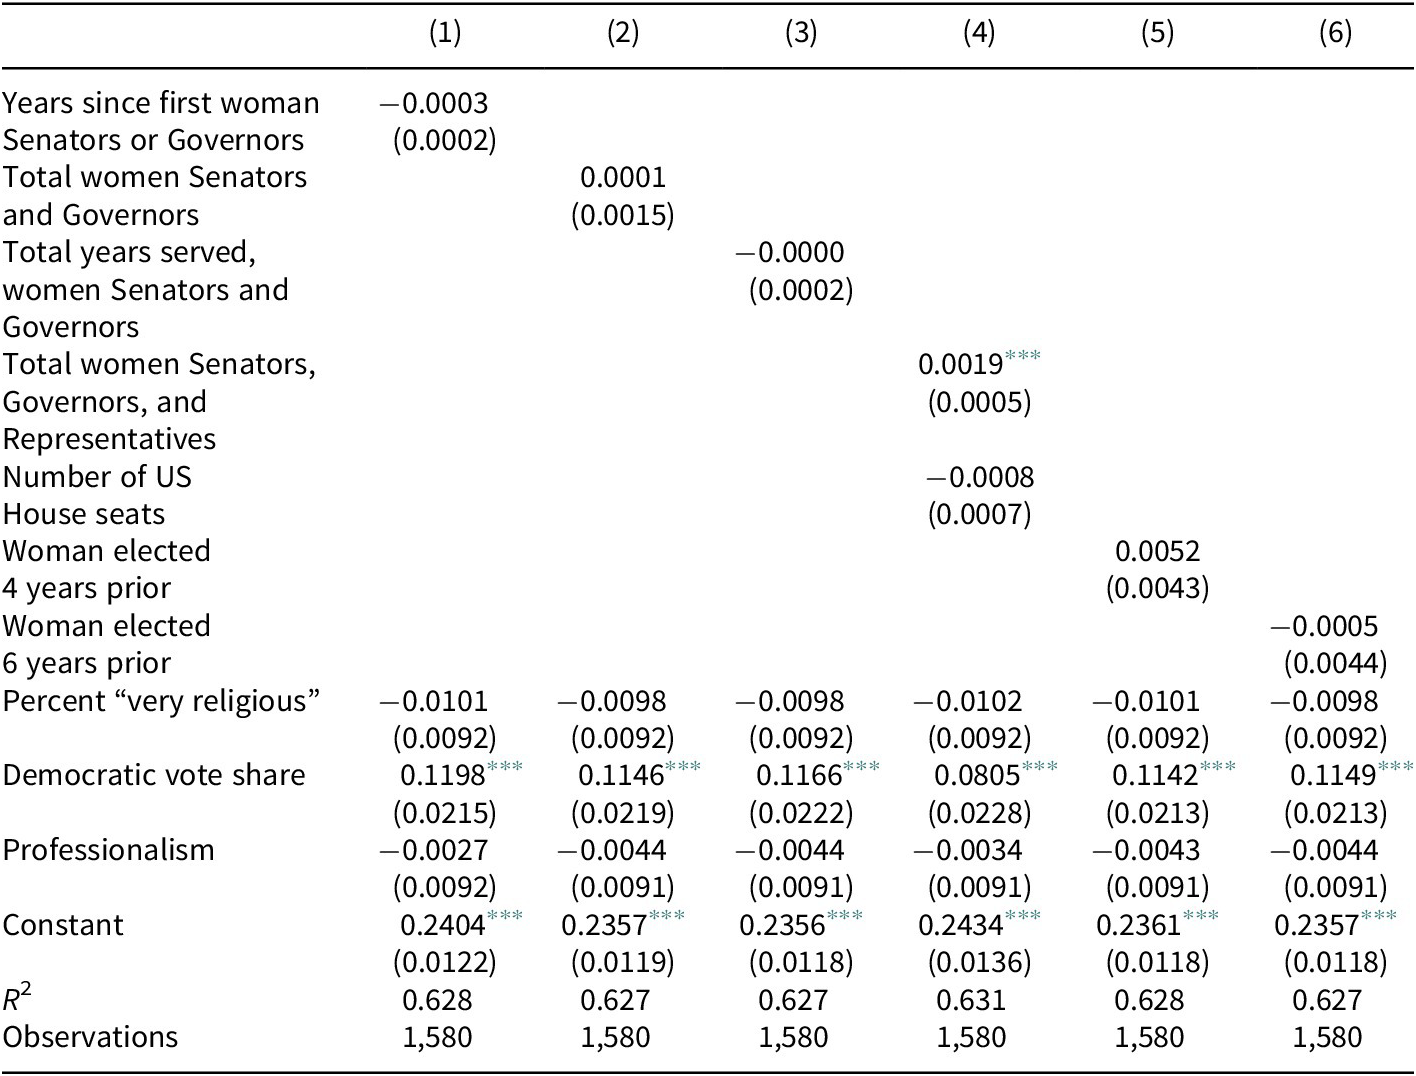
Before testing for partisan differences in the prominence effect, we present pooled results which can tell us whether a prominence effect transcends party. Table 3 displays the results of state and year fixed effects regressions using the same predictors from Table 2, but expanding the analysis to include observations dating back to 1975.Footnote 18 As in the 2019 model, states electing women to prominent offices earlier in their histories did not have a positive effect on the percentage of women in state legislatures. Again, these results do not support the claim that states that were pioneering in electing women to the Senate or to governorships exhibit an ongoing culture of electing women to office.
Effect of officeholder prominence on proportion of women in state legislatures with state and year fixed effects, 1975–2019
Note. Standard errors in parentheses.
∗ p < 0.05;
∗∗ p < 0.01;
∗∗∗ p < 0.001.
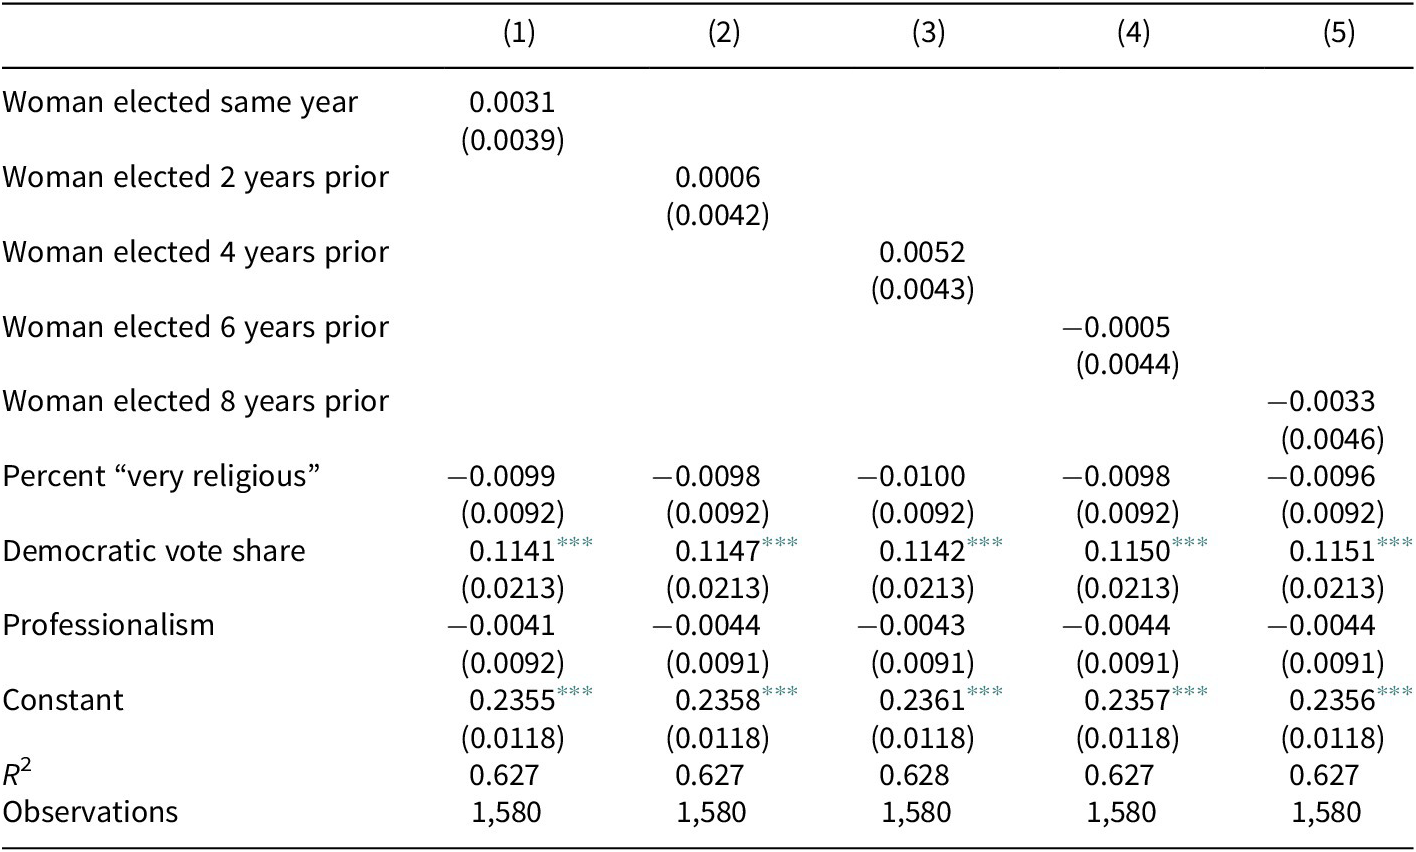
The total number of senators and governors in the state’s history also did not have any explanatory power, and neither did including the cumulative tenure of women senators and governors in each state. We also tested whether there were any lagged effects of electing a woman to a prominent office; perhaps there is something about running for reelection as a prominent officeholder that encourages more women to run for the state legislature, for example. But we did not find any evidence suggesting a spike in women candidates in the cycles following a woman being elected statewide. Table A1 in the Appendix displays the results of testing different lengths of lagged prominence effects; we do not find evidence for a lagged prominence effect for subsequent cycles.
Though the effect is relatively small, including House members in a count of the total prominent officeholders in a state shows a positive and statistically significant correlation with the percentage of women in state legislatures. Every woman elected to the House, Senate, or governor’s mansion is associated with a 0.19 percentage point increase (p < 0.001) in the percentage of women serving in the state legislature according to our model. While not necessarily a ringing confirmation of the pioneering women hypothesis, we can claim with confidence that electing women to statewide and federal office in a state leads to a modest increase in women serving in the state’s legislature.
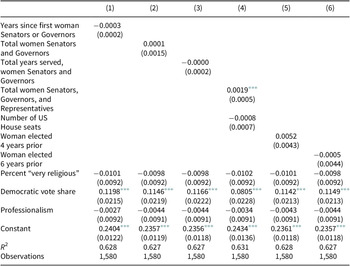
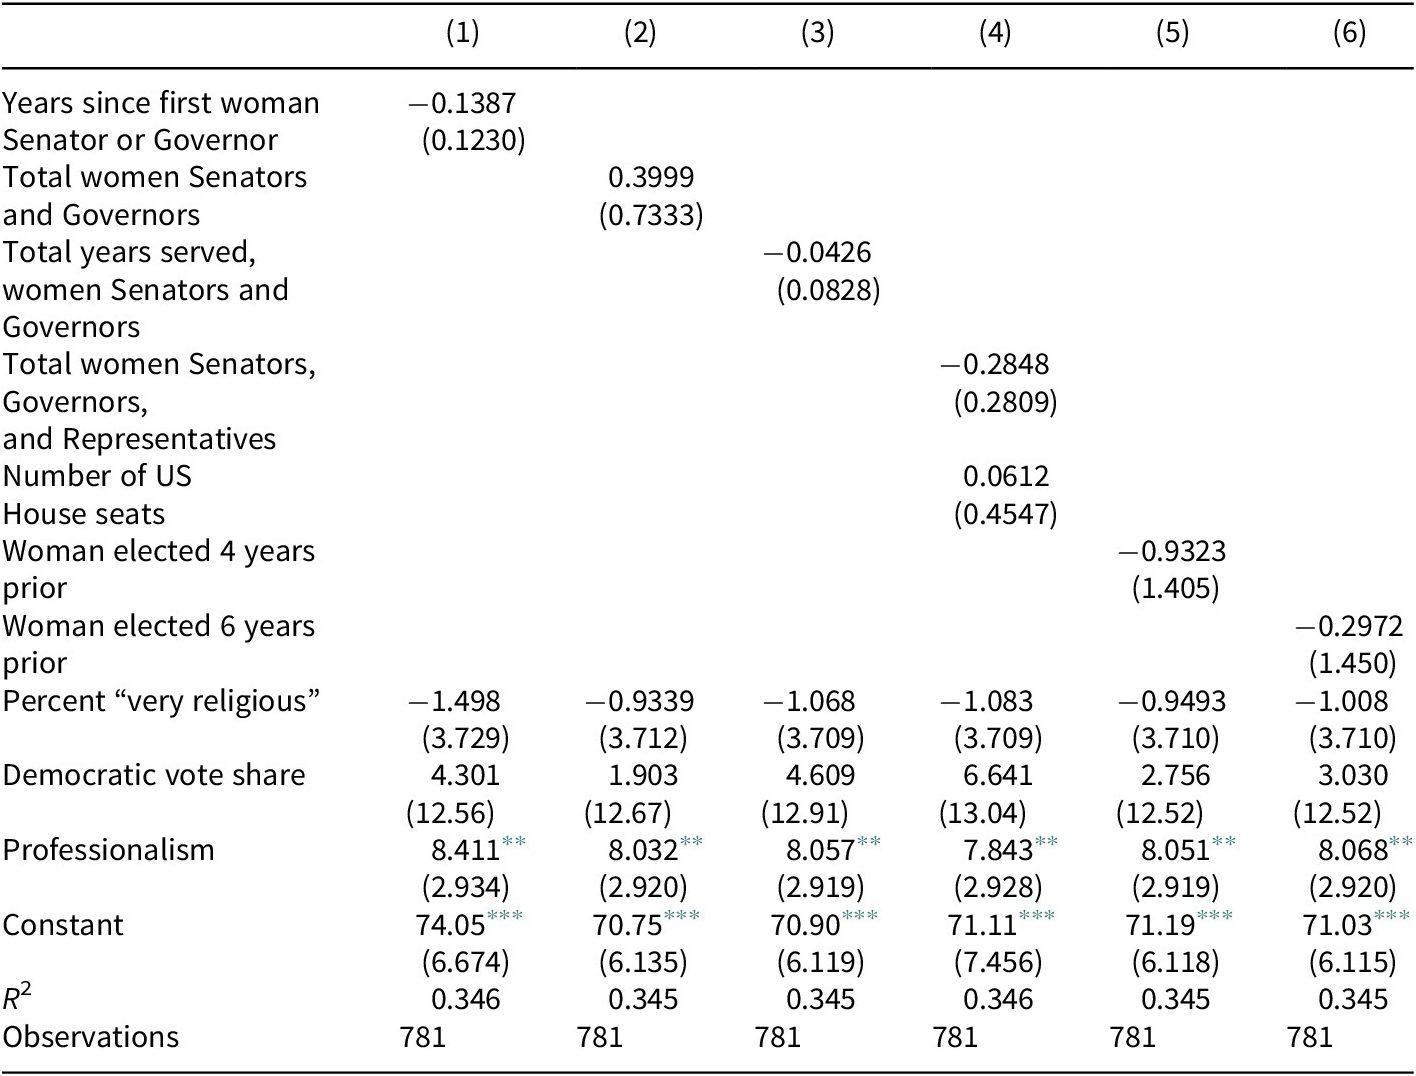
Our robustness check with the number of women state legislative candidates as the dependent variable, however, gives us good reason to be cautious. Table 4 illustrates a fixed-effects model for state legislative candidates from 2000 to 2018. Using this altered formulation, we do not find any evidence for a prominence effect. Instead, this model indicates that women are more likely to run for state legislatures that are more professionalized.
Robustness check: Effect of officeholder prominence on number of women candidates for state legislatures, 2000–2018
Note. Standard errors in parentheses.
∗ p < 0.05;
∗∗ p < 0.01;
∗∗∗ p < 0.001.
Party-Congruent Effects
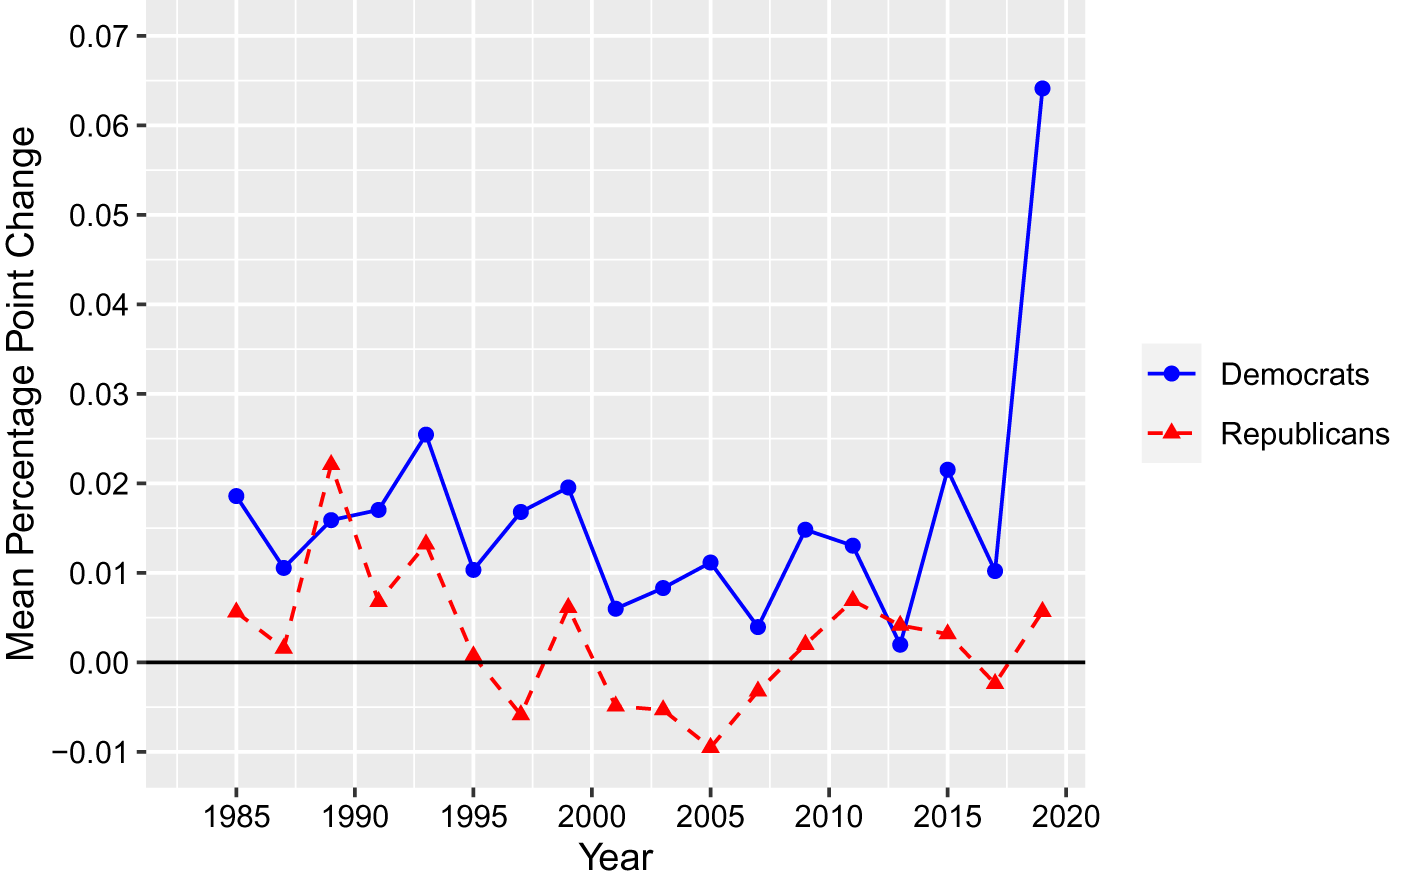
Do the largely null pooled results mask underlying partisan differences? A look at partisan trends over the past few decades suggests that the parties indeed elect women to state legislative office at different rates. Figure 2 shows the average sessional change in the percentage of women comprising their state legislative party caucuses from 1985 to 2019.Footnote 19 In other words, if the average percentage of state legislative Democrats nationwide that are women is 25% in 1993 and 26% in 1995, the mean percentage point change for 1995 is 1%. Any values above zero would indicate that women are comprising a greater share of the party than they did two years earlier.
Percentage point change in women comprising state party caucuses, 1985–2019.
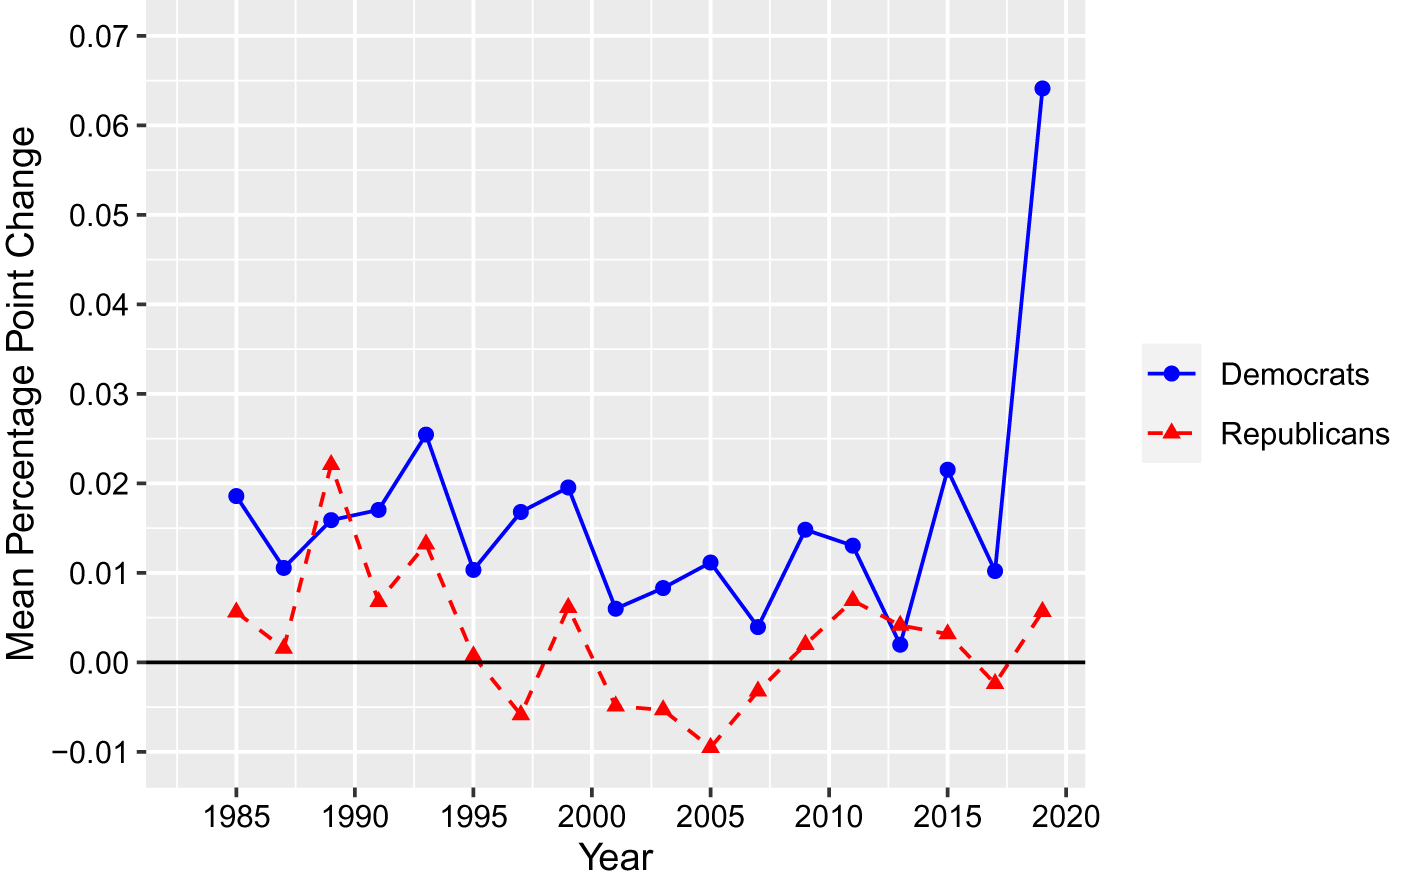
Democrats are consistently higher than Republicans on this measure, indicating that more Democratic women are being elected than Republicans, and at faster rates. The largest mean percentage point change from the previous legislative session, by far, came in 2019. Democratic women comprised an average of 6.4 percentage points more of their state legislative party nationwide in 2019 than they did at the start of the 2017 session. There was no similar surge on the Republican side.
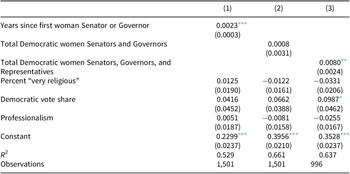
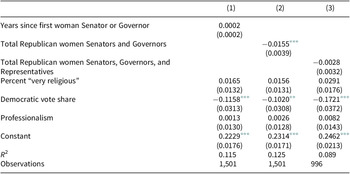
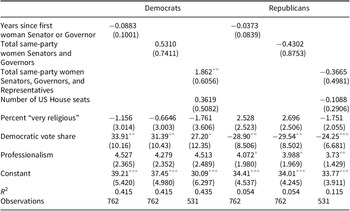
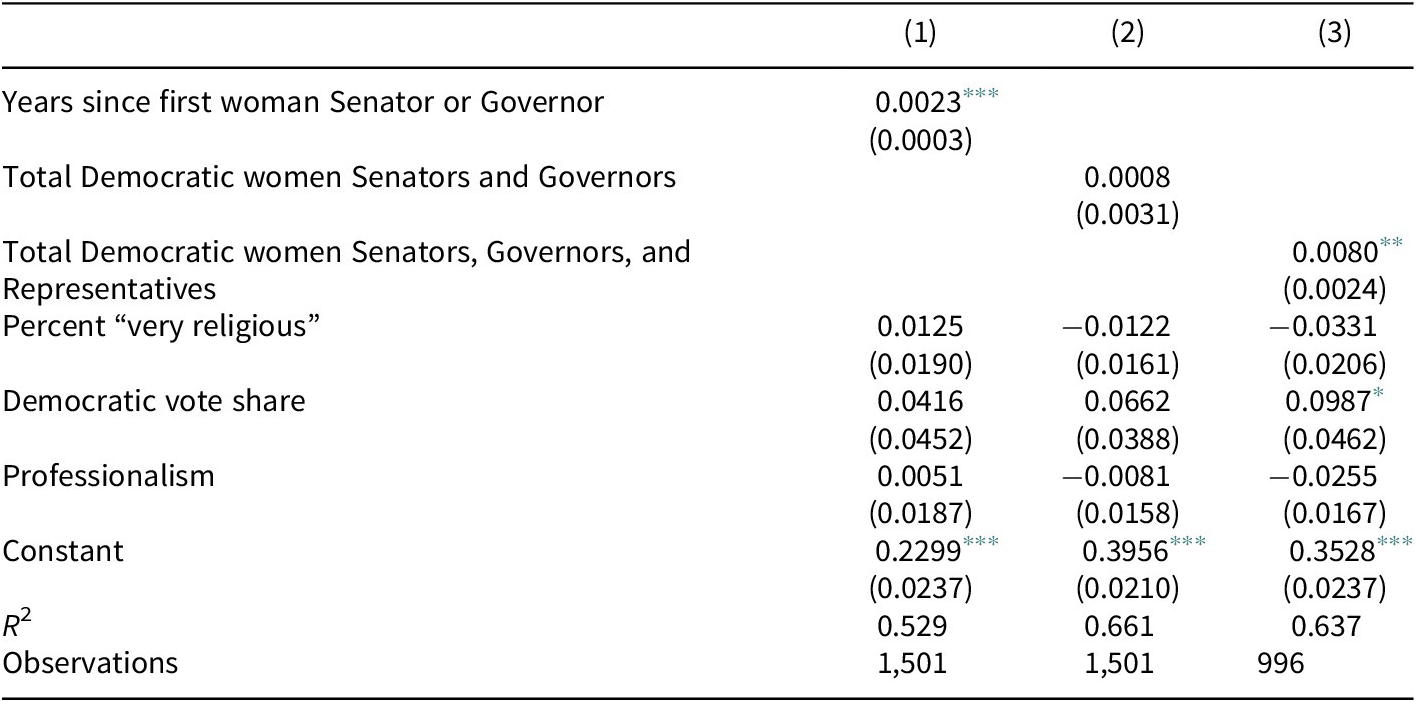
Is the apparent deficit between the parties due to a party-congruent prominence effect? We duplicated three of our models to test whether statewide women officeholders increase the share of same-party women in state legislatures from 1983 to 2019. Our test of the effect of prominent Democratic women is included in Table 5, and our test of the effect of prominent Republican women is included in Table 6.
Effect of prominent Democratic women officeholders on proportion of Democratic women in state legislatures, 1983–2019
Note. Standard errors in parentheses.
∗ p < 0.05;
∗∗ p < 0.01;
∗∗∗ p < 0.001.
Effect of prominent Republican women officeholders on proportion of Republican women in state legislatures, 1983–2019

Note. Standard errors in parentheses.
∗ p < 0.05;
∗∗ p < 0.01;
∗∗∗ p < 0.001.
We find evidence for the pioneering states hypothesis for Democrats. States that elected a woman to office longer ago were associated with a higher share of Democratic women in their state legislatures, suggesting that if electing women to office is a habit, learned by voters or candidates, it is one with a more powerful effect on Democrats. We also find evidence for the pioneering women hypothesis among Democrats when US representatives are included as prominent officeholders. This suggests that the Democrats are likely driving the corresponding result in the party-neutral model.
The null results for Republicans suggest that any role model effect that exists may be limited to Democrats. We do not find evidence for the pioneering states hypothesis among Republicans. And when prominent officeholders are defined as women senators and governors with representatives excluded, the results are reversed: a Republican woman being elected statewide is associated with a 1.55 percentage point decrease (p < 0.001) in the share of Republican women in the state’s legislature. The magnitude of this effect is also much larger than the positive effects we see among Democrats. In other words, rather than a positive role model effect for Republicans when a prominent Republican woman is elected, there seems to be a backlash against electing more women to the state legislature. This backlash is not easily explained, but our candidate-centered model provides some potential insight into what is driving this negative effect.
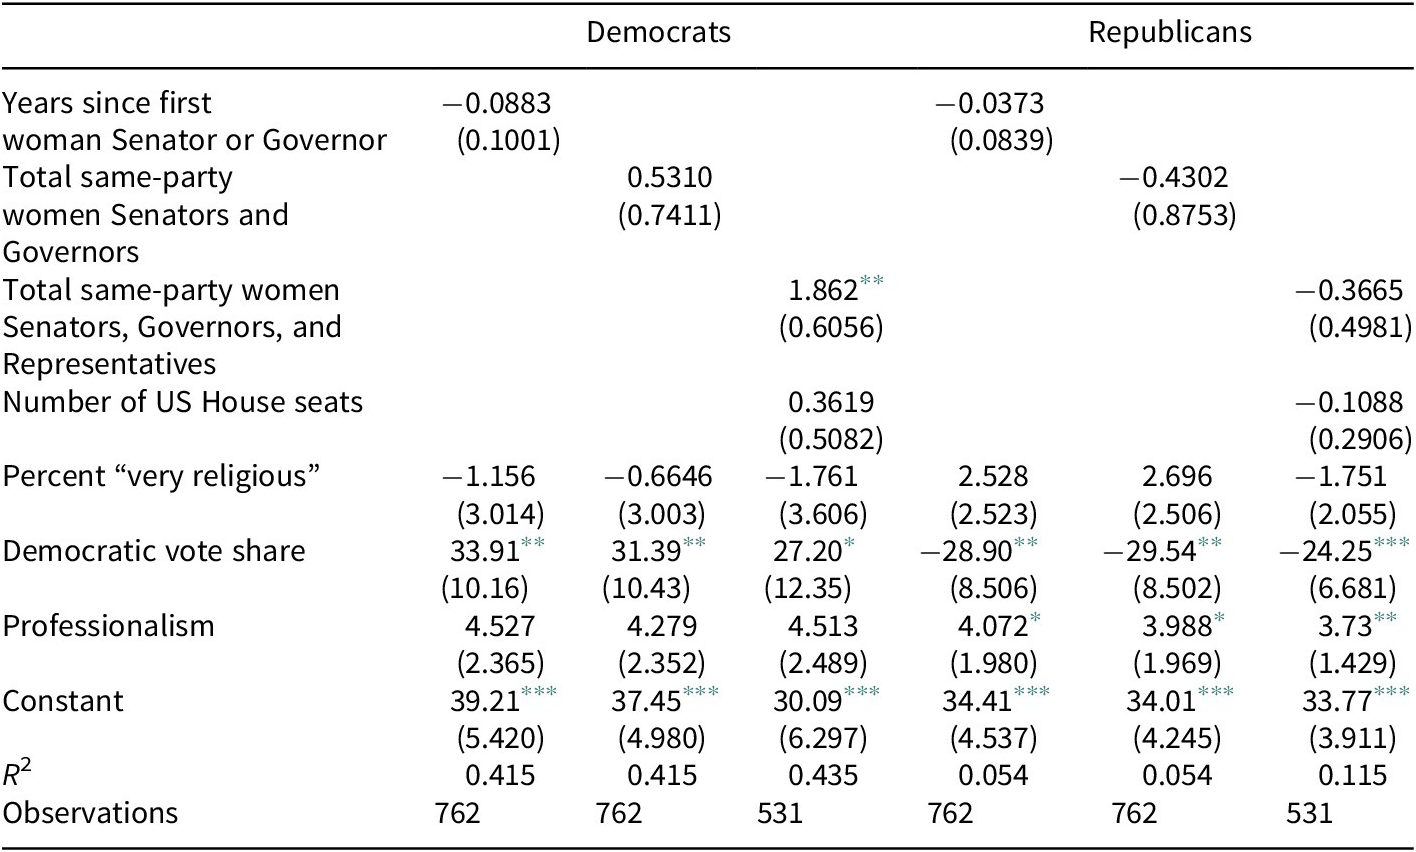
As we did for the party-neutral models, we conducted a robustness check for the party-congruent models to examine whether there are also partisan differences in the number of candidates running. The results are presented in Table 7. We do not replicate the pioneering states hypothesis finding among Democratic women, but we do replicate the positive pioneering women hypothesis finding. Electing more Democratic women to federal and gubernatorial office, it seems, begets more Democratic women to both run for, and win, elected office at the state level.
Robustness check: Effect of officeholder prominence on the number of same-party women candidates for state legislatures, 2000–2018
Note. Standard errors in parentheses.
∗ p < 0.05;
∗∗ p < 0.01;
∗∗∗ p < 0.001.
For Republicans, we do not find a significant negative prominence effect as we did in the legislative officeholder model (though the sign is still negative). Thus, the statistically significant negative result in Table 6 is likely not being driven by a decrease in the candidate supply. Though our present data do not let us directly investigate the role of voters, our data on candidates and elections suggest that that the backlash to electing Republican women to the state legislature is not driven by candidates’ unwillingness to enter the fray.
Conclusions and Alternative Explanations
Though some scholars have found strong evidence that women political role models can have a positive effect on women’s representation, and others have found no (or limited) effects, the evidence we present in this article suggests that if a role model effect exists, it is limited to Democrats. In the case of Republicans, our findings suggest a negative effect for electing Republican women to prominent office. Even among Democrats, the effect size we find is unlikely to account for large surges, as we saw in the 2018 elections. Hillary Clinton’s presidential candidacy could have inspired women to run for office on a national level, but if this were the case it would more likely have manifested in 2017 (following the 2016 election cycle), as Clinton had been the frontrunner for the Democratic nomination since at least 2012 and had officially announced her candidacy in 2015. We turn to alternative explanations for additional clues.
The first alternative explanation worth exploring is one articulated by Sidorsky (Reference Sidorsky2019) in her survey research on women serving on appointed boards. Perhaps women’s failure to pursue elected office does not reflect a failure to pursue public service. Rather, women are finding other ways to serve, and an analysis that includes other public service roles like appointed boards might find a role model effect. If this is true, it poses serious questions for descriptive representation. If women represent other women in fundamentally different ways, it matters that they are absent from so many high positions in government. Although women may be finding great personal fulfillment in alternative forms of service, a constituency in need of representation remains.
Another alternative explanation is that it is not so much positive role models that inspire women to run but a desire to change things in reaction to a negative event. Perhaps the surge in women officeholders is a result of a reaction to national political events widely characterized as negative for women’s shared interests (a particularly notable example being the recording of then-candidate Trump boasting about sexually assaulting women). Perhaps the anger, fear, and frustration stemming from Trump’s election and actions in his first term were more powerful motivators for potential office seekers than inspiration from women political role models.
“The Year of the Woman” in 1992 comes to mind as another illustrative example. Figure 2 shows that the 1992 elections resulted in the second highest surge in Democratic women officeholders, lending credence to this theory. “The Year of the Woman” in 1992 came after Clarence Thomas’s confirmation hearings and the absence of woman senators on hand to participate in the investigation into Anita Hill’s allegations of sexual misconduct. The increase in women serving in Congress that came about because of that negative event did not lead to a sustained increase, suggesting that it was the one-time events of 1992 that drove the increase rather than the number of women already in Congress. The “prominent negative” thesis is difficult to quantify, but, as with the positive prominent officeholder effect, seems to mostly be driven by Democratic women. Future research should explore differences in partisan dynamics to help explain why Republican women continue to lag behind Democratic women in representation, and what can be done to elect higher shares of Republican women.
Specifically, future researchers should further examine our finding that electing more Republican women to prominent office leads to fewer Republican women serving in state legislatures. It is possible that the gendered psyche theory is more prevalent among Republican women (though, as we show in Table 7, the number of candidates does not necessarily decrease in reaction to prominent women officeholders), or perhaps Republican voters react negatively to Republican women holding statewide office and vote accordingly. Of course, we are not advocating that fewer Republican women be elected to statewide office so that Republican women’s representation in state legislatures increases. But our evidence does suggest that electing more women to prominent office may be having the unintended consequence of contributing to a greater representational gap between the parties at the state legislative level. Particularly in light of the intense polarization of contemporary US politics, these unique partisan dynamics bear further attention.
Acknowledgments
For invaluable feedback and ideas at various stages of this project, we would like to thank Katherine Tate, Wendy Schiller, Kristin Kanthak, Hannah Schenk, participants and audience members at the 2018 SPSA Women in State Legislatures conference panel, anonymous reviewers, the editors of SPPQ, and members of the Graduate American Political Workshop at Brown University.
Data Availability Statement
Replication materials are available on UNC Dataverse at https://doi.org/10.15139/S3/HUN6XO.
Funding Statement
The authors received no financial support for the research, authorship, and/or publication of this article.
Conflict of Interest
The authors declared no potential conflicts of interest with respect to the research, authorship, and/or publication of this article.
Author Biographies
Cory Manento is a Visiting Assistant Professor of Political Science at Trinity College. His research examines the intersection of parties, primary elections, and representation in legislatures. Marie Schenk is a PhD candidate in political science at Brown University. Her research interests include descriptive representation, civic engagement, and political discussion in online spaces
Appendix
Various lag variables and proportion of women in state legislatures, 1975–2019.
Note. Standard errors in parentheses.