


1. Introduction
Glaciers are not only active in energy and mass exchange with the atmosphere, but are also important water resources that contribute meltwater to river discharge. Glaciers participate in the global water cycle and, with their solid water storage, are an important component of the water balance. As solid reservoirs, glaciers continue to receive the mass nourishment of solid precipitation from the atmosphere, and their meltwater feeds and regulates river discharge. Their solid water storage can become usable water resources only when it is melted and generates meltwater runoff Reference Kang, Yang, Lai, Ye, Xie and Liu(Kang and others, 2008). According to the published 12 volumes of the Glacier Inventory of China (GIC) consisting of 22 parts in 21 books, there are 46 377 glaciers covering an area of 59 425 km2, with ice storage of 5600 km3, in western China (Reference Shi, Liu, Ye, Liu and WangShi and others, 2008). Total glacier meltwater runoff in China is estimated at 60.465 x10⁹m3 a–1 (Reference YangYang, 1991). Thus, in the integrated assessment of water resources in China, the assessment of glacier water resources is very important.
To support the rational allocation and management of water resources, an assessment of China’s glacier water resources must be made for the water-resource subareas. First, the glaciers and their water-resource status must be summed up in different orders in west China, the assessment including the distribution, types, characteristics and water-balance status of the glaciers, and their role in the mountain runoff of glacial meltwater. Secondly, a trend analysis of glacier change must be carried out to show historical variations, and the future trend of glaciers and their meltwater runoff predicted under various climate-change scenarios, especially for the inland river basins where the glacial meltwater constitutes a large proportion of the mountain runoff. Thirdly, scientific understanding of interactions among glaciers, climate change and water resources must be improved.
The basis for assessing glacier water resources is the completion of the GIC (Reference Shi, Liu, Ye, Liu and WangShi and others, 2008). Statistical analyses are performed on the glacier inventory data to show the characteristics of glacier distribution. In addition, the results of the long-term glacier monitoring at Tien Shan Glaciological Station are analyzed, and data from field expeditions and investigations on representative glaciers are used. Then the China Glacier Information System Reference Wu and Li(Wu and Li, 2004) is applied and some simulation methods are used. Based on the above, we have made a preliminary assessment of China’s glacier water resources.
This paper presents the main results of the assessment based on the GIC, and discusses the distribution of glaciers in the water-resource subareas, glacier change, normal glacier runoff and changes in glacier runoff.
2. Distribution of Glaciers in the Water-Resource Subareas
According to the manual of the World Glacier Inventory, China’s mountain glaciers are distributed in the drainage basins which are classified into five orders and ten first-order drainage basins (Reference Shi, Liu, Ye, Liu and WangShi and others, 2008). According to the Chinese Hydraulic Engineering Society (2002), glaciers in west China are distributed in four first-order water-resource subareas: the Northwestern Rivers region, the Southwestern Rivers region, the Yellow River region and the Yangtze River region (Fig. 1). The statistics of glacier distribution in the water-resource subareas are based on the GIC data. The results are shown in Figure 2.
First-order water-resource subareas of China (from CHES, 2002; Shi and others, 2008, p. 43).

Distribution of glaciers in the first-order water-resource subareas of China (from Reference Shi, Liu, Ye, Liu and WangShi and others, 2008, p. 44).
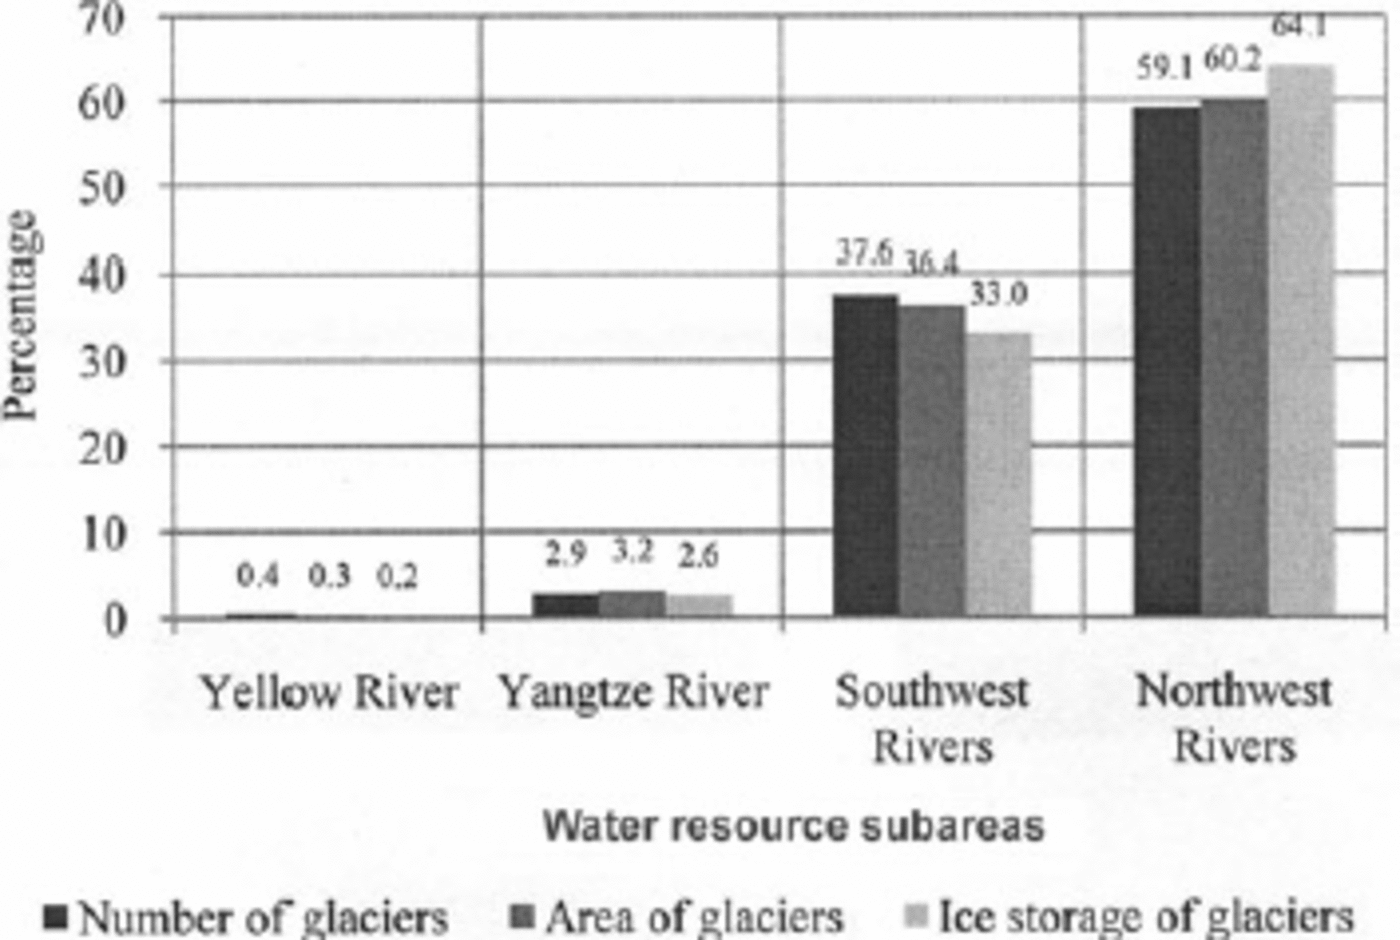
Figure 2 shows that the glaciers are mainly located in the Northwestern Rivers region, which is an arid area consisting of various inland river basins (Reference Liu, Kang, Liu, Chen and LiuLiu and others, 1999), with most of the others located in the Southwestern Rivers region, which is a humid area with rivers draining to the ocean. The glaciers in the arid inland area are of continental type, while those in the humid outflow area are of maritime temperate type (Reference Shi, Liu, Ye, Liu and WangShi and others, 2008, p. 31–37). According to ice storage from the GIC, the total glacier water storage is 5040.2 x109m3, 64.1% of which is stored in the northwest inland drainage basins and 33.0% in the southwest drainage basins. Figure 2 also shows that the average scale of glaciers is slightly larger in the arid inland area than in the humid outflow area.
The number of glaciers in the arid northwest is 27 024, covering an area of 35 468.56km2, with an ice storage of 3574.75 km3. The area is divided into ten second-order water-resource subareas. Table 1 shows the distribution of glaciers in the subareas. 50% of the glacierized part of the area is distributed in the mountains surrounding the Tarim basin, which covers 45% of the arid area, and 22.1% is distributed in the northwest Qinghai–Tibetan Plateau (Qiangtang plateau), which covers 31% of the arid area (Reference Shi, Liu, Ye, Liu and WangShi and others, 2008). The other subareas, covering 24% of the arid area, contribute 27.9% of the glacierized area.
Glacier distribution in the second-order water-resource subareas in the northwest arid inland area of China (data from GIC)

3. Glacier Change
3.1. Methodology
Completion of the GIC took more than 20 years, and the time-span of the photogrammetric topographic maps used for the inventory is large, from 1956 to 1984. To investigate glacier change, the Little Ice Age (LIA) moraine distribution was investigated with air photos, and comparative studies were carried out by field measurement on representative glaciers and topographic maps from different times. Repeated measurements of glacier variations were also implemented by remote sensing, stereophotogrammetric survey and aerial survey. The glacierized area of the LIA maximum can be estimated from the moraine sediment in the representative regions (Reference Liu, Xie, Liu, Kang, Cheng and DongS. Liu and others, 2002). For the present glacier change, there are various short-term field investigations and measurements in representative glacierized areas, and perennial glaciological measurements have been carried out at the source area of the Ürümqi river since the end of the 1950s (Reference Liu, Shen, Sun and LiS. Liu and others, 2002).
According to statistical analysis of the existing glaciological measurements both at the LIA moraine and at existing glaciers, the percentage change in glacierized area is strongly correlated with the scale of the glaciers, and is also dependent on the scale class of the glacier area (Reference Liu, Kang, Liu, Chen and LiuLiu and others, 1999). The relationships are as follows (Reference Liu, Xie, Liu, Kang, Cheng and DongS. Liu and others, 2002, p. 18–20):

where S L is the area of a glacier during the LIA maximum (km2), S is the area of an existing glacier (km2) and △S is the area reduction of a glacier between the LIA maximum and 1960 (km2). The glacier area reduction △S/S L has a good correlation with the scale of the glaciers as:

where a and b are regional positive constants and Si is the mid-value of an area-scale series of glaciers in a basin or a region (km2). Table 2 shows the correlation parameters of Equation (2) in the representative glacierized basins.
Correlation of the percentage area loss of glaciers (△S/S L) to their scale (S i) in the representative glacierized river basins from the LIA maximum to 1960 (R is correlation coefficient) (Reference Liu, Shen, Sun and LiS. Liu and others, 2002, p. 19)
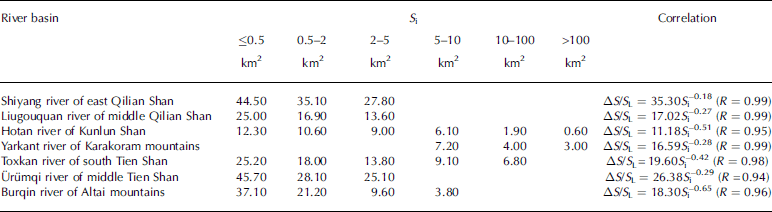
Thus the glacier change is estimated with the statistical relationships based on the GIC data in the inland arid area of northwest China and in the outflow area of southwest China from the LIA maximum to 1960, when the status of existing glaciers can be obtained from the GIC. From the field measurements and investigations of glacier change in the representative glacierized areas from 1960 to 2000, it is found that the relationship of area reduction to the scale of the glaciers can also be simulated by Equations (1) and (2) (Reference Liu, Xie, Liu, Kang, Cheng and DongS. Liu and others, 2002, p. 21–33). Glacier change in China during recent decades is then estimated.
3.2. Glacier change since the LIA maximum and in recent years
At the LIA maximum, the glacier-covered area in west China was 75 438.4 km2, which is 16 013.2 km2 more than the GIC glacierized area, the percentage loss being 21.2% (Reference Shi, Liu, Ye, Liu and WangShi and others, 2008). The continental-type glaciers in the arid northwest contribute 20.7% of the loss, while the glaciers of maritime temperate type in the outflow area contribute 22.0%.
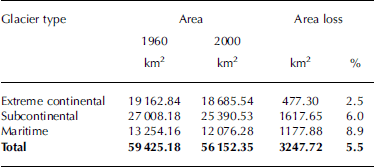
It is estimated that glaciers in west China underwent a 5.5% area loss during the period 1960–2000 (Table 3). China’s glaciers have been divided into three types: maritime temperate, subcontinental and extreme continental (Reference Shi, Liu, Ye, Liu and WangShi and others, 2008, p. 31–33). The largest relative area loss by type is 8.9% for maritime temperate glaciers, next is 6.0% for subcontinental glaciers, and the smallest loss is 2.5% for extreme continental glaciers. The average area loss for continental-type glaciers is 4.5%.
Glacier area change by type in west China from 1960 to 2000
The change in China’s glacierized area since the LIA maximum shows large spatial variation. However, this change is characterized by the regularity that the percentage change is larger in the east and west border regions of China’s glacierized area, closer to the vapour current source direction: the east closer to the east Asia monsoon and the west closer to the westerly vapour current from the Atlantic Ocean. The glacierized area loss is 37% in the Shiyang river basin, east Qilian Shan, and 35% in the Ertix river basin, west Altai mountains (Fig. 3). From the east and west towards the central regions, which are further away from the vapour current source, precipitation decreases along with the percentage glacierized area, which reaches a minimum of about 10% in the west of the Qilian Shan and in the east of the west Kunlun Shan (Fig. 3). Statistical analysis shows that for glaciers with areas less than 0.5 km2 the glacier area during the LIA maximum was twice that of existing glaciers in the GIC, while for glaciers with areas more than 10 km2 it was only 1.03 times as much. Therefore, glaciers that have vanished since the LIA should be predominately small glaciers, while the large glaciers at the LIA maximum have experienced some area reduction but should still exist.
Change of glacierized areas in northwest China from west to east since the LIA maximum and during recent years (from Reference Shi, Liu, Ye, Liu and WangShi and others, 2008, p. 176–180).

During the 40 year period 1960–2000, the area change of glaciers shows the same characteristics as the change since the LIA (Fig. 3). The percentage area loss increases spatially with increasing humidity, i.e. from the central region to the east and west boundary regions, which are closer to the water-vapour source direction (C. Reference Liu, Shen, Sun and LiLiu and others, 2002; Reference Liu, Xie, Liu, Kang, Cheng and DongS. Liu and others, 2002). The highest percentage area loss occurs in the Shiyang river basin, east Qilian Shan, and the next highest losses occur in the Ertix river basin, west Altai mountains, and the Yili river basin, western Tien Shan (Fig. 3). The percentage area loss decreases with the increase in area and scale of an individual glacier. In the Tarim basin, which is surrounded by the Tien Shan, Pamir, Karakoram and Kunlun mountains, glaciers are larger, so the percentage area change is relatively small, less than the average for the total number of glaciers (Table 3).
A comparison between the glacier changes since the LIA maximum and those during recent years shows that the trend of glacier change since the LIA is dominated by glacial reduction, while in terms of the timescale, the percentage area loss greatly increases in recent years, reflecting global warming. The spatial variation of the relative area loss indicates that, along with the increase of continentality, from the east and west regions to the central regions of northwest China, the glaciers have become more stable and their percentage area loss has decreased.
4. Estimation of Glacier Runoff
4.1. Climate parameter temperature-index method
Based on comparative measurements and experiments on glacial runoff at selected representative glaciers, glacial meltwater runoff in China is estimated by the temperature-index method, using the data published in the GIC (Reference YangYang, 1991, p. 72–73). Field measurements at more than ten of the fixed and semi-fixed stations at the representative glaciers in west China have shown that glacier melt is related to a power function of air temperature (Reference Xie, Wang, Feng, Kang, Liu and LiYang, 1981, Reference Yang1982; Reference Yang1991, p. 63–68; Reference Shi, Liu, Ye, Liu and WangShi and others, 2008, p. 160). The following equation is obtained:

where ā is the mean daily water depth of glacial surface melt during the ablation period (mm d–1), φ is a regional climate parameter, φ = 0.382b, where b is the ratio of net radiation to the incoming energy of energy balance (%), and T is the mean daily air temperature during the ablation period (˚C). The mean meltwater depth of glaciers is calculated at the median contour line, which divides the glacier surface into two parts of equal area. φ is obtained by the research on energy balance of glaciers in China, and T is calculated with an air-temperature–altitude gradient, taking the nearby standard meteorological stations as the base. In this way, a preliminary estimate has been made of the annual mean volume of glacial meltwater runoff and its distribution in China (Reference YangYang, 1991; Reference Kang, Yang, Lai, Ye, Xie and LiuKang and others, 2008).
4.2. Glacier system temperature-index method
Another temperature-index method is based on the glacier system concept (Reference Kotlyakov and SmolyarovaKotlyakov and Smolyarova, 1990) and the summer season (June–August) temperature-index method (Reference Kotlyakov and KrenkeKotlyakov and Krenke, 1982) expressed by Equation (4). Considering the glaciers in a region as a system, the glacier of median size in the area series of glaciers is taken to calculate the total melt of the glacier system in a region (Reference Xie and Q.Xie and Feng, 1996). Glacier annual total melt a (mm) can be calculated by the summer mean temperature t s at the melt position on the glacier surface as

where t s is calculated by

where t pa is the temperature at the 600–500 mbar isobaric surface, △h is the height difference between the isobaric surface and the glacier equilibrium line, γ is the temperature vertical lapse rate (0.6–0.75 K (100 m)–1) and △t j is the temperature jump value from the ground surface to the glacier surface, taken as –0.5, 1.0 and 1.5 K according to the glacier area (Reference Xie and Q.Xie and others, 2006a). Then, taking the annual melt at the equilibrium line to represent the glacier total melt (Reference Ohmura, Kasser and FunkOhmura and others, 1992; Reference Kang, Liu, Wang, Han and ZhangKang and others, 1994), the total regional glacier meltwater runoff can be obtained from the area distribution of the GIC.
4.3. Estimation of glacier meltwater runoff
From the above, the normal glacier meltwater runoff can be estimated with the normal air temperature. Figure 4 shows the distribution of the normal glacier meltwater runoff in China estimated by the climate parameter temperature-index method (Reference YangYang 1991; Reference Kang, Yang, Lai, Ye, Xie and LiuKang and others, 2008) and the glacier system temperature-index method (Reference Xie and Q.Xie and others, 2006a,Reference Xie and Q.b). The normal annual glacier meltwater runoff in China is estimated at 60.465x10⁹m3 by the climate parameter temperature-index method, 38.7% of which is distributed in the northwest inland drainage basins, and at 61.574x10⁹m3 by the glacier system temperature-index method, 41.5% of which is distributed in the northwest inland drainage basins. Thus, the glacier runoff results estimated by the two temperature-index methods are very similar. This suggests that both the regional climate parameter φ of Equation (3) and the glacier of median size of a glacier system for the regional glacier meltwater estimation by Equation (4) could well represent the regional characteristics of glaciers, and that both Equations (3) and (4) could be applied to estimate the regional normal glacier meltwater runoff in west China.
Distribution of the normal annual glacier meltwater runoff (109m3) in China estimated by the climate parameter temperature-index method and the glacier system temperature-index method. The abscissa from Qiangtang plateau to the left indicates the inland drainage basins in the arid northwest, and that from the Yangtze River to the right indicates the outflow drainage basins (data from Reference Shi, Liu, Ye, Liu and WangShi and others, 2008, p. 1165, and from GIC).

In the inland drainage basins, glacier runoff is mostly distributed in the Tarim basin, and accounts for 13.342x10⁹m3, recharging 38.5% of the mountain runoff of the basin. In the outflow drainage basins, glacier runoff is mostly distributed in the Ganges river basin, and accounts for 28.048x10⁹m3, recharging 9.1% of the mountain runoff (Reference Shi, Liu, Ye, Liu and WangShi and others, 2008, p. 165).
5. Change of Glacier Runoff
When temperature increases and precipitation remains unchanged, glacier runoff will increase and glacier area will reduce. When the glacier melt increase, caused by temperature rise, is more than the meltwater reduction caused by the decrease in glacierized area due to glacier retreat, glacier runoff will increase to a maximum value. Based on this, Reference Xie, Feng and LiuXie and others (2006a,Reference Xie, Wang, Kang, Feng, Li and Chengb) developed a formulation to simulate the change of glacier runoff:

where W is the annual glacier runoff volume, γ 0 is the glacier runoff depth in the start year on the glacier area S 0, and γ d is the increment of glacier runoff depth in the year when the glacier surface area is reduced by S d. When glacier runoff increases first, then reduces to its value at the start year, S d can be calculated by

Suppose α = γ d /γ 0, then

According to the measurement on representative glaciers, there is a relationship between the average depth H (m) and area S (km2) of a glacier (Reference Liu and DingLiu and Ding, 1986; Reference Shi, Liu, Ye, Liu and WangShi and others, 2008):

Thus, from Equations (6–9), a glacier system model is developed to estimate the change in glaciers and their runoff under temperature change (Reference Xie and Q.Xie and Feng, 1996; Reference Xie, Feng and LiuXie and others, 2002, Reference Xie, Feng and Liu2006a,Reference Xie, Wang, Kang, Feng, Li and Chengb). Based on the GIC data, the change in glacier meltwater runoff can be estimated by the temperature-index method and the various temperature scenarios of climate change.
The simulation of glacier meltwater runoff under the temperature change of 0.031 K a–1 by glacier system model in west China between 1980 and 2000 indicates that the total glacier meltwater runoff increment is 10.8%, and it is 14.3% in the inland drainage basins in northwest China and 9.0% in the outland drainage basins in southwest China.
6. Conclusion
Glaciers are an important water resource in west China, especially in the inland river basins in the arid northwest, where glacier meltwater is an important source of runoff recharge of mountain rivers. Based on the GIC, glacier water resources were assessed for glacier distribution in China’s water-resource subareas, change of the glaciers, glacier runoff and its simulation under temperature change.
The glacier inventory only reflects the glacial status at the time when the glaciers were mapped. Application of the GIC data needs to take account of the changing status of the glaciers. In the assessment of China’s glacier water resources, field measurements and investigations of representative glaciers are used to analyze the change of the glaciers to find some statistical relationships, then to estimate the glacier change from the GIC.
The glaciers recorded in the GIC represent the basic conditions of existing glaciers in China. The estimation of glacier meltwater runoff is based on the existing glaciers and the average temperature of time series for many years. Therefore, the estimated glacier runoff is the normal value. If glaciers are in stable and equilibrium conditions, the estimated glacier melt is the change in ice storage. Glacial retreat under rising temperature will increase ice melt, reducing the ice storage of the glaciers.
Estimation of glacier change and meltwater runoff based on the GIC is very preliminary, because very few glaciers have been measured. Further field measurements should be made and research on glacier changes in response to climate change should be strengthened. The ongoing project of the second GIC with remote-sensing techniques will bring new progress in the assessment of glacier water resources and their changes in China.
Acknowledgements
We thank the National Natural Science Foundation of China for support through grant No. 90702001, and the Chinese Hydraulic Engineering Society for support through the Project of Water Resources Assessment of China.



