Introduction
Best linear unbiased predictors (BLUP) of the additive genetic values (Henderson, 1973) provide an adequate partition of the phenotypic trend into the genetic and the environmental components. It requires including all data used for the selection (Im et al., Reference Im, Fernando and Gianola1989) and to know the true variance components (Thompson, Reference Thompson1986). The latter requirement can be alleviated by using the bayesian inference (Sorensen et al., Reference Sorensen, Wang, Jensen and Gianola1994).
After the papers of Blair and Pollak (Reference Blair and Pollak1984) and Sorensen and Kennedy (Reference Sorensen and Kennedy1984), the evaluation of the genetic response is usually calculated just by monitoring how the BLUP averages evolve after the selection decisions and therefore it is used to validate the whole selection scheme. However, this analysis does not allow evaluating each of the single parts of the selection scheme, and the effectiveness of the different selection decisions. For instance, differential selection intensities are used on males and dams (Van Tassell and Van Vleck, Reference Van Tassell and Van Vleck1990), artificial insemination (AI) sires are used jointly with natural service ones (Burnside et al., Reference Burnside, Jansen, Civati and Dadati1992), etc.
In this paper, a simple procedure is presented to partition the genetic trend in pieces originated by the founder effects and the Mendelian sampling terms of non-founders. Given that selection works when the animals with higher Mendelian sampling effects are mated more frequently, this partition will assist to monitor the response provided by different selection decisions.
Method
After the infinitesimal model, additive genetic values are assumed to be multivariate and normally distributed as  . The variance can be factorized as
 , where T relates each animal and its ancestors and
 includes the variability of both the founder animals and the Mendelian sampling terms of the non-founder animals. Details about this factorization of A can be found in Quaas (Reference Quaas1976) for inbred animals. Following this factorization, the additive genetic values can be transformed as

where Φ random variables such as  . In fact, given the triangular shape of T, the variance of φi is the variability independent of the ancestors or simply the conditional variance
 .
As described in Woolliams et al. (Reference Woolliams, Bijma and Villanueva1999), formula (1) allows a complete partition of each breeding value as

where ai can be partitioned in i contributions, including both the founder animals and the Mendelian sampling terms of the non-founder animals. Formula (2) was used in Woolliams et al. (Reference Woolliams, Bijma and Villanueva1999) to optimize the genetic gain in relation to inbreeding and genetic contributions of ancestors.
Given that φ is simply a linear transformation of a, formulas (1) and (2) also hold for unbiased predictors as

and

Partitioning the response to selection into partial responses originated by several groups of Mendelian sampling effects will consist of dividing T accordingly.
For any set P1 + P2 + P3 + … +Pm = I, we can write

Here, we set up Pi as a diagonal matrix containing ones or zeroes at the corresponding elements. Defining P as such, it selects the corresponding columns of T, or, for a given ai, the corresponding ancestor effects. From formula (3),  and substituting this result into formula (5) gives

where  is a part of the breeding value that can be assigned to the group ‘i’. Partial genetic responses will be obtained from averages of the partial predicted breeding values
 .
Results
To illustrate the procedure presented in this paper, we will present two examples performed on simulated data. In the first example, we will partition the genetic trend in two pieces, the genetic gain coming from the Mendelian sampling terms of males and the one coming from the Mendelian sampling terms of females. We will point out whether the partial genetic trends correspond to the response due to selection on males or females. In the second example, we will partition the genetic trend due to Mendelian sampling terms of the AI sires. In this case, we will try to reveal the impact of an AI center in a breeding population.
Example: differential selection in the two sexes
In this example, we will use a simulated data set with 100 non-overlapping generations with 100 males and 100 females each, i.e. 20 000 animals, all recorded. In each generation, the ancestors of any individual were phenotypically selected from a randomly chosen pair of candidates without any restriction on the number of offspring per dam nor in the number of dams per sire. Model included the overall mean as the only fixed effect and the heritability was set to 0.25.
In order to show how the procedure can distinguish the genetic gain of the population because of the selection of sires or dams, the selection policy varies every 25th generation. In the first period (generations 1 to 25), the selection was carried out only on the sire side. In the second period (generations 26 to 50), the selection was carried out only on the dam side. During the third period (generations 51 to 75), the selection on males and females was implemented simultaneously. Finally, in the fourth period (generations 76 to 100), sires and dams were selected in opposite directions in order to cancel the total response. In this case, selection on the dam side was carried out by choosing the dam with the worse phenotype from a randomly chosen pair of candidates.
In this example, we split T by using Pm + Pf = I, where Pm is a diagonal matrix with ones in the male positions and zeroes in the female positions, and Pf = I − Pm. The breeding values  were obtained by assuming the variance components to be known.
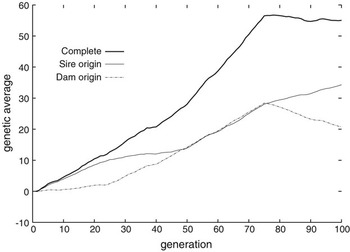
Figure 1 shows the estimated genetic response over the 100 generations and both the estimated response on the whole population coming from the Mendelian sampling terms of males and females separately. Monitoring selection on sires and dams by using these partial genetic trends seems to be a good approximation. For instance, in the last 25 generations, the whole population is apparently unselected, but the plot of the partial genetic response reveals the opposite selection pressures on sires and dams.
The estimated genetic response of the whole population and the estimated genetic response due to selection of sires and selection of dams. The selection policy varies every 25th generation.

Nevertheless, the partial genetic trends provided by the Mendelian sampling terms of males or females do not exactly partition the genetic trend in terms of selection performed in both genders. For instance, an exact partition should result in a horizontal trend provided by selection on dams up to the 25th generation, but Figure 1 shows a small but significant slope. This slope indicates that Mendelian sampling terms of dams contribute to response even though there is no selection on females. The mechanism is that dams with higher Mendelian sampling terms have more selected sons. The same effect can be observed in the partial genetic trend for sires in the second interval.
Example: testing the impact of the AI center in the population
The data file was simulated with 60 non-overlapping generations with 100 males and 100 females each, i.e. 12 000 animals, all recorded. Selection was carried out on natural service sires, AI sires and dams. AI sires were the best 10% males chosen using the phenotype, natural service sires were the remaining 90% of the males. Selection on natural service sires and dams was carried out by choosing the animal with the best phenotype from a randomly chosen pair of candidates.
As in the previous example, the selection policy was modified along the selection experiment. During the first 25 generations, AI sires contributed with the 30% of the descendants and the natural service sires with the 70%. From generation 26 to generation 35 only the natural service sires were used, and from generation 36, the AI sires contributed with the 80% of the next generations. Dams were selected from generation 31 onwards.
As in the previous example, we used three diagonal P matrices with ones just of the corresponding positions, namely, AI sire positions, natural service sire positions or dam positions.
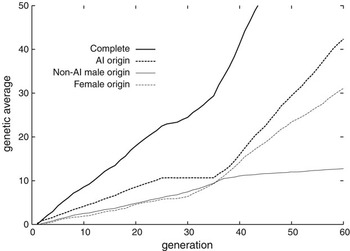
Figure 2 shows the estimated genetic response and its components coming from the AI sires, the natural service sires and the dams. It can be observed that the contribution of AI sires stops when the AI sires are not used and it increases during the last generations, where they contribute the 80%. It can also be noticed that the contribution of the Mendelian sampling terms of the females to the genetic trend increases after generation 31. The contribution of the selection on natural service sires to the genetic response is smaller than the contribution of the dams because they have been selected but among the remaining 90% (after the best 10% of the sires will be chosen as AI sires). During the last 25 generations, the contribution of the natural service sires to the genetic trend is smaller than the contribution of dams because they provide only 20% of the descendants.
The estimated total genetic response and the estimated genetic response due to selection of natural service sires, AI sires and dams.

As in the previous example, the genetic trend provided by the dams is significant during the first 30 generations, although the dams were unselected during that period.
Discussion
We presented a simple procedure to separate the genetic response into smaller components corresponding to different selection decisions and we illustrated with two examples. The estimated response to selection was analyzed as the average of the expected breeding values,  , at each generation. These averages per generation were split following formula (6). In both examples, the selection policies were modified in order to show the behavior of the procedure in Figures 1 and 2. For that reason, the genetic trend calculated over the entire experiments is senseless here. Genetic trends, sometimes obtained as the linear regression of the elements of
 on the generation number, can be exactly partitioned in the same way.
The second example shows how the impact of the AI center in the genetic progress can be analyzed separately from the genetic response coming from the selection on farms. Other scenarios where breeders can be interested in such a procedure can involve the evaluation of multiple ovulation embryo transfer selection nucleus, hyperprolific selection experiments or maybe to compare the results of a local selection scheme v. the imported semen.
The procedure presented in this paper allows, for the first time, the calculation of the partial genetic trends directly from the  and therefore to establish the relevance of different paths of selection. Until now this problem usually tackle calculating selection differentials for the different paths (Van Tassell and Van Vleck, Reference Van Tassell and Van Vleck1990) what it is not a trivial task, specially when generations overlap.
Our approach is simple and it only requires the mixed model solutions and the additive relationship matrix. Nevertheless, the procedure assumes that the differential reproduction in favor of a given animal is a consequence of its selective value. Obviously this is not always true. For instance, Figures 1 and 2 show that selection in males tends to increase the number of descendants of their dams, regardless of how the selection affected them in the previous generation.
In general, science works by partitioning the complexity of nature in parts fitting in our simple analytical procedures. Following this idea, we think that our result will help the animal breeders to analyze more deeply the genetic response of the selected populations.
Acknowledgments
This study has been supported by the research project CPE-03-2004-C2, funded by the Instituto Nacional de Investigación y Tecnología Agraria y Alimentaria.