Introduction
Omnivory, defined as feeding at more than one trophic level, is widespread in nature, increasing the complexity and influencing the stability of food webs (McCann & Hastings, Reference McCann and Hastings1997; Coll & Guershon, Reference Coll and Guershon2002; Arim & Marquet, Reference Arim and Marquet2004). Omnivores are increasingly used in biological control though their effectiveness can vary with available dietary sources (Agrawal et al., Reference Agrawal, Kobayashi and Thaler1999; Eubanks & Denno, Reference Eubanks and Denno1999; Coll & Guershon, Reference Coll and Guershon2002). Therefore, it is important to isolate the mechanisms influencing variation in the occurrence and strength of the interactions surrounding an omnivore to maximize the efficiency of these biocontrol systems. Variation in omnivory may arise from age-related differences among individuals (Polis et al., Reference Polis, Myers and Holt1989; Branstrator et al., Reference Branstrator, Cabana, Mazumder and Rasmussen2000), differences in food quality (Diehl, Reference Diehl2003; Janssen et al., Reference Janssen, Willemse and van der Hammen2003; Singer & Bernays, Reference Singer and Bernays2003; Magalhaes et al., Reference Magalhaes, Janssen, Montserrat and Sabelis2005), risk associated with foraging (Singer & Bernays, Reference Singer and Bernays2003), nutritional needs (Gadd & Raubenheimer, Reference Gadd and Raubenheimer2000) or food availability (Mooney & Tillberg, Reference Mooney and Tillberg2005). However, omnivory is not a simple interaction between two species and may involve numerous indirect interactions (Diehl, Reference Diehl1995; Bruno & O'Connor, Reference Bruno and O'Connor2005). This complexity suggests that more advanced techniques may be necessary to infer the degree of omnivory.
Diet composition is one way to infer the relative strength of trophic interactions for an omnivore, though classic methods are not always feasible. Stable isotope analysis is a technique using the ratios of naturally occurring isotopes within organisms to determine both resource and habitat use (Newsome et al., Reference Newsome, Martinez del Rio, Bearhop and Phillips2007). The ratio of heavy to light nitrogen isotopes (δ15N) is generally used as an indicator of trophic position as the lighter isotope tends to be preferentially excreted, leading to an accumulation of the heavier isotope at higher trophic levels (Deniro & Epstein, Reference Deniro and Epstein1981). Carbon isotope ratios (δ13C) are used as an indicator of the plant source, as this isotopic ratio is determined during photosynthesis and shows little change between trophic levels (Deniro & Epstein, Reference Deniro and Epstein1978). This technique is often used to determine diets and has been used to measure the degree of omnivory (Bluthgen et al., Reference Bluthgen, Gebauer and Fiedler2003; Mooney & Tillberg, Reference Mooney and Tillberg2005). Most commonly, the interpretation of omnivory using stable isotopes involves the determination of trophic position within a dietary mixing model (Newsome et al., Reference Newsome, Martinez del Rio, Bearhop and Phillips2007). These models quantify the proportion of each source in the diet using a series of linear equations incorporating the isotopic signatures of the diet components and the subject. Alternatively, variation within isotopic signatures has also been proposed as an indicator of diet breadth and omnivory (Bearhop et al., Reference Bearhop, Adams, Waldron, Fuller and Macleod2004) although there are some issues with this approach (Newsome et al., Reference Newsome, Martinez del Rio, Bearhop and Phillips2007). When coupled with abundance estimates, a concurrent measure of dietary change provided by stable isotope analysis should elucidate the relationships between omnivory and community dynamics.
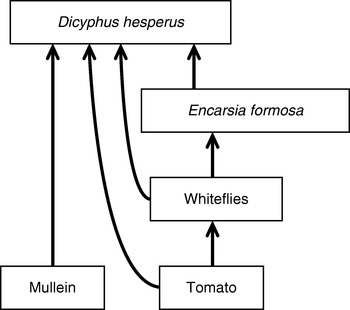
Dicyphus hesperus Knight (Heteroptera: Miridae), is an omnivorous insect which requires both plant and prey in its diet (McGregor et al., Reference McGregor, Gillespie, Quiring and Foisy1999). It is currently used as a biological control agent for greenhouse whitefly (Trialeurodes vaporariorum Westwood [Homoptera: Aleyrodidae]) and on greenhouse tomato, (Lycopersicon esculentum Mill [Solanaceae]), in Ontario and British Columbia, Canada. Also within this system, the parasitoid Encarsia formosa Gahan (Hymenoptera: Aphelinidae) is routinely used for biological control of whitefly (Hoddle et al., Reference Hoddle, van Driesche and Sanderson1998) and mullein (Verbascum thapsus L. [Scrophulariaceae]) is included as a supplemental high quality plant food for D. hesperus (Sanchez et al., Reference Sanchez, Gillespie and McGregor2003). Intraguild predation, a special case of omnivory where a predator eats its competitors, also occurs, with D. hesperus feeding on parasitized whitefly (McGregor & Gillespie, Reference McGregor and Gillespie2005). These feeding relationships lead to a complicated food web (fig. 1). It is important to understand the dynamics of these interactions to maximize feeding upon whiteflies and to minimize plant feeding and interference with the parasitoid.
The food web used within this study. Arrows represent the direction of biomass transfer.

To investigate the factors affecting changes in diet choice for D. hesperus, we established a series of experiments. To determine baseline isotopic data, feeding trials were used to compare D. hesperus with their diet sources and to compare among diet sources. We hypothesized that D. hesperus would be enriched in 15N relative to their diet, with the prey being slightly enriched relative to the plant component of the diet. Whiteflies parasitized by E. formosa were expected to show an increase in δ15N relative to healthy pupae, with δ13C being used to differentiate among plant sources. To determine the factors influencing the degree of omnivory, we constructed cages where the omnivore would be subjected to varying populations of whitefly and their parasitoid and multiple plant species. Dietary changes were tracked using stable isotope analysis and then compared with known changes in prey abundance. Plant feeding was expected to increase with declining prey populations, and intraguild predation was expected to vary according to the ratio between healthy and parasitized pupae.
Materials and methods
Plant and insect sources
For greenhouse trials, tomato plants var. Rhapsody were grown hydroponically in rockwool growing medium in a greenhouse at the Agriculture and Agri-Food Canada Greenhouse and Processing Crops Research Centre (GPCRC) in Harrow, Ontario, Canada. Plants were watered and fertilized through a fertigation system. The nutrient solution contained 230 ppm NO3, 10 ppm NH4, 60 ppm P, 460 ppm K, 200 ppm Ca, 80 ppm Mg, 3 ppm Fe and 0.5 ppm Mn with an EC of 2800 μScm−1 and a pH of 5.5. Tomato plants for the feeding trials were cultivated in BM2 germinating mix soil (Berger Peat Moss Co.) at the University of Windsor greenhouse in Windsor, Ontario, Canada. Plants were grown under natural light supplemented with high pressure sodium lights (16 h light photoperiod), flooded daily and fertilized with 4 ml of all purpose 20-20-20 fertilizer (Plant-Prod(R)) mixed in one litre of water once per week. Mullein plants were grown from seeds originally collected in Summerland, British Columbia, Canada. They were cultivated from seed at the University of Windsor greenhouse and then transferred to the GPCRC for use in the greenhouse cage trials. The mullein at both locations were maintained using the same methods as used for tomato.
Colonies of D. hesperus were established from individuals originally collected on white hedge nettle (Stachys albens Gray [Lamiaceae]) at 500 m elevation in the Sierra Nevada Mountains in California, at 25° 42' N, 118° 50' W. Colonies were kept at 24°C and 16 h light photoperiod. Insects were reared on tobacco (Nicotiana tabacum L. [Solanaceae]) and fed a diet of Ephestia kuehniella Zeller (Lepidoptera: Pyralidae) eggs. Encarsia formosa were obtained from Koppert Biological Systems (EN-STRIP) as parasitized whitefly pupae. It should be noted that the term pupae is used to refer to the final juvenile instar of whitefly. These are not true pupae but are commonly referred to as such and will be for the remainder of this manuscript. Adult parasitoids were allowed to emerge before use in the greenhouse trials, but were presented to D. hesperus as parasitized whitefly pupae on the card for the feeding trials. Whiteflies for the greenhouse cage trials were obtained from a colony maintained on tomato at the GPCRC. The whiteflies for the colony were collected from commercial greenhouses in southwestern Ontario, Canada. Whiteflies for the feeding trials were collected from a colony grown on tomato in the University of Windsor greenhouse. The whiteflies for this colony were originally collected from commercial greenhouses in the region.
Feeding trials
To determine changes in feeding by monitoring isotopic signatures, baseline isotopic data needs to be established. This data gives the average fractionation rate between trophic transfers. Fractionation rates can be defined as the difference between the isotopic composition of the resource and the consumer resulting from metabolic processes within the consumer, usually given in parts per thousand (‰). To this end, a series of feeding trials were used to determine fractionation rates between D. hesperus and their possible diets, including whitefly and parasitized whitefly. Comparisons were also made among plant materials grown under common conditions and between parasitized and non-parasitized whiteflies taken from a single colony.
For the feeding trials, adult D. hesperus were taken from the rearing colony and placed in 500-ml foam cups with one insect per cup. Age was standardized among individuals by selecting only insects which had reached sexual maturity within one week of the experiment. Within each cup there was a covered water reservoir and a tomato leaflet with the petiole inserted into the reservoir. Depending on the treatment, the leaflet was either clean or infested with whitefly pupae. Into each of the cups with a clean leaf, a single card containing approximately 80 parasitized pupae was inserted. Cards were used instead of infested leaves due to difficulties encountered in establishing colonies of E. formosa. Prey and plant material were replaced in both treatments every 2–3 days to ensure the availability of prey and the consistency of the plant resource. After 30 days, D. hesperus individuals were collected for isotopic analysis. This experiment was completed a second time.
To determine isotopic differences among diet components, representative diet samples of whitefly pupae, parasitized pupae and tomato leaves were collected throughout the feeding trials for isotopic analysis. Samples of parasitized pupae from the whitefly colony were also collected to compare against healthy whitefly pupae and tomato to determine fractionation rates among these diet components. For each prey collection, prey items were collected from a single tomato leaf and contained a minimum of twenty pupae. To compare between plant sources available within the greenhouse cage trials, mullein and tomato which were grown under common conditions were used. Tobacco leaves and E. kuehniella eggs were also collected for isotopic analysis to represent the rearing diet of D. hesperus. All samples were frozen at −10°C until analysis.
Greenhouse cage trials
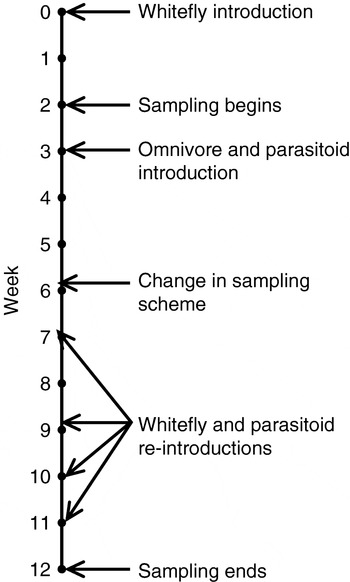
Cage trials were conducted to correlate changes in the isotopic signature of D. hesperus with changes in abundances of prey types within a greenhouse at the GPCRC. Cages were constructed using 3.8 cm ABS plastic pipe and covered with polypropylene non-woven fabric (Agryl-P17), a commonly used insect barrier due to its small mesh size. All cages were 1.44 m2 at the base and 2 m in height. Each cage enclosed six tomato plants with a single potted mullein plant suspended in the center of the cage near the top. Mullein was included to facilitate the establishment and survival of the omnivorous D. hesperus (Sanchez et al., Reference Sanchez, Gillespie and McGregor2003). Whiteflies were introduced once the tomato plants had reached a minimum height of 1 m. Into all cages, 30 adult whiteflies were introduced and allowed three weeks to establish within the cage before omnivore and parasitoid introduction. The introduction of whiteflies is marked as week zero according to the timeline used within this manuscript (fig. 2). Thirty-six D. hesperus individuals were introduced into each cage, with the introduction split evenly among adults (at an even sex ratio), late instar juveniles and early instar juveniles. In order to create a variable parasitism environment, five cages received 15 adult female parasitoids (high release rate) and five cages received five adult females (low release rate). Both whitefly and E. formosa were re-released into the cages at their initial release rates at weeks 7, 9, 10 and 11 due to declining whitefly populations.
Timeline of events within the greenhouse cage trials.

In weeks 2, 4 and 5, nine leaves were removed with three leaves randomly selected from the top, middle and bottom of three plants within each cage to monitor whitefly and E. formosa populations. It was found that the random removal of a leaf from the top section often included no visible whiteflies. Thus, this sampling scheme was altered beginning the sixth week to minimize the impacts on whitefly populations and especially the removal of whitefly eggs and 1st instar nymphs which were difficult to detect. Leaf sampling was changed from a random sampling scheme to a directed sampling scheme designed to target specific stages in the whitefly populations. This targeting was possible due to the aggregated and structured nature of whitefly populations (van Lenteren & Noldus, Reference van Lenteren, Noldus and Gerling1990). Three leaves were removed from two plants each week, according to a schedule such that each plant was sampled every 3rd week. Six leaves were now removed from each cage weekly for prey population surveys. The 4th, 8th and 12th leaves from the top of the plant were removed to target nymphs, pupae and exuviae, respectively. Whitefly nymphs, pupae and parasitized pupae were counted on each leaf by visual scans aided by the use of a stereomicroscope.
Beginning in week 6, up to five adult D. hesperus individuals per cage were removed every two weeks for isotopic analysis. The number of D. hesperus removed was determined by the number of individuals caught within ten minutes of searching the cage. Other losses of prey and natural enemies may have occurred during weekly crop maintenance, as senescing basal leaves and secondary shoots were removed from the plant following commercial propagation practices. All removed leaves were placed on the floor of the cage for a period of one week to minimize any losses of natural enemies and prey. The experiment was conducted for 12 weeks from the introduction of whiteflies into the cages. This allowed for at least two generations of all insects. Temperature readings were recorded every 15 min throughout the experiment. At the completion of the experiment, tomato leaf tissue was collected from six random plants for isotopic analysis.
Isotope analyses
All samples were dried at 70°C for 72 h prior to analysis. Plant tissues were analyzed as individual leaves. Each individual leaf was homogenized using a mortar and pestle and then weighed to approximately 450 μg. Healthy and parasitized whitefly pupae were grouped according to their source, whether it was a specific leaf or card. Whitefly and E. formosa samples were weighed to approximately 250 μg for analysis. Each sample contained a minimum of ten whitefly or E. formosa pupae. Each sample type was repeated between three and six times, with the majority of sample types having five replicates. Dicyphus hesperus were analyzed individually as whole insects. All D. hesperus were starved for 24 h prior to being frozen to minimize contamination by gut contents. In cases where the weight of the insect exceeded 600 μg, the insect was homogenized and a sample of 300 μg was taken. Ephestia kuehnella eggs were grouped into a single sample and weighed to approximately 300 μg for analysis.
All samples were placed into tin capsules and analyzed for 13C and 15N at the University of Windsor stable isotope laboratory using a Thermo Finnigan Flash 1112 elemental analyzer coupled to a Thermo Finnigan Delta Plus mass spectrometer, operating in continuous flow mode. The samples collected from the cage trials and the first feeding trial were analyzed on a separate run of the elemental analyzer than the samples collected during the second feeding trial. Samples are expressed in delta notation as: δX=[(Rsample/Rstandard)–1]×1000 with X representing either 15N or 13C and Rsample and Rstandard representing the ratio of the heavy to light isotope (15N/14N or 13C/12C) of the sample or the standard, respectively. For nitrogen, the standard is atmospheric nitrogen and for carbon the standard is PeeDee belemnite. The precision was better than 0.1‰ for 13C and 0.3‰ for 15N for the initial run and 0.2‰ for 13C and 0.3‰ for 15N for the second run.
Statistical analysis
To determine the significance of fractionation rates between D. hesperus and their diet, the isotopic signatures (δ13C and δ15N) of D. hesperus from the initial feeding trial were compared to their diet components using multivariate analysis of variance (MANOVA). Feeding trial data for D. hesperus from the second trial were discarded due to sample contamination. MANOVA allows the comparison of means of multiple dependent variables given the same set of independent variables, while retaining the results of the univariate ANOVAs (Zar, Reference Zar1999). Thus, both δ13C and δ15N were set as dependent variables with the levels of the independent variable being the different dietary components, including immature whitefly, parasitized immature whitefly and the plant components. Both the multivariate and univariate results are reported. In this analysis, trials with D. hesperus fed whitefly were analyzed independently from those where D. hesperus was fed E. Formosa, as the commercial origin of E. formosa used in this part of the experiment makes a direct comparison invalid.
Other analyses were conducted to determine differences between diet components. To determine the significance of fractionation rates between tomato, whitefly and E. formosa, samples were taken for all three organisms from a colony maintained at the University of Windsor. Both δ13C and δ15N of all three organisms were compared independently using a general linear model with trial number as a random factor. MANOVA was not used for this analysis, as random factors cannot be included in this statistical test. For this analysis, carbon data were rank transformed and nitrogen data were log transformed prior to analysis. To compare the signatures of possible diet contributors within the greenhouse trials, mullein, tomato, whitefly and parasitized whitefly were grown under common conditions at the University of Windsor. Results from these samples were then compared using MANOVA for both δ13C and δ15N following rank transformation for carbon and log transformation for nitrogen. For all analyses, post hoc analysis was done using Tukey's test when appropriate.
Within the greenhouse cage trials, insect counts were taken on roughly a weekly basis. These counts were then summed per cage to give a value for total prey within that cage and then log transformed. The total prey count data were split into two phases. These phases represent the two different sampling schemes employed and are roughly correlated to the population growth and decline of whitefly populations. The initial phase ran from week 2 until week 5 and coincided with population growth. The second sampling phase began in week 6 until week 12 and coincided with population decline. These two phases were analyzed independently using linear regression. We were unable to statistically determine weekly differences in the abundances of parasitized pupae or parasitism rates. A low frequency of observed parasitism within the cages prevented statistical analysis.
The isotopic signatures of D. hesperus were analyzed in two ways. They were analyzed as weekly averages for each cage to determine the mean change over time and as the range of values within each cage to look at variability within the population. Both the mean of the δ13C and δ15N measurements and the range of values for each cage were regressed against time individually using linear regression. Cages for which only one individual was captured were excluded from the analysis of the range of isotopic values. Values for the range of δ13C were log transformed prior to analysis. To document environmental conditions, daily mean, minimum and maximum temperature data were also regressed vs. time. All statistical analyses were conducted using SPSS 15.0 (SPSS, 2006).
Results
Feeding trials
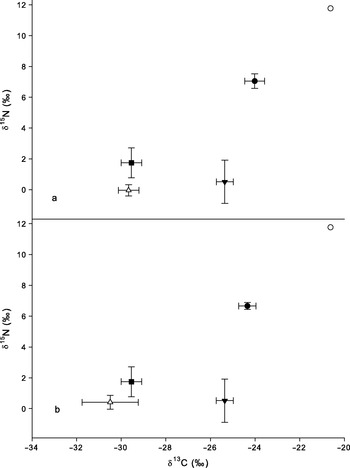
Dicyphus hesperus remained isotopically distinct from their diet, when fed either whitefly (Wilks' λ4,14=0.04, P<0.001; fig. 3a) or parasitized pupae (Wilks' λ4,18=0.043, P<0.001; fig. 3b). These differences held for both δ15N (whitefly, F 2,8=40.14, P<0.001; E. formosa, F 2,10=55.70, P<0.001) and δ13C (whitefly F 2,8=53.18, P<0.001); E. formosa, F 2,10 =21.85, P<0.001). Dicyphus hesperus fed whitefly pupae and tomato were enriched in δ13C by an average of 5.52‰ from tomato (P<0.001) and 5.65‰ from whitefly (P<0.001) with a mean enrichment of 5.59‰ from the entire diet. Nitrogen enrichment for these same insects was 5.30‰ from tomato (P=0.001) and 7.09‰ from whitefly (P<0.001) with a mean of 6.20‰. Dicyphus hesperus fed parasitized whitefly differed from their diet by 5.68‰ for δ13C on average, being enriched from tomato by 5.20‰ (P=0.002) and 6.15‰ from the parasitized whitefly (P<0.001). Average enrichment for δ15N was 5.59‰, being 6.25‰ more enriched than parasitized pupae (P<0.001) and 4.92‰ more enriched than tomato (P<0.001). Visual inspection shows that the isotopic signature of these insects is midway between the rearing diet and the experimental diet (fig. 3).
Average stable isotope signatures of D. hesperus and diet components. Ephestia kuehniella eggs and tobacco leaves represent the rearing diet. (a) Dicyphus hesperus fed whitefly and tomato leaves. (b) Dicyphus hesperus fed whitefly parasitized by E. formosa and tomato leaves. Error bars represent one standard error (•, D. Hesperus; ○, E. kuehniella eggs; ▾, tobacco; ▵, whitefly;  , tomato).

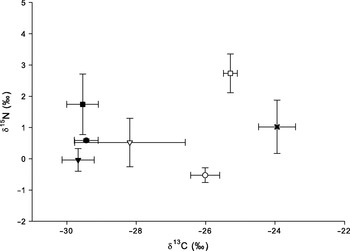
No significant differences were found between tomato leaves, whitefly and parasitized whitefly taken from the whitefly colony (fig. 4) in δ13C (F 2,2=1.27, P=0.441) and δ15N (F 2,2=2.69, P=0.271). No significant effects of trial number (δ13C, F 1,2=13.93, P=0.065; δ15N, F 1,2=0.05, P=0.838) or interactions between trial number and food type were found (δ13C, F 2,14=1.80, P=0.201; δ15N, F 2,14=1.96, P=0.178), but the differences between trials in δ13C are nearly significant. Mullein, tomato, whitefly and parasitized whitefly cultivated within the same greenhouse showed significantly different isotopic signatures (Wilks' λ6,26=4.04, P=0.050; fig. 4). Univariate analysis showed that these differences were related to δ13C (F 3,14=7.58, P=0.030) and not δ15N (F 3,14=2.02, P=0.158). Mullein was enriched in 13C by 4.24‰ relative to whitefly (P=0.002) and 2.07‰ relative to parasitized pupae (P=0.032), thus showing the utility of carbon to differentiate between plant sources.
Average stable isotope signatures for diet components for D. hesperus from feeding trials 1 (filled symbols) and 2 (open symbols). Mullein signatures are from plants grown concurrent with samples analyzed during trial 2. Error bars represent one standard error (•, Encarsia; ▾, whitefly; , tomato; X, mullein).

Greenhouse cage trials
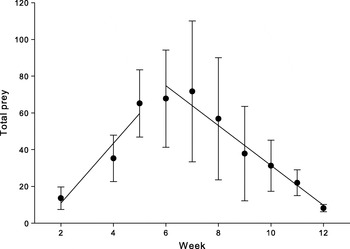
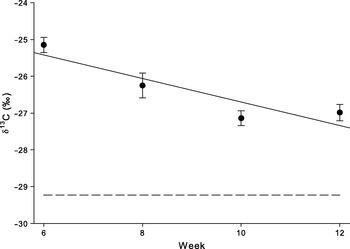
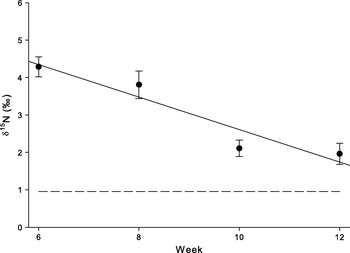
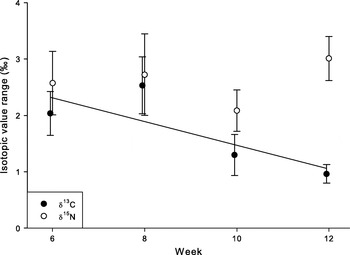
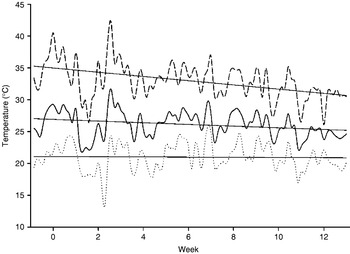
Average prey populations grew initially until week 5, two weeks after the addition of the natural enemies to the cages (fig. 5; R 2=0.314, P=0.001). Average prey populations began to decline after this week and continued to decline until the experiment was terminated (fig. 5; R 2=0.064, P=0.04). This decline in available prey coincided with declines in both Δ13C (fig. 6; R 2=0.323, P<0.001) and δ15N (fig. 7; R 2=0.338, P<0.001). The range of values found within each cage declined over time for δ13C (fig. 8; R 2=0.178, P=0.015), but there was no change in the range of δ15N (P=0.833). Final values for δ13C and δ15N show that, in week 12, D. hesperus was enriched relative to the tomato leaves by 2.24‰ for carbon and 1.01‰ for nitrogen. Average (R 2=0.069, P=0.009) and maximum (R 2=0.219, P<0.001) temperatures declined over time (fig. 9), but minimum temperatures did not statistically vary (P=0.801).
Prey numbers within cages over time. Regression lines represent population growth phase (R 2=0.314) and population decline phase (R 2=0.110). Transition occurs at change in sampling protocol. Regression analyses were conducted on log transformed data. Error bars represent one standard error.

δ13C signatures of D. hesperus during greenhouse cage trials. Averages were taken for all individuals within each mesocosm. Data points represent the mean of the averages. Regression line represents decline over time (R 2=0.323). Dashed line shows the average value of tomato leaves samples from the cages in week 12. Error bars represent one standard error.

δ15N signatures of D. hesperus during greenhouse cage trials. Averages were taken for all individuals within each mesocosm. Data points represent the mean of the averages. Regression line represents decline over time (R 2=0.338). Dashed line shows the average value of tomato leaves samples from the cages in week 12. Error bars represent one standard error.

Range of isotopic values (max–min) found within each cage for both δ13C and δ15N. Regression line shows the decline in the range of carbon values over time (R 2=0.178). No trend was found for nitrogen values. Error bars represent one standard error (•, δ13C; ○, δ15N).

Temperature readings over the course of the greenhouse cage trials. Data use daily mean, minimum, and maximum temperatures. Both maximum (R 2=0.219) and mean (R 2=0.069) values declined over time. Minimum temperatures fluctuated but showed no overall trend (––––, mean; …….., minimum; – – –, maximum).

Discussion
Feeding trials
The diet of an omnivore is usually complex and stable isotope analysis has been suggested as a means to isolate the relative proportions of different diet components (Bluthgen et al., Reference Bluthgen, Gebauer and Fiedler2003; Mooney & Tillberg, Reference Mooney and Tillberg2005). Our attempts to apply this technique to the diet of D. hesperus met with mixed success. In general, the feeding trials showed the isotopic signature of D. hesperus to be influenced by the food that they eat. In accordance with our hypothesis, we found D. hesperus to be enriched relative to their diet. However, they were unexpectedly enriched in both 15N and 13C (fig. 3). We had expected D. hesperus to be enriched in 15N and perhaps mildly in 13C, but found their δ13C values to be much greater than is often reported (Post, Reference Post2002; Spence & Rosenheim, Reference Spence and Rosenheim2005). When looking at the results graphically, it becomes apparent that the isotopic signatures for D. hesperus were influenced by their rearing diet. The E. kuehniella eggs fed to the insects during rearing were greatly enriched in both isotopes, which likely had residual effects on the isotopic signatures of these insects following the feeding trials. We had expected the length of the trial to be sufficient to determine fractionation rates as the trial length of 30 days was longer than previous studies of tissue turnover time in insects (Ostrom et al., Reference Ostrom, ColungaGarcia and Gage1997). However, this residual effect may be due to the lack of turnover in tissues such as the exoskeleton and tracheae following the final molting. As we are unable to quantify the influence of the rearing diet, our estimates of fractionation rates may be biased.
We were also unable to statistically differentiate between whitefly, parasitized whitefly and tomato (fig. 4). The differences were expected to be minimal between these components, as phloem feeding insects are not highly enriched relative to their diet (Spence & Rosenheim, Reference Spence and Rosenheim2005; Sagers & Goggin, Reference Sagers and Goggin2007) though we had expected them to be distinct. Differences between parasitized and healthy whitefly were expected to be more pronounced (Langellotto et al., Reference Langellotto, Rosenheim and Williams2005, Reference Langellotto, Rosenheim and Williams2006), but these studies used adult parasitoids and hosts for isotopic analysis. In the current study, immature whiteflies and parasitoids were used because they are the predominant stages where predation by D. hesperus occurs. Our inability to distinguish between healthy and parasitized whitefly is not without precedence (Tooker & Hanks, Reference Tooker and Hanks2004) and is likely due to how fractionation occurs in these insects. Fractionation occurs due to discrimination against the heavy isotope during metabolic processes (Deniro & Epstein, Reference Deniro and Epstein1978, Reference Deniro and Epstein1981), but wastes are not excreted by the parasitoid until just prior to emergence (Hoddle et al., Reference Hoddle, van Driesche and Sanderson1998). If wastes are not excreted, then there can be no enrichment of the heavier isotopes. As we were not able to differentiate between these diet components, we cannot directly infer the degree of omnivory. These results make the use of stable isotopes to measure omnivory in any biocontrol system containing phloem feeding insects and parasitoids unviable without further knowledge.
Mullein plants were enriched in δ13C relative to both whitefly and parasitized whitefly, but not tomato leaves (fig. 4). It is common for phloem feeding insects to be slightly depleted in δ13C relative to their host plant (Spence & Rosenheim, Reference Spence and Rosenheim2005). This depletion was likely large enough for the insects to be statistically distinct, but not tomato. We also found a large amount of isotopic variability found within each of the diet components, which overshadowed differences among diet components. Variation in δ15N and δ13C were quite high within the diet components with an average range of 3.56‰ for δ15N and 2.90‰ for δ13C. Recent meta-analyses have found a mean trophic enrichment of −0.53‰ for δ13C and 1.88‰ for δ15N (Spence & Rosenheim, Reference Spence and Rosenheim2005). Using these values, the average range of isotopic signatures found within diet components equaled approximately 5.5 trophic levels for carbon and two trophic levels for nitrogen. Variation in whitefly and parasitoid samples likely just reflect variation in the leaves from which they were collected, as each insect sample was taken from a distinct leaf and plant. Thus, all variation within diet components can be attributed to variation within plant groupings.
Numerous factors can influence the isotopic signature of plants. Plant δ15N can vary with the age of the plant (Handley & Scrimgeour, Reference Handley and Scrimgeour1997), between plant organs (Evans, Reference Evans2001) and leaves of different ages (Zanne et al., Reference Zanne, Lower, Cardon and Orians2006), as well as with small differences in microhabitat (Handley & Scrimgeour, Reference Handley and Scrimgeour1997; Dawson et al., Reference Dawson, Mambelli, Plamboeck, Templer and Tu2002). Carbon signatures can also be affected by genetic variation and many types of environmental variation (Farquhar et al., Reference Farquhar, Ehleringer and Hubick1989; Smedley et al., Reference Smedley, Dawson, Comstock, Donovan, Sherrill, Cook and Ehleringer1991; Dawson et al., Reference Dawson, Mambelli, Plamboeck, Templer and Tu2002). Given the variety of factors influencing isotopic discrimination, it is difficult to isolate a single factor influencing the variability of plant samples. Many of the environmental factors which influence the attractiveness of different plant parts to herbivores (Orians & Jones, Reference Orians and Jones2001; Orians et al., Reference Orians, Ardon and Mohammad2002) also influence isotopic heterogeneity. For example, the shading of individual leaves can alter δ13C (Le Roux et al., Reference Le Roux, Bariac, Sinoquet, Genty, Piel, Mariotti, Girardin and Richard2001) and can also alter nitrogen content and the amount of secondary plant compounds, making them more appealing to herbivorous insects (Nichols-Orians, Reference Nichols-Orians1991; Crone & Jones, Reference Crone and Jones1999). Future studies should take into account isotopic variability both within plants and within populations, as they may be related to which plant parts are actually consumed. The investigation of such possibilities may reduce the variability of results often found in stable isotope ecology.
Greenhouse cage trials
The greenhouse cage trials showed some success in showing changes in diet composition, though the methods were not as direct as initially intended. Our inability to distinguish between diet sources makes the use of a diet mixing model problematic (Newsome et al., Reference Newsome, Martinez del Rio, Bearhop and Phillips2007) and thus requires alternative evidence for the determination of diet changes. Though it may be inappropriate for the determination of niche breadth (Matthews & Mazumder, Reference Matthews and Mazumder2004), the use of variation in isotopic signature for determining the degree of omnivory may still be applicable in a very qualitative sense (Bearhop et al., Reference Bearhop, Adams, Waldron, Fuller and Macleod2004). The negative correlation of both δ13C and δ15N with time suggest that some change was occurring within the cages (figs 6 and 7). One interpretation of these data is that the diet of D. hesperus was changing over time. This is supported by declining prey populations over this period (fig. 5). However, the signatures of prey were found to be indistinct from plant samples during feeding trials. Thus, these changes in isotopic signature cannot be definitively related to changes in the amount of prey in the diet.
It is also possible that the isotopic signatures of the plants were declining over time due to other factors, including changes in environmental conditions. Temperature and plant age can affect plant physiology and thus isotopic composition (Handley & Scrimgeour, Reference Handley and Scrimgeour1997; Dawson et al., Reference Dawson, Mambelli, Plamboeck, Templer and Tu2002). Temperatures within the greenhouse varied over the summer, with both the mean temperature and the maximum daily temperature declining over the course of the experiment (fig. 9), potentially affecting the δ13C and δ15N of the plants. Also, the plants matured over the course of the experiment, which may be another source of isotopic variation. Given the variability of the isotopic signature found within plant tissues, we are unable to attribute the decline in isotopic enrichment with any one factor.
Though it is likely that the physiological condition of the plants contributed to the decrease of δ13C and δ15N over time for D. hesperus, the concurrent decline in the range of δ13C values suggests the occurrence of some other process (fig. 8). This decrease in δ13C variation over time may be related to changes in the proportion of individuals feeding upon different plant types. As prey decline, D. hesperus is expected to increase feeding on mullein, a preferred plant within the diet (Sanchez et al., Reference Sanchez, Gillespie and McGregor2003). At week 12, D. hesperus was only slightly enriched relative to the tomato leaves when considering δ15N, but showed greater enrichment in δ13C. Though not significant, mullein leaves were enriched relative to tomato leaves during feeding trials. This δ13C enrichment relative to the tomato leaves at the end of the trial may be due to D. hesperus feeding on mullein leaves. The decline in prey availability, coupled with an increased proportion of D. hesperus individuals feeding on mullein, suggests that omnivory did decline as prey became less available. It is still possible that the carbon enrichment seen in D. hesperus is due to the incorporation of tomato leaves from earlier in the trial, but previous research suggests that carbon shifts are relatively rapid (Ostrom et al., Reference Ostrom, ColungaGarcia and Gage1997). However, due to an absence of isotopic data for mullein leaves from the cage trials, this remains conjecture.
The variability in signatures within each cage at any given sampling date should reflect variability in diet choice within the population. Variability in δ15N did not change over time, suggesting that there are differences in diet choice within the population that are independent of the amount of prey available. These differences may be due to individual preferences, age structure, size structure or sex, though we cannot differentiate among them. Age-related differences should be minimal as all individuals sampled were reproductive adults, and size explained a very small proportion of the variability (unpublished data). However, differences related to sex and individual preference were unaccounted for.
Summary
We were unable to detect changes in the degree of omnivory for D. hesperus. This was due to both the variability within sources and the isotopic similarity of these sources. However, we were able to detect shifts in plant feeding from tomato to mullein. Our results also suggest that there is some component of variation in the diet content of D. hesperus individuals that remains independent of prey abundance. The variability found within diet sources underscores the idea that the variability of diet sources needs to be quantified to use stable isotope analysis in a quantitative fashion (Newsome et al., Reference Newsome, Martinez del Rio, Bearhop and Phillips2007). This variation likely reflects differences in the physiological condition of plant tissues that is not explicitly considered in insect isotope studies (e.g. Spence & Rosenheim, Reference Spence and Rosenheim2005) but may warrant future consideration. Thus, given our current understanding of stable isotope ecology, we cannot directly detect changes in omnivory or intraguild predation for biological control agents feeding on phloem feeding insects and their parasitoids. This precludes the application of this technique to the evaluation of numerous biological systems, though it may be applicable in cases where the pests feed upon leaf tissue.
Other diet quantification techniques may be more appropriate, but we were unable to use them in this particular instance. Dicyphus hesperus uses extra-oral digestion, which makes classic gut content analysis intractable. However, molecular approaches may be more feasible, though it is unknown what effects extra-oral digestion has on DNA degradation. If this technique is to be used, these effects need to be quantified first, as DNA quality can have a significant effect on the utility of molecular gut content analysis (King et al., Reference King, Read, Traugott and Symondson2008). The applicability of any of these techniques will require the researcher to first understand the requirements and assumptions of the technique prior to application.
Acknowledgements
We thank the greenhouse and entomology staff at the Greenhouse and Processing Crops Research Centre for logistic support, especially M. Pachal, as well as the staff at the University of Windsor stable isotope lab for their assistance. This research was funded through the NSERC network grant ‘Biocontrol Network’, with support from Agriculture and Agri-Food Canada, the British Columbia Greenhouse Vegetable Growers Association, Koppert Biological Systems and the University of Windsor. J.A. Bennett was supported by an Ontario Graduate Scholarship.