I. INTRODUCTION
Nowadays, with the rapid development of wireless communication, electronic instrument and military affairs, electromagnetic interference, and pollution have become a very serious issue both in military and civil fields. High-performance microwave absorption (MA) materials with broadband MA ability are highly demanded and those with low density and thin thickness are much more favored to eliminate adverse electromagnetic waves effectively.Reference Zhang, Huang, Zhang, Chang, Xiao, Chen, Huang and Chen1,Reference Yang, Lv and Wu2 With the advantages of high dielectric loss, controllable crystal structure and rich resources in natural manganese oxide used as microwave absorbent attract more and more attention. Manganese oxide fabricated on a nanoscale exhibits better microwave absorbing properties than bulk materials.Reference Baykal, Köseoğlu and Şenel3–Reference Jothi, Pramanik, Li, Kannan, Malgras, Salunkhe and Yamauchi9 The conventional high-temperature calcination preparation method for Mn3O4 is uneconomic and easily resulted in aggregation and phase transformation. Therefore, controllable synthesis of Mn3O4 nanomaterials in low temperature is needed.Reference Jothi, Pramanik, Li, Kannan, Malgras, Salunkhe and Yamauchi9–Reference Kharade, Chavan, Mane, Joshi and Salunkhe12 However, the high density and low surface area per unit mass severely inhibit its future applications, for microwave absorbing materials with lightweight, sound and flexible microstructure, and strong absorption in a wideband range, which are in high demand nowadays.Reference Yan, Cheng, Zhuo, Chen, Feng, Feng, Li, Wu, Wang and Yan13 To overcome these drawbacks, attention has been focused on composite materials.Reference Wang, Jia, Li, Yang, Zhang, Liu, Ren and Yang14,Reference Sun, Che, You, Jiang, Yang, Deng, Qiu and Peng15
Carbon-based composites working as microwave absorbing materials have gained significant popularity because of their low density, facile synthesis, ease of processing, special structures, and remarkable electrical properties. Graphene, a two-dimensional (2D) single layer composing of carbon atoms, is the basic building block for graphitic materials of all other dimensionalities. It is also an excellent matrix candidate supporting for the growth of varieties of functional substances to form new single and few-layer graphene-based composites which are considered as the effective microwave absorber.Reference Hu, Mou, Lu, Chen, Dong, Hu and Qu16–Reference Zhou, Huang, Qi, Wu, Xue, Boey, Yan, Chen and Zhang19 Compared with traditional metal oxide materials, graphene-based materials with low density and high complex permittivity, more defects deriving from dangling bonds and surface restacking ensure its excellent dielectric property.Reference Wang, Gao, Li, Mosa, Zimmerman, Ma, Harris and Migliaccio6,Reference Xu, Bi and Yang20–Reference Yang, Liu, Hui and Chipara24
In recent years, different precipitation approaches for Mn3O4 based on hydrothermal or solvothermal methods have been reported. It makes the synthesis possible at a far lower temperature than calcination.Reference Han, Chen, Zhong, Ramesh, Chen and Widjaja11 Ahmed et al. have obtained Mn3O4 with different weight percentages on graphene sheet via the hydrothermal method at 180 °C for 10 h. The Mn3O4 particles with the diameter of 10–20 nm grow from the surface of graphene sheets and its photodegradation of methylene blue dye under visible light illumination and microwave is researched.Reference Amer, Reda, Mousa and Mohamed25 Yuting Long et al. have synthesized jellylike cylinder graphene–Mn3O4 nanoparticles with average particle sizes of ∼60 nm through the solvothermal method at 180 °C for 10 h. The composites exhibit a minimum reflection loss (RL) of −14.2 dB in the frequency range of 2–18 GHz.Reference Long, Xie, Li, Liu and Xie26 Wang et al. have obtained the Mn3O4–RGO nanocomposites with good microwave shielding performance through a one-step hydrothermal method at 180 °C for 18 h. The dielectric loss performance and electromagnetic interference shielding effectiveness reach 20 dB in the frequency range of 2–18 GHz, which are improved a lot as compared with the pure Mn3O4 nanoparticles.Reference Wang, Guan, Dong, Xiao, Du and Wang27 In the research of Wang and coworkers, the Mn3O4–graphene nanocomposite membranes are rationally synthesized via a simple hydrothermal process with excellent mechanical flexibility and Li-ion storage properties which are explored as a free-standing anode for Li-ion batteries. The Mn3O4 nanocomposites are composed of graphene nanosheets and long uniform Mn3O4 nanowires with the length ranging from several tens to hundreds of micrometers.Reference Wang, Jin, Zhou, Li, Liu, Shen, Xie, Li, Kang and Wei28 However, the dependency of microwave absorbing performance on the reaction time and temperature for Mn3O4–graphene hybrid have rarely been reported.
Herein, we report on the fabrication of Mn3O4–graphene nanocomposites under the temperature lower than 200 °C via a hydrothermal chemical reaction between potassium permanganate and graphene without using any templates. The effects of reaction time and temperature on grain orientation and the microwave absorbing properties of the nanocomposite are studied, and the formation and microwave loss mechanisms are also discussed. To the best of our knowledge, this kind of research was rarely reported previously for manganese oxide and graphene nanocomposite.
II. EXPERIMENTAL SECTION
A. Preparation and synthesis of Mn3O4–graphene
All the chemicals contained in the synthesis process are of analytical grade and used without further purification. The required amounts of hydrochloric acid are injected into a beaker loaded with 2.3 g graphene to remove trace impurities and add functional groups on the surface, followed by magnetic stirring for 30 min. Then the mixture is sonicated in an ultrasonic bath for 2 h. Then the graphene suspension solution is obtained which is then washed with deionized water and ethanol several times until pH approaching approximately 7, and dried in a vacuum oven at 60 °C for 10 h to obtain activated graphene.
Typically, 0.2 g activated graphene is dissolved in 20 mL distilled water and sonicated for 2 h. 0.4 g KMnO4 is added into the solution with vigorously stirring for 6 h at room temperature. Subsequently, the solution is transferred into a Teflon-lined stainless steel autoclave and heated for several hours, then cooled down to room temperature naturally. Finally, the obtained precipitate is filtered off, washed with distilled water and absolute ethyl alcohol several times until most of the soluble ions are removed from the final product, and finally dried at 60 °C for 12 h.
To study the crystal growth mechanism and evolution process, synthesis experiments at different reaction times and temperatures are performed with all the other reaction conditions unchanged. In the time-dependent experiment, the autoclave is heated to 140 °C and kept for 2, 4, 6, and 11 h, while in the temperature-dependent experiment, the autoclave is kept heating for 6 h in 170, 200, 140, and 110 °C.
B. Materials characterization
The crystal structure of the samples is examined using X-ray powder diffraction (XRD-6000, SHIMADZU, Tokyo, Japan) with Cu Kα radiation, using an operating voltage and current of 40.0 kV and 30.0 mA, respectively. The scanning range is from the degree of 10.00°–80.00° (2θ) and the scan speed is 2.00°/min. The images of samples are taken by using a transmission electron microscope (TEM; Tecnai G220 S-Twin, Hillsboro, Oregon), and a scanning electron microscope (SEM; NOVA NANOSEM 430, FEI, Hillsboro, Oregon). Raman spectra are recorded on a laser Raman spectroscope (Invia, RENISHAW Agilent Technologies, Santa Clara, California) using a 514 nm argon ion laser.
C. Electromagnetic performance measurement
An Agilent 8722ES vector network analyzer is used to measure relative complex permittivity and permeability by the coaxial reflection/transmission method with the working frequency at 2–18 GHz. The cylindrical sample (with an outer diameter of 7 mm, the inner diameter of 3 mm, and the thickness of 2 mm) is fabricated by uniformly mixing the paraffin matrix with 30 wt% absorbents, and then the composite is pressed into cylindrical compacts. The transmission line theory is used to compute the wave-absorbing properties, which is designated as RL.
III. RESULTS AND DISCUSSION
A. Material phase analysis
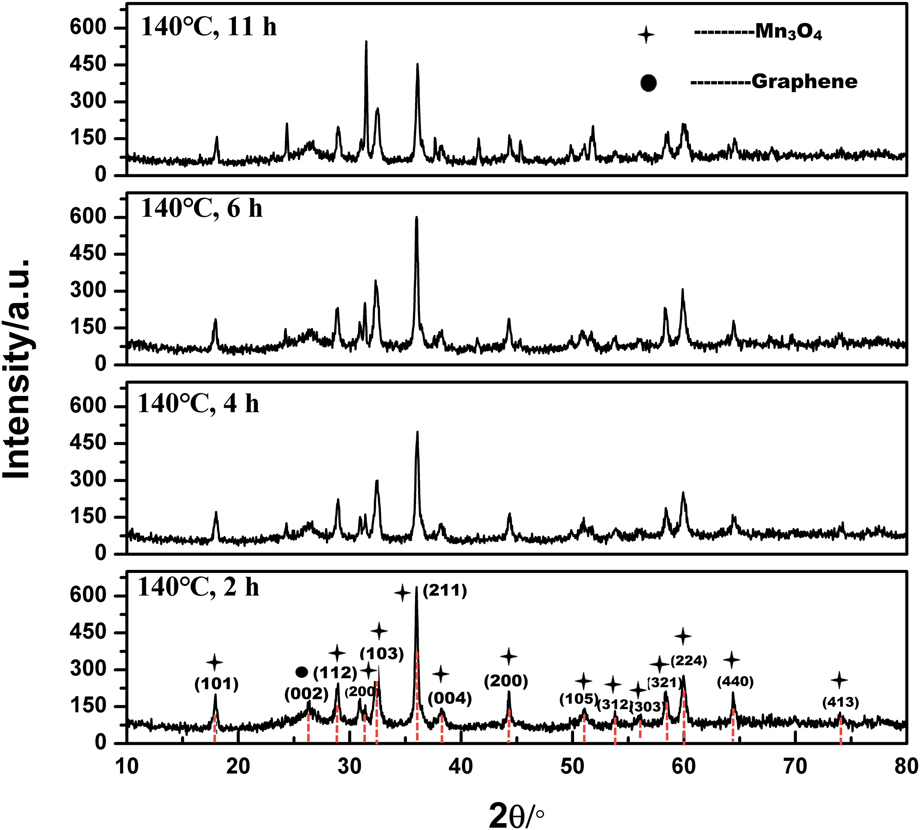
The crystalline phases of the as-prepared product are determined by X-ray diffraction (XRD). The patterns are shown in Fig. 1. All the peaks in these samples can be exactly indexed as graphene and Mn3O4 with tetragonal structure (hausmannite, PDF: 24-0734) with lattice constants a = 5.746 Å and c = 9.463 Å.Reference Silva, Almeida, Ferreira and Ciminelli29 This also indicates the as-prepared product Mn3O4–graphene with high purity and good crystallinity. As shown in Fig. 1, the peak at 2θ around 24° with a relatively low intensity originates from graphene. The intensity of the peaks (006) and (200) increases along with the increasing reaction time, which indicates that the reaction time and temperature make changes on grain size which may have an effect on its properties. Many research shows that a high temperature above 500 °C is needed to convert MnOx species to Mn3O4.Reference Baykal, Köseoğlu and Şenel3,Reference Han, Chen, Zhong, Ramesh, Chen and Widjaja11,Reference An, Yu, Xiao, Liu, Miao, Ding and Mao30,Reference Vázquez-Olmos, Redón, Rodríguez-Gattorno, Mata-Zamora, Morales-Leal, Fernández-Osorio and Saniger31 This manifests that the hydrothermal method is beneficial for the formation of Mn3O4.Reference Baykal, Köseoğlu and Şenel3
XRD pattern of Mn3O4–graphene composites prepared at 140 °C for different reaction times.

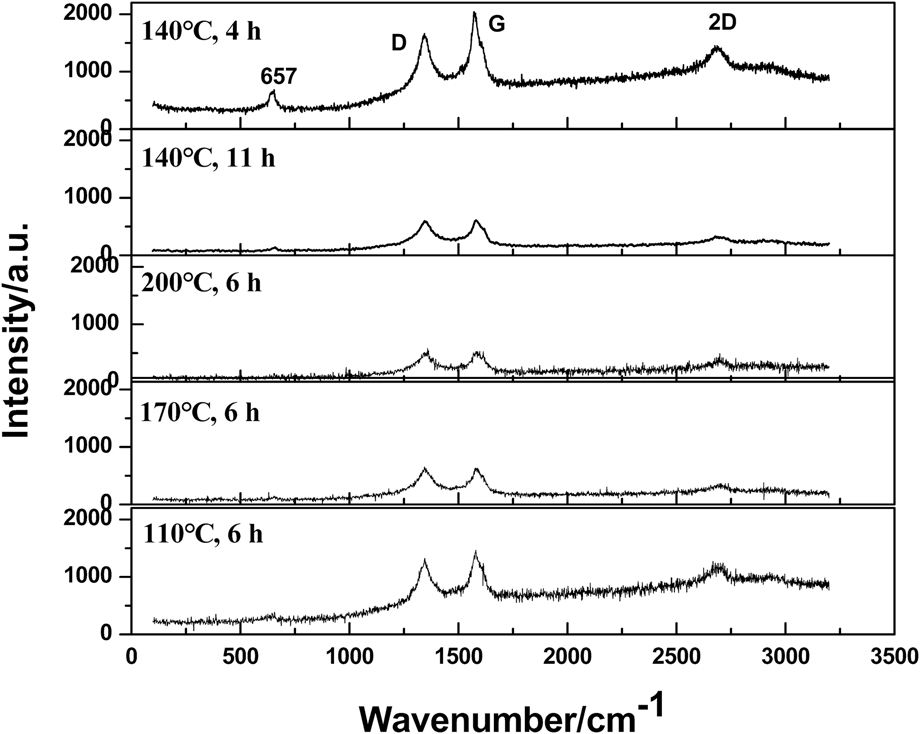
To further confirm the structural information, Raman spectra are recorded (Fig. 2). It is clearly observed that the scattering peak at 652 cm−1 belongs to the Mn–O vibration modes in the crystalline hausmannite Mn3O4 which belongs to the D19 4 h space group.Reference Cong, Ren, Wang and Yu32–Reference Fan, Yan, Wei, Zhi, Ning, Li and Wei34 This peak is a characteristic for all the spinel structures. In addition, three dominated characteristic peaks of graphene are observed. The sharp peaks located at 1345, 1573, and 2683 cm−1 are associated with D originating from disordered carbon and the G band corresponding to sp 2 hybridized carbon and 2D band, respectively.Reference Ma, Tao, Yang, Feng, Cheng, Shi, Li, Guo and Liu21,Reference Fan, Yan, Wei, Zhi, Ning, Li and Wei34,Reference Li, Hu, Yang, Liang, Lu, Xu, Hu and Wu35 It can also be seen that the intensity of diffraction peaks for Mn3O4 is weak, which demonstrates that it has a small content in the composite. For the sample in 110 °C for 6 h and 140 °C for 4 h, the ID/IG intensity ratio is lower than others’ which indicates that less defects or disorder of the structures is introduced into the sp 2 carbon.Reference Li, Hu, Yang, Liang, Lu, Xu, Hu and Wu35
Raman spectrum of Mn3O4–graphene composites.

B. Morphology analysis
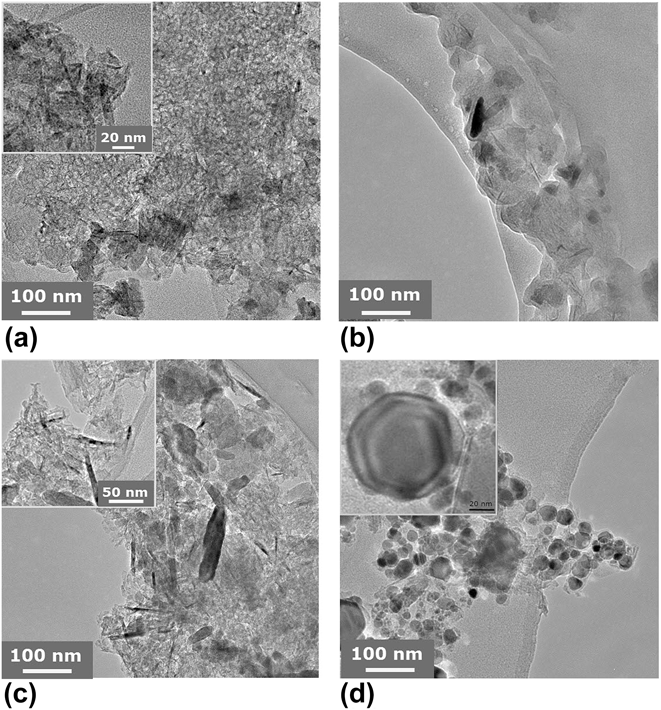
The morphology and structure of the nanocomposites are characterized by TEM. As shown in Figs. 3(a)–3(c), Mn3O4 grows uniformly on the surface of graphene. As a support material, graphene could supply large numbers of active sites for nucleation of Mn3O4 that results in the good distribution of Mn3O4 flakes on the graphene sheets. It is obvious to see that the product is composed of heterogeneous particles which are mainly in two forms of morphologies: nanoflakes and nanostrips. The flakes are in irregular shape and their size changes from 10 to 200 nm. The length of the nanorods ranges from 10 to 100 nm and the diameter of them varies widely. As shown in Fig. 4(a), for the sample synthesized in 110 °C for 6 h, the structure of Mn3O4 is homogeneous, and the particles dispersed uniformly on the surface of the graphene sheet. While for the sample synthesized in 200 °C for 6 h in Fig. 4(d), the graphene sheet is broken into many hexagon spots with a different size, which indicates that the temperature at 200 °C is too high for graphene to keep its primary sheet structure. For samples in Figs. 4(b) and 4(c), Mn3O4 particles present in the big size of strips, varying sizes of flakes, and a small number of needles.
TEM images of the Mn3O4–graphene composite synthesized in (a) 110 °C; (b) 140 °C; (c) 170 °C; (d) 200 °C for 6 h.

TEM images of the Mn3O4–graphene composite synthesized in 140 °C for different reaction times. (a) 11 h; (b) 6 h; (c) 4 h; (d) 2 h.

For time-dependent samples in Fig. 4, it shows that the particles of Mn3O4 successfully adhere on the graphene sheet. While as the reaction time increases, the size of Mn3O4 flakes grows obviously. The particle size of samples obtained from reactions for 11 and 6 h is obviously larger than that of 2 and 4 h. In addition, the graphene sheet tends to be cut into small pieces in that of 11 and 6 h, which reveals to keep the completeness of the graphene sheet, and the reaction time should not be long.
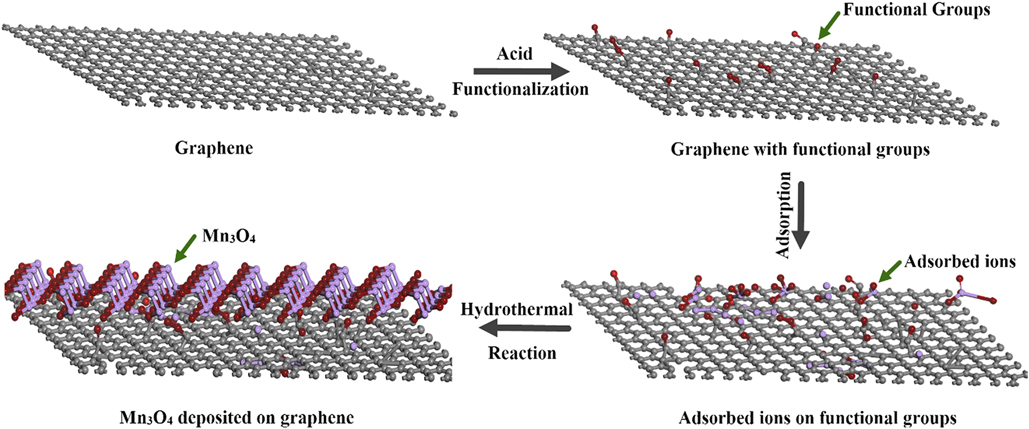
There are mainly two interactions leading to the formation of Mn3O4–graphene composite: the electrostatic repulsion and Van der Waals interaction. In the process of reaction, the Mn3O4 particles can disperse on the surface of the graphene when the electrostatic repulsion dominant. Before the reaction, graphene is pretreated by hydrochloric acid which can put function groups such as hydroxy and carboxyl on the surface. Mn2+ is adsorbed onto the graphene after the addition of manganese chloride to the solution containing functionalized graphene because of the electrostatic interactions between the functional groups and manganese ions. These groups act as sets of nucleation for Mn3O4 that makes the uniform dispersion of Mn3O4 possible on the surface of grapheneReference Lee, Jeong, Kang, Kim and Kim36 During the hydrothermal process, nanoparticles form via the following. The formation mechanisms of Mn3O4 can be described as follows:
 $${\rm{MnC}}{{\rm{l}}_2} \cdot 4{{\rm{H}}_2}{\rm{O}} \to {\rm{Mn}}{\left( {{\rm{OH}}} \right)_2}\quad ,$$
 $${\rm{Mn}}{\left( {{\rm{OH}}} \right)_2} \to {\rm{MnO}}\quad ,$$
 $${\rm{MnO}} + {{\rm{O}}_2} \to {\rm{Mn}}{{\rm{O}}_2}\quad ,$$
 $$2{\rm{MnO}} + {\rm{Mn}}{{\rm{O}}_2} \to {\rm{M}}{{\rm{n}}_3}{{\rm{O}}_4}\quad .$$
In the hydrothermal condition, MnO is the intermediate product and unstable, a portion of which is easy to be oxidized to form MnO2, and the rest is combine with MnO2 to form Mn3O4. The process of the entire synthesis process is shown in Fig. 5.
Schematic of synthesis of Mn3O4–graphene nanocomposites.
C. Electromagnetic property measurements
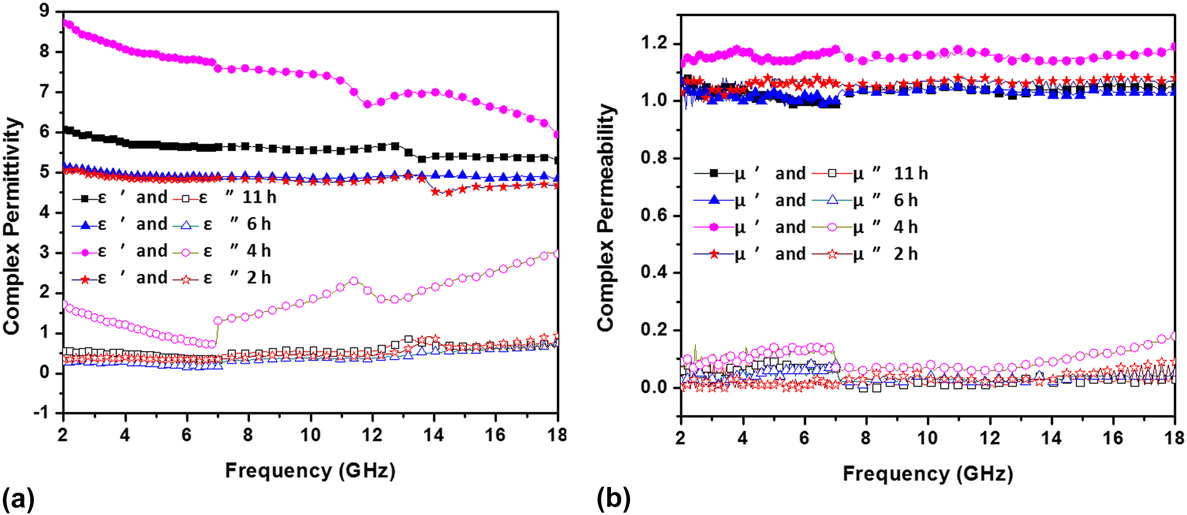
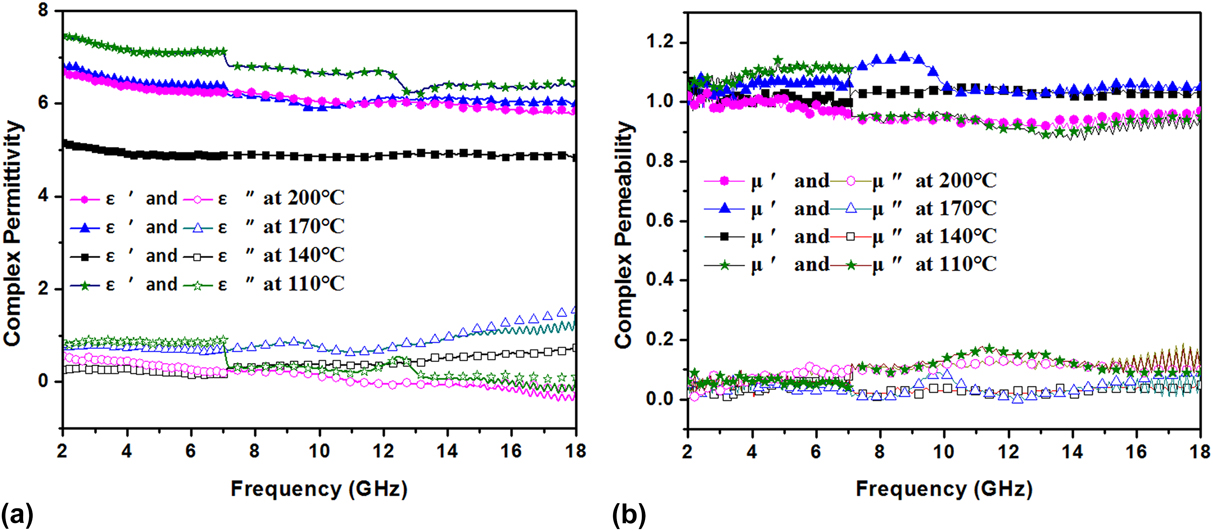
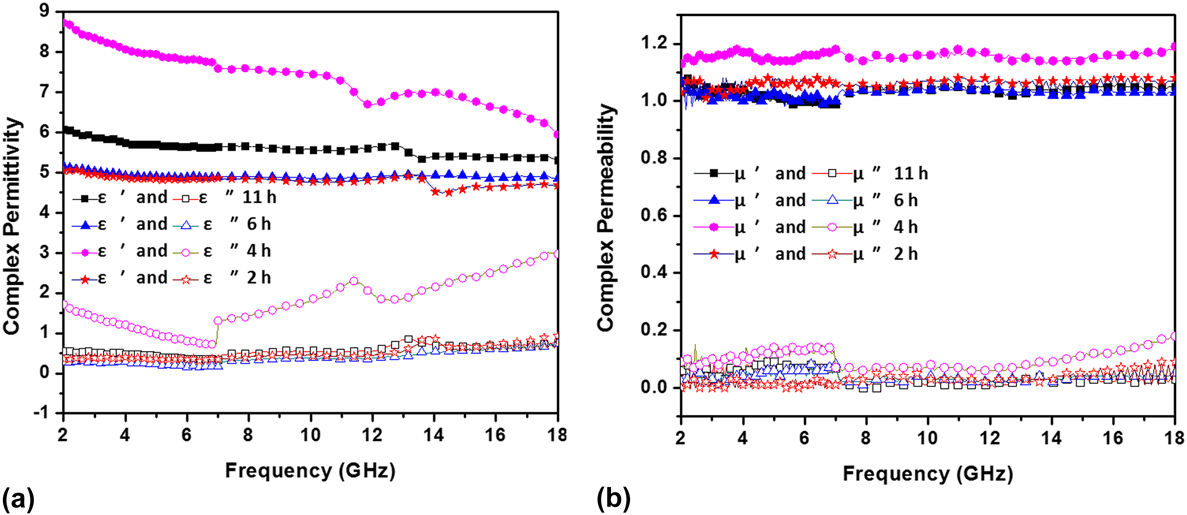
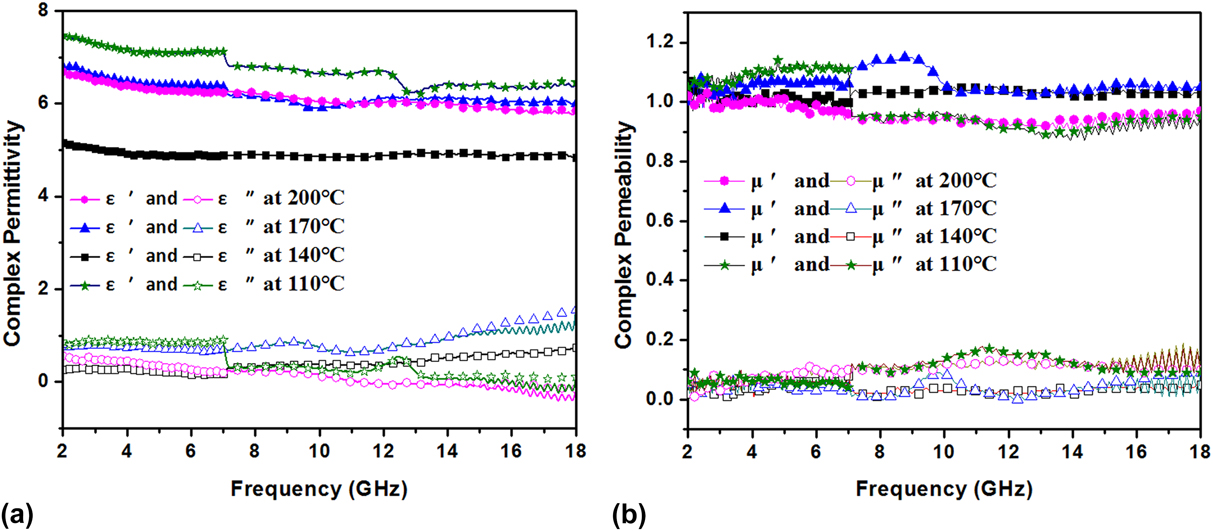
The microwave absorbing properties can be evaluated by their intrinsic properties, such as the complex permittivity and permeability which represent the dielectric and magnetic properties of materials, respectively. Figures 6 and 7 show the complex permittivity (ε′ and ε″) and permeability (μ′ and μ″) in the frequency range of 2–18 GHz for samples at time-dependent and temperature-dependent experiments, respectively. The real (ε′ and μ′) and imaginary part (ε″ and μ″) can be used to evaluate the energy stored and dissipated by the absorber, respectively. The energy storage results from the electronic and dipole displacement polarization are caused by electromagnetic field, and the energy dissipation is caused by the irreversible electronic and molecule relaxation polarization. All the polarization mentioned above is known as dielectric polarization. When the microwaves impinge on the surface of materials, a portion of them are dissipated through electric and dipole relaxation polarization and the others are stored through displacement polarization. Therefore, to improve the microwave absorbing properties, the energy consumption (imaginary part) should be increased and the nonlossy components (real part) should be decreased.
(a) Complex permittivity and (b) permeability of the Mn3O4–graphene wax composites in the time-dependent experiment.
(a) Complex permittivity and (b) permeability of the Mn3O4–graphene wax composites in the temperature-dependent experiment.
As shown in Fig. 6(a), for the samples synthesized in 140 °C for 11, 6, and 2 h, their complex permittivity almost kept constant in the range of 2–18 GHz. For the sample in 140 °C for 4 h, its real part of permittivity decreasing from 9 to 6.75 along with the increasing frequency which is higher than that of the other three. Its imaginary part of permittivity fluctuates between 1 and 3 which is also higher than that of others. As shown in Fig. 6(b), all four samples have a relatively constant complex permeability in this frequency range. The samples in 140 °C for 4 h shows a higher complex permeability than that of the other three whose real and imaginary part are around 1.2 and 0.1, respectively.
Figure 7(a) shows the frequency dependence of the real part (ε′) and the imaginary part (ε″) of the relative permittivity of the composites synthesized in different temperatures for 6 h in the frequency range of 2–18 GHz. The real part of the permittivity of all these four samples has a slight decrease in the whole frequency range. On the whole, the sample in 110 °C for 6 h has a higher complex permittivity than that of the other three. The imaginary part for the samples in 140 and 170 °C increases along with the increasing frequency, while that of the samples in 200 and 110 °C shows a slight decrease. Figure 7(b) shows the real part (μ′) and the imaginary part (μ″) of the relative permeability in the temperature-dependent experiments which varies from 0.95 to 1.15 and 0 to 0.17. While the real and imaginary parts of permittivity vary from 4.8 to 7.8 and 0 to 1.8, respectively, which are much higher than the values of the permeability. This indicates that the Mn3O4–graphene composite is the dielectric dominated material.
When the microwave is incident on the absorber, they could be reflected by the surface of the sample. To improve the microwave absorbing properties, both reflection and incident dissipation should be taken into consideration. Hence, the absorbing properties are investigated further by analyzing the RL.
D. Reflection loss
To further confirm the dependence of the MA properties of the permittivity and the permeability, the RL is calculated according to the transmission line theory. Calculation formulae are shown as followsReference Liu, Cui, Wu, Li and Tong37–Reference Alam, Moradi and Nikmanesh41:
 $${\rm{RL}} = 20\log \left| {{{{Z_{{\rm{in}}}} - {Z_0}} \over {{Z_{{\rm{in}}}} + {Z_0}}}} \right|\quad ,$$
 $${Z_{{\rm{in}}}} = \sqrt {{{{\mu _{\rm{r}}}} \over {{\varepsilon _{\rm{r}}}}}} \tanh \left[ {j{{2\pi } \over c}\sqrt {{\mu _{\rm{r}}}{\varepsilon _{\rm{r}}}} fd} \right]\quad ,$$
where μr and εr are the relative permeability and permittivity of the composite medium, respectively, c is the velocity of electromagnetic waves in free space, f is the frequency of the microwave, d is the thickness of the absorber,  ${Z_0} = \sqrt {{{{\mu _0}} / {{\varepsilon _0}}}}$ is the impedance of free space, and Z in is the input impedance of the absorber.Reference Li, Wu, Jin, Qian, Qian, Jiang, Wu and Tong42–Reference Wang, Wan, Zhang, Chen, Hu, Liu, Zhong and Deng45
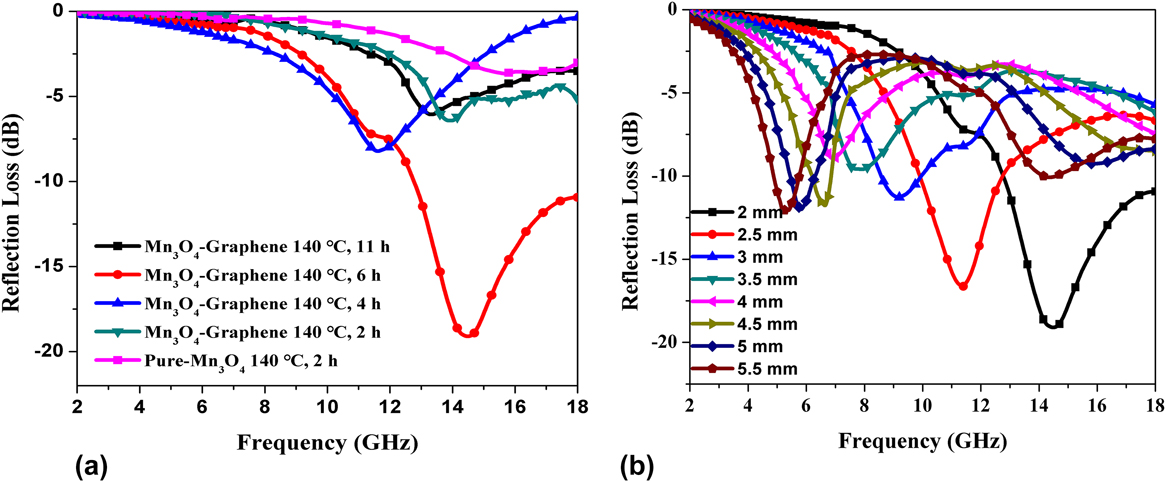
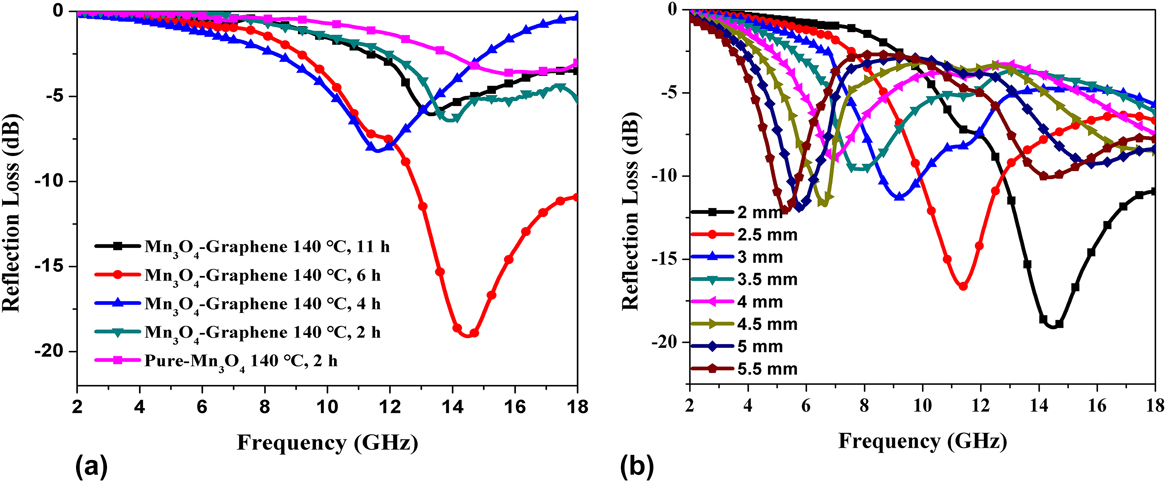
Figure 8(a) shows the RL of the Mn3O4–graphene and pure Mn3O4 with the 70% (wt%) paraffin wax composite in the thickness of 2 mm in time-dependent experiments. It is clear to see that the sample synthesized in 140 °C for 4 h shows the highest RL among these five samples which reach −20 dB at 14.2 GHz and the effective absorption bandwidth with RL < −10 dB (90% absorption) is more than 5 GHz. While the pure Mn3O4 synthesized in 140 °C for 2 h shows the lowest RL which minimum value is around −4.3 dB. Figure 8(b) shows the RL for the sample in 140 °C for 4 h in different thicknesses. As functions of frequency and thickness, the RL peaks shift to low frequency along with the increased thickness of the absorber. By tuning the thickness of the absorber, the effective absorption frequency and RL can be controllable.
RL curves of the sample-paraffin wax composites (a) in the time-dependent experiment with the thickness of 2 mm and (b) in different thickness at 140 °C for 6 h.
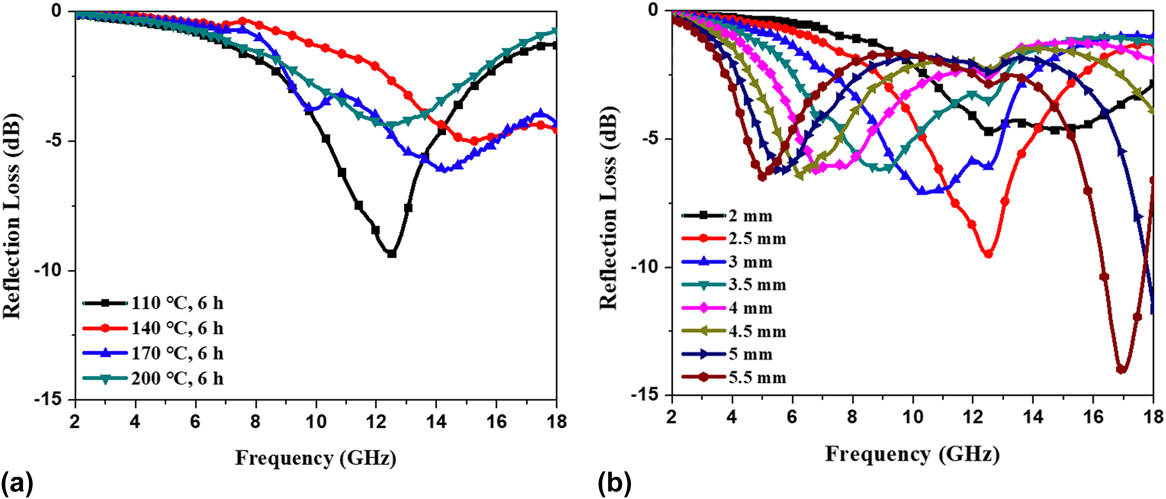
In Fig. 9(a), at the thickness of 2.5 mm, the RL of the sample in the temperature-dependent experiment occurs in the frequencies ranging from 2 to 18 GHz. This shows that the minimum RL of Mn3O4–graphene is −10.4 dB at 12.8 GHz for the sample synthesized at 110 °C for 6 h. Figure 9(b) shows the RL determined in the above sample with different thicknesses. By increasing the thickness from 2 to 5.5 mm, the absorption peaks move to higher frequency (from 15 to 4.5 GHz). The sample also shows two peaks at 4.2 and 17.2 GHz for the absorber with the thickness of 5.5 mm. The maximum absorption (−14.9 dB) was at 17.2 GHz when the thickness reaches 5.5 mm, the second place is −13 dB with the thickness of 5 mm. The analysis results above indicate that controllable wave-absorbing properties with the RL peak at a preferred frequency range can be realized by adjusting the thickness.
RL curves of the sample-paraffin wax composites (a) in the temperature-dependent experiment and with the thickness of 2.5 mm (b) in different thicknesses at 110 °C for 6 h.
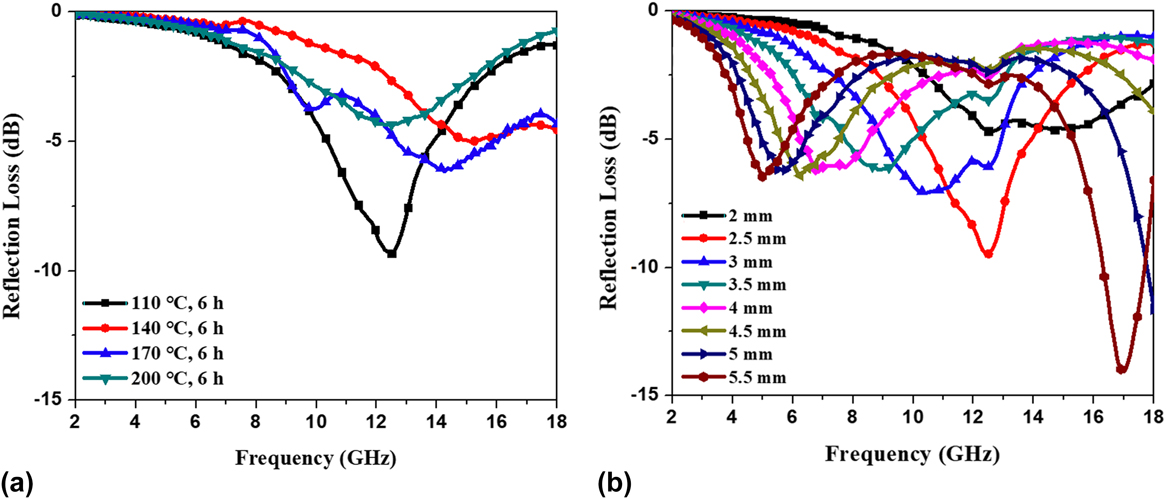
As mentioned above, to increase MA, both impedance matching and microwave attenuation should be taken into consideration. Various reaction temperatures and times can change the morphology of the product which is shown in Figs. 3 and 4 where the samples obtained in 140 °C for 4 h and 110 °C for 6 h have more uniform distribution and smaller particle size than others in these two groups of experiments. This contributes a lot to interfacial polarization, as well as nanometer effect which is another important factor intensifying the dielectric polarization. Interfacial polarization and related relaxation polarization usually exist in a heterogenous mixture which are mixed with more than two different compounds and can be affected by the morphology and surface area. The addition of CNT to Mn3O4 generates a large number of interface which contributes a lot to the interface polarization and thus the dielectric loss. Besides that, the decrease of particle size can increase the dipole to the nanoscale.Reference Xiang, Zhang, Ye, Li and Shen46 Although Mn3O4–graphene is dielectric dominated materials, magnetic loss is also observed in Figs. 6(b) and 7(b). Magnetic losses occur primarily due to eddy current effect induced by electromagnetic field. In addition, natural resonance at the nanometer scale is another important mechanism contributing to magnetic loss. All the above factors result in higher permittivity for the samples synthesized in 140 °C for 4 h and 110 °C for 6 h than others which are shown in Figs. 6 and 7. For RL, the most important factor is impedance matching. The sample with a lower complex permittivity and higher complex permeability than others can show higher RL. While in practical situations, it can be difficult to meet both requirements simultaneously, necessitating a compromise.
IV. CONCLUSION
The Mn3O4–graphene composite is synthesized by a simple hydrothermal method at a low temperature which means that the hydrothermal method is beneficial for the formation of Mn3O4. From the two sets of experiments, it is easy to conclude that high temperature up to 200 °C can destroy the microstructure of graphene which leads to the degradation of the absorbing performance. In addition, a long reaction time of 6 h can increase the size of the Mn3O4 particle, which also leads to some adverse effects on absorbing performance. The Mn3O4–graphene composite synthesized in 140 °C for 4 h shows most RL with the value below −20 dB, as well as an effective absorption bandwidth of more than 5 dB corresponding to RL below −10 dB in time-dependent experiment with the thickness of 2 mm. In the temperature-dependent experiment, the maximum absorption reach −14.9 dB at 17.2 GHz when the thickness is 5.5 mm for the sample prepared in 110 °C for 6 h. Interfacial polarization, relaxation polarization, and nanometer effect are the main loss mechanisms for the Mn3O4–graphene composite. Besides, magnetic loss including eddy current effect induced by electromagnetic field and natural resonance at the nanometer scale also contribute to the energy loss.
ACKNOWLEDGMENTS
The work is supported by Program for the National Natural Science Foundation of China (No. 51577021) and the Fundamental Research Funds for the Central Universities (DUT17GF107). The authors also acknowledge support from Dr. Ishwar K. Puri and Dr. Rakesh P. Sahu in McMaster University.