





Metabolic dysfunction-associated steatotic liver disease (MASLD) is characterised by excessive TAG accumulation in the liver in the presence of at least one cardiometabolic risk factor and in the absence of significant alcohol consumption(1). It is estimated that it affects approximately 10 % of children and 25 % of adults worldwide(Reference Dai, Liu and Zhang2). The pathogenesis of MASLD, the most common chronic liver disease worldwide, has not been fully elucidated(Reference Lindqvist, Holmer and Hagström3,Reference Wang, Bian and Wan4) . Insulin resistance is thought to be a key factor in the pathogenesis of MASLD by promoting hepatic lipid flux and excessive production of reactive oxygen species(Reference Asghari, Rezaei and Rafraf5,Reference Poonyam, Kritsanaviparkporn and Chommaitree6) . However, nutritional factors, gut microbiota and genetic predisposition are also thought to contribute to disease pathogenesis(Reference Del Bo’, Perna and Allehdan7,Reference Montemayor, Bouzas and Mascaró8) .
Given its increasing prevalence and associated complications, MASLD has become a global health issue(Reference Schepp, Freuer and Wawro9). Lifestyle changes involving healthy eating, physical activity and weight loss are cornerstones of MASLD treatment(Reference Pan, Sui and Xu10). As MASLD is closely associated with obesity, it has been reported that a ≥5 % reduction in body weight is associated with improvement in steatosis(1). Nutrition is an important modifiable risk factor in the development of MASLD(Reference Schepp, Freuer and Wawro9). However, studies have generally focused on reducing energy intake(Reference Asghari, Rezaei and Rafraf5,Reference Ezpeleta, Gabel and Cienfuegos11) , and the role of eating habits and the nutrient content of the diet in disease pathogenesis remains unclear(Reference Schepp, Freuer and Wawro9). The relationship between nutrition and MASLD is too complex to be simplified to energy intake or weight loss(Reference Riazi, Raman and Taylor12). A study found that an average weight loss of 5 % achieved through a low-energy diet did not result in a significant improvement in the degree of hepatosteatosis in MASLD patients, even though their intake of antioxidant vitamins and minerals remained unchanged(Reference Asghari, Rezaei and Rafraf5). In a study conducted with MASLD patients, it was found that nutraceutical supplementation (vitamin E, L-glutathione and silymarin) in addition to a hypocaloric Mediterranean diet for 3 months resulted in a significant improvement in the degree of hepatosteatosis compared with the hypocaloric Mediterranean diet alone(Reference Chiurazzi, Cacciapuoti and Di Lauro13).
These findings support the need for further research to better understand the relationship between foods, nutrients and MASLD beyond energy restriction alone(Reference Schepp, Freuer and Wawro9,Reference Pan, Sui and Xu10) . Therefore, this study aimed to investigate the association of dietary intake and eating habits with MASLD.
Methods
Participants and study design
This case–control study was conducted between March and July 2021 among individuals attending the Diet Clinic at Konya Cihanbeyli State Hospital. The case group consisted of individuals diagnosed with MASLD, while the control group included individuals without a diagnosis of MASLD. Control participants were recruited from individuals attending the same clinic for conditions such as hyperlipidaemia, insulin resistance, hypertension, obesity or general nutrition counselling and had no known liver disease. The required sample size was calculated as 104 using G*Power software based on previous studies(Reference Vahid, Hekmatdoost and Mirmajidi14), assuming an effect size of 0·72, α = 0·05 and 95 % power. A total of 111 participants were included, comprising fifty-six cases and fifty-five controls.
Eligible participants were adults aged 18–65 years who had undergone liver ultrasonography and biochemical testing within the previous month. Exclusion criteria included pregnancy or lactation; use of oral antidiabetic drugs, insulin, corticosteroids, oral contraceptives or hepatotoxic medications; diagnosis of cancer, renal disease or type 1 diabetes within the previous 5 years; history of chronic liver disease other than MASLD; significant alcohol consumption (>30 g/d for men and >20 g/d for women); serious psychiatric disorders; adherence to medically prescribed or restrictive diets (such as weight-loss or disease-specific diets) during the previous year and regular use of dietary supplements, including vitamin–mineral supplements, herbal products, probiotics or prebiotics, within the previous 4 months.
These exclusion criteria were applied to minimise potential confounding factors that could influence habitual dietary intake and metabolic parameters. In particular, individuals using oral antidiabetic medications were excluded because these medications may affect glucose levels, insulin resistance and liver-related outcomes. The flow chart of the study is presented in Figure 1. The study protocol was approved by the Ethics Committee of Gazi University (11.12.2020-E.133134). Written informed consent was obtained from all patients.
Flow diagram of the study.

Diagnosis of metabolic dysfunction-associated steatotic liver disease
Hepatic steatosis was assessed by abdominal ultrasonography performed by a radiologist. MASLD was diagnosed in individuals with hepatic steatosis, absence of significant alcohol consumption and at least one cardiometabolic risk factor, in accordance with the European Association for the Study of the Liver clinical practice guidelines(1). Cardiometabolic risk factors included overweight or obesity, dysglycaemia or type 2 diabetes, plasma TAG levels ≥150 mg/dL and HDL-cholesterol levels ≤39 mg/dL in men or ≤50 mg/dL in women. Participants in the control group had no evidence of hepatic steatosis or other known liver abnormalities.
Collection of sociodemographic and health data
Participants who agreed to participate and met the inclusion criteria were interviewed face-to-face using a structured questionnaire. Socio-demographic characteristics and health-related information were collected during these interviews.
Assessment of anthropometric measurements and body composition
Height (m), body weight (kg), waist circumference (cm) and body composition were measured at the Diet Clinic using a stadiometer, a Tanita DC-360 body composition analyser and a non-stretch measuring tape, following standard procedures(Reference Lohman, Roche and Martorell15). BMI was classified according to the WHO criteria(16). Waist circumference and waist-to-height ratio were evaluated according to the WHO classification(17) and the Ashwell classification(Reference Ashwell and Hsieh18), respectively.
Assessment of physical activity
Physical activity levels were assessed using a 24-h Physical Activity Record Form completed for one weekday and one weekend day. Participants were asked to complete the forms and return them within 10 d of the interview.
BMR was estimated using the Harris–Benedict equation(Reference Harris and Benedict19). Total energy expenditure was calculated based on the duration and intensity of recorded physical activities using gender-specific physical activity ratios(20). Physical activity level was calculated by dividing total energy expenditure by BMR. Physical activity level values of 1·40–1·69 were classified as sedentary, 1·70–1·99 as moderately active, and 2·00–2·40 as highly active(20).
Biochemical parameters
Biochemical test results obtained within 1 month prior to the interview were used in the study. The evaluated biochemical parameters included fasting glucose, insulin, total cholesterol, HDL-cholesterol, TAG, alanine aminotransferase, and aspartate aminotransferase. Participants with a homeostatic model assessment of insulin resistance value ≥2·5 were considered to have insulin resistance(Reference Ehrampoush, Nazari and Homayounfar21).
Assessment of eating habits and dietary intake
Information on participants’ eating habits, including breakfast consumption and eating speed, was collected using a structured questionnaire. Food group consumption over the previous month was assessed using an eighty-two-item FFQ based on the ‘Standard Portion Sizes and Quantities of Foods by Food Group for Türkiye’ included in the Türkiye Dietary Guidelines-2022 (TDG-2022)(22). Adherence to TDG-2022 recommendations was evaluated by comparing participants’ reported food group consumption with the age- and sex-specific recommended portion sizes(22).
Participants were also asked to complete 3-d 24-h food records, including two weekdays and one weekend day, and return them within 10 days of the interview. Dietary records were analysed using the Nutrition Information System (BeBIS) software developed for Türkiye(23), and mean daily energy and nutrient intakes were calculated.
Statistical analysis
Data normality was assessed using the Shapiro–Wilk test, and homogeneity of variances was evaluated using Levene’s test. Normally distributed continuous variables are presented as mean ± standard deviation, whereas non-normally distributed variables are presented as median and interquartile range. Categorical variables are expressed as frequencies and percentages. Student’s t-test or Mann–Whitney U test was used for comparisons of continuous variables, as appropriate. The χ 2 test was used to compare categorical variables between groups.
Associations between dietary factors and MASLD were evaluated using logistic regression analysis. Dietary variables were categorised according to mean intake values and recommended intake levels for healthy adults based on the TDG-2022(22). These dichotomised variables were included in univariate and multivariable logistic regression models. Two multivariable models were constructed. Model 1 was adjusted for age, sex and daily energy intake. Model 2 was additionally adjusted for BMI, considering its potential role as a mediator in the association between dietary factors and MASLD. Since BMI may lie on the causal pathway, adjustment for BMI may result in overadjustment; therefore, model 2 was considered a sensitivity analysis.
A two-tailed P < 0·05 was considered statistically significant. All analyses were performed using SPSS version 26.0 for Windows (SPSS Inc.).
Results
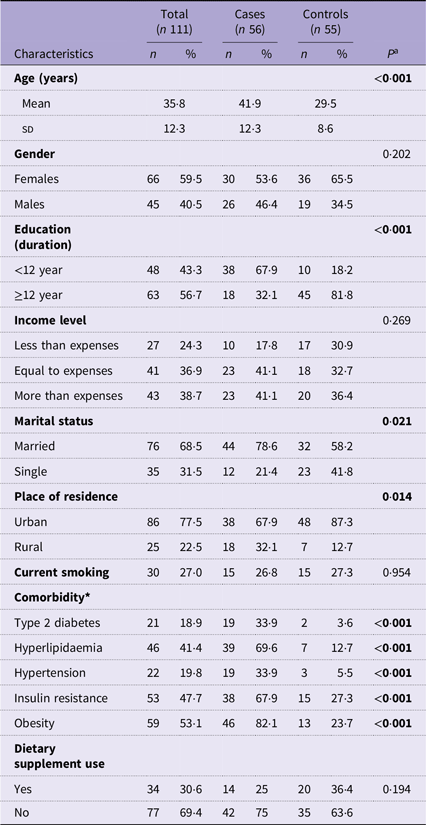
This study included 111 participants (fifty-six cases and fifty-five controls). Socio-demographic and health-related characteristics are presented in Table 1. Cases were significantly older than controls (P < 0·001). No significant differences were observed between groups in terms of sex, income level or smoking status. Higher education level was more common among controls, whereas being married and living in rural areas were more frequent among cases (P < 0·05). Comorbid conditions, including type 2 diabetes, hyperlipidaemia, hypertension, insulin resistance and obesity, were more prevalent in the case group (P < 0·001).
Socio-demographic and health characteristics of the participants

Table 1. Long description
A table comparing socio-demographic and health characteristics of participants. The table has 11 rows and 7 columns. The columns are labeled Characteristics, Total (n 111), Cases (n 56), Controls (n 55), and P. The rows are labeled Age (years), Gender, Education (duration), Income level, Marital status, Place of residence, Current smoking, Comorbidity, and Dietary supplement use. Each row provides percentages and counts for each characteristic across the total, cases, and controls groups. Notable trends include significant differences in age, education level, marital status, place of residence, and various comorbidities between cases and controls.
n: Number, %: Percentage.
a Mann–Whitney U test was used for age, and the χ 2 test was used for categorical variables.
* Multiple comorbidities could be reported; percentages were calculated based on the sample size of each group.
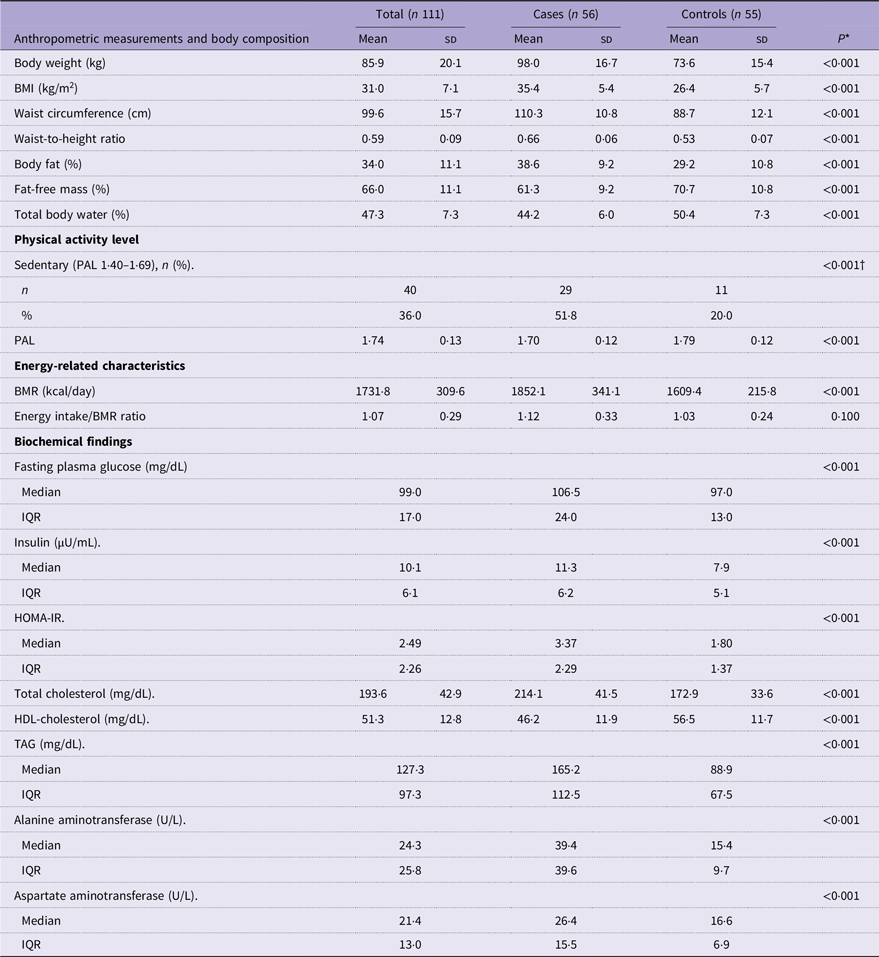
Anthropometric, body composition, physical activity and biochemical findings are summarised in Table 2. Anthropometric measures and adiposity indicators were significantly higher among cases, accompanied by higher body fat percentage and lower fat-free mass percentage. Biochemical findings supported these differences, with higher insulin resistance, fasting glucose and TAG levels and lower HDL-cholesterol levels in the case group. Liver enzyme levels (alanine aminotransferase and aspartate aminotransferase) were also elevated (all P < 0·001). Cases had a higher proportion of sedentary individuals and lower physical activity level values compared with controls (P < 0·001). The energy intake to basal metabolic rate (EI/BMR) ratio did not differ significantly between groups (P = 0·100).
Anthropometric measurements, body composition, physical activity, biochemical findings and energy-related characteristics of the participants

Table 2. Long description
A table comparing anthropometric measurements, body composition, physical activity, and biochemical findings between cases and controls. The table has 23 rows and 6 columns. Column headers are Total (n 111), Cases (n 56), Controls (n 55), and P. Row labels include Body weight (kg), BMI (kg per meter squared), Waist circumference (cm), Waist-to-height ratio, Body fat (percent), Fat-free mass (percent), Total body water (percent), Sedentary (PAL 1.40-1.69) (n, percent), PAL, BMR (kcal per day), Energy intake per BMR ratio, Fasting plasma glucose (mg per dL), Insulin (mu U per mL), HOMA-IR, Total cholesterol (mg per dL), HDL-cholesterol (mg per dL), TAG (mg per dL), Alanine aminotransferase (U per L), Aspartate aminotransferase (U per L). Each row provides mean and standard deviation values for Total, Cases, and Controls, along with P values indicating statistical significance.
IQR, interquartile range; HOMA-IR, homeostatic model assessment index; PAL, physical activity level.
* Student’s t-test or Mann–Whitney U test.
† χ 2 test.
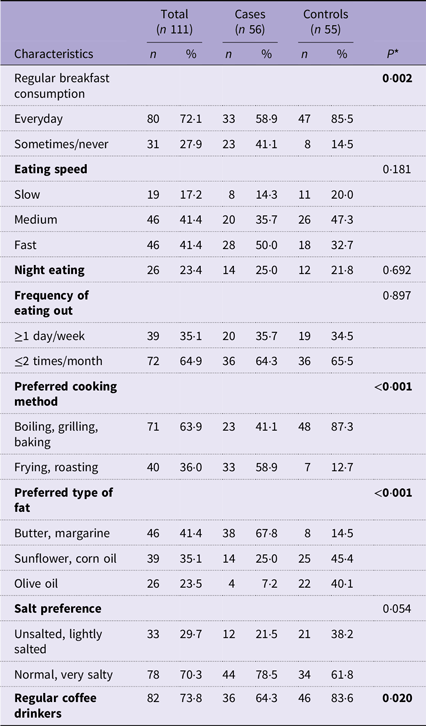
Eating habits differed between groups, as shown in Table 3. Regular breakfast consumption and the use of cooking methods such as boiling, grilling and baking were more common among controls, whereas frying and roasting were more frequent in the case group (p < 0·05). Olive oil consumption was higher among controls. Coffee consumption was also higher among controls, while other eating behaviours, including eating speed, salt preference, eating out and night eating, did not differ between groups.
Eating habits of the participants

Table 3. Long description
The table compares various eating habits between cases and controls. It has 111 rows and 7 columns. The columns are labeled Characteristics, Total (n 111), Cases (n 56), Controls (n 55), and P*. The table includes data on regular breakfast consumption, eating speed, night eating, frequency of eating out, preferred cooking method, preferred type of fat, salt preference, and regular coffee drinkers. Each row provides the number and percentage of participants in each category for both cases and controls. Notable trends include higher regular breakfast consumption and use of boiling, grilling, and baking among controls, while frying and roasting are more frequent in the case group. Olive oil consumption and coffee consumption are higher among controls.
n: Number, %: Percentage.
* χ 2 test.
Adherence to TDG-2022 recommendations is presented in Figure 2. Compliance with recommendations for dairy products, fish, legumes and fruit was lower among cases compared with controls (P < 0·05). In contrast, grain consumption markedly exceeded recommended levels in the case group (P < 0·001). No significant differences were observed between groups for meat, eggs or vegetable consumption.
Mean percentage adherence to TDG-2022 recommendations across food groups.

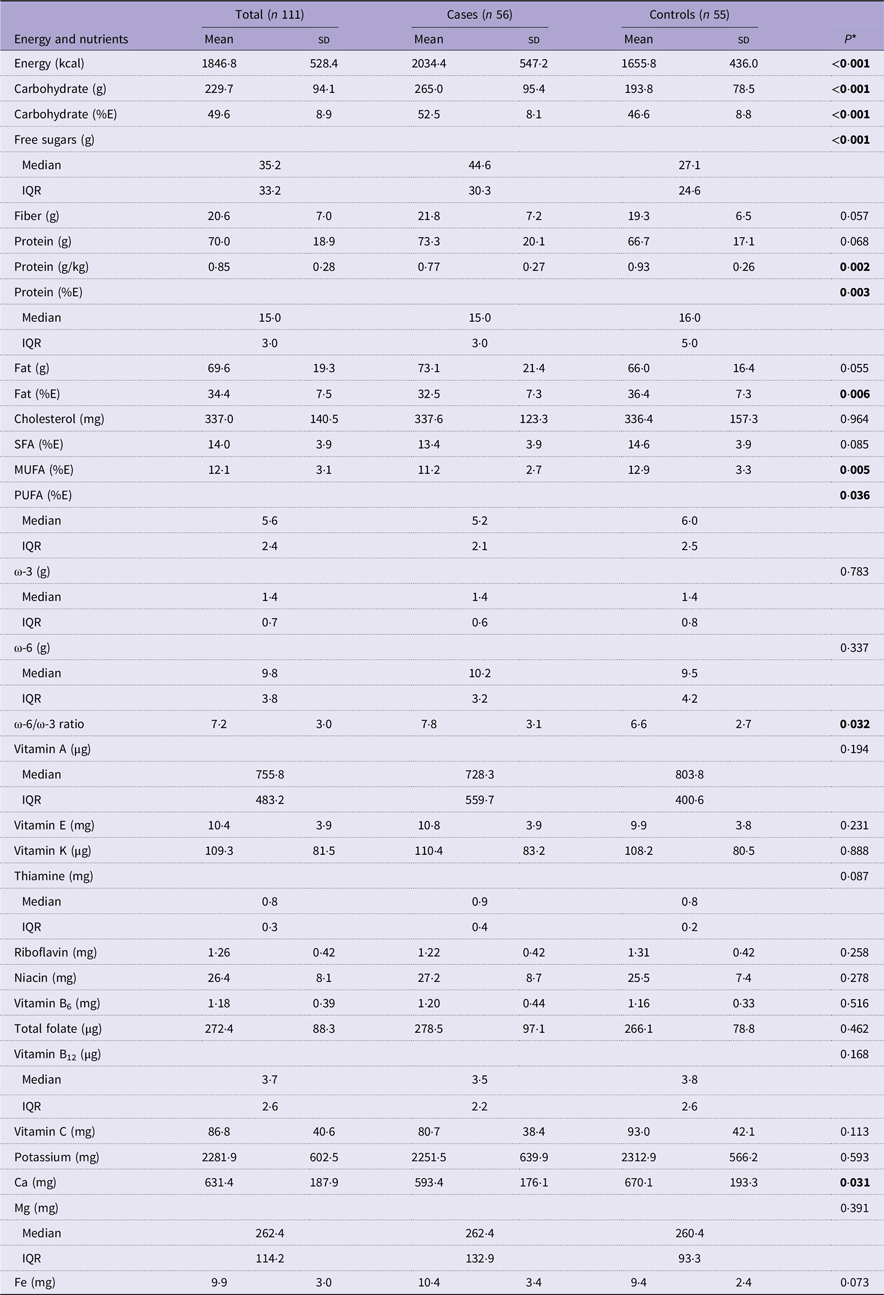
Daily energy and nutrient intake are presented in Table 4. Total energy intake and carbohydrate consumption were higher in the case group, along with higher free sugar intake (P < 0·001). In contrast, the relative contribution of protein and fat to total energy intake, as well as protein intake per kilogram, was lower among cases (P < 0·05). The quality of fat intake also differed, with a lower proportion of energy derived from unsaturated fatty acids and a higher n-6/n-3 ratio in the case group. Ca intake was significantly higher among controls, while other micronutrient intakes did not differ between groups.
Daily energy and nutrient intake based on 3-d food records

Table 4. Long description
The table presents data on daily energy and nutrient intake based on 3-day food records, comparing cases and controls. It includes 11 rows and 10 columns. Column headers are Total (n 111), Cases (n 56), Controls (n 55), and P*. Row labels include Energy and nutrients, Energy (kcal), Carbohydrate (g), Carbohydrate (%E), Free sugars (g), Fiber (g), Protein (g), Protein (%E), Fat (g), Fat (%E), Cholesterol (mg), SFA (%E), MUFA (%E), PUFA (%E), n-3 (g), n-6 (g), n-6/n-3 ratio, Vitamin A (μg), Vitamin E (mg), Vitamin K (μg), Thiamine (mg), Riboflavin (mg), Niacin (mg), Vitamin B6 (mg), Total Folate (μg), Vitamin B12 (μg), Vitamin C (mg), Potassium (mg), Ca (mg), Mg (mg), and Fe (mg). Each row provides mean, standard deviation (sd), and interquartile range (IQR) values for cases and controls, along with P-values indicating statistical significance.
IQR, interquartile range; ω, omega; E, energy.
* Student’s t-test or Mann–Whitney U test.
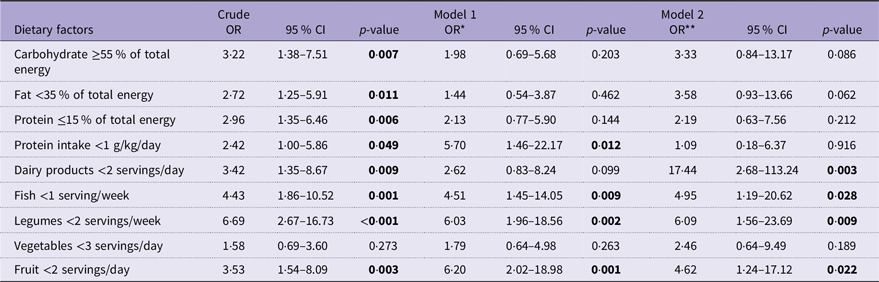
Logistic regression analyses are presented in Table 5. In crude analyses, several dietary factors were associated with MASLD. After adjustment for age, sex and energy intake (Model 1), lower intake of protein (per kg), fish, legumes and fruit remained associated with higher odds of MASLD (P < 0·05). In model 2, additionally adjusted for BMI, lower consumption of dairy products, fish, legumes and fruit remained associated with higher odds of MASLD, whereas the association with protein intake was no longer significant.
Associations between dietary factors with MASLD: crude and multivariable-adjusted odds ratios

Table 5. Long description
A table comparing dietary factors with MASLD using crude and multivariable-adjusted odds ratios. The table has 8 rows and 9 columns. Column headers are: Dietary factors, Crude OR, 95 % CI, p-value, Model 1 OR*, 95 % CI, p-value, Model 2 OR**, 95 % CI, p-value. Row labels are: Carbohydrate >=55% of total energy, Fat <=35% of total energy, Protein <=15% of total energy, Protein intake <1 g/kg/day, Dairy products <2 servings/day, Fish <1 serving/week, Legumes <2 servings/week, Vegetables <3 servings/day, Fruit <2 servings/day. Each row lists the crude odds ratio, 95% confidence interval, and p-value, followed by the adjusted odds ratios and 95% confidence intervals for Model 1 and Model 2, along with their respective p-values.
MASLD, metabolic dysfunction-associated steatotic liver disease.
* Model 1: adjusted for age, sex and daily energy intake.
** Model 2: additionally adjusted for BMI.
Discussion
This study examined dietary intake and eating habits in relation to MASLD, identifying several dietary factors that may be associated with the disease.
Eating habits
Significant differences were observed between groups in several dietary behaviours. Regular breakfast consumption was less common among cases. Skipping breakfast has been reported to reduce diet quality and to be associated with oxidative stress, chronic inflammation, and a higher risk of MASLD(Reference Shi, Suo and Wang24) and other metabolic disorders(Reference Marjot, Tomlinson and Hodson25). It has also been associated with increased severity of steatosis and fibrosis in patients with fatty liver disease(Reference Alizadeh, Hosseiniazar and Alami26). Conversely, regular breakfast consumption may exert beneficial effects on MASLD by improving glycaemic control and lipid profile(Reference Shi, Suo and Wang24,Reference Alizadeh, Hosseiniazar and Alami26) , as well as by supporting circadian rhythm(Reference Shi, Suo and Wang24,Reference Marjot, Tomlinson and Hodson25) and energy homeostasis(Reference Shi, Suo and Wang24). Differences in cooking practices were also evident, with frying and roasting more frequent among cases. Fried food consumption has been associated with higher odds of MASLD, potentially through increased production of compounds such as advanced glycation end products and trans fatty acids(Reference Chaturvedi, Tripathi and Vikram27,Reference Peng, Xie and Pan28) . In addition, olive oil consumption was lower among cases. Olive oil, a key component of the Mediterranean diet, is rich in MUFA and has been associated with lower odds of MASLD(Reference Del Bo’, Perna and Allehdan7,Reference Salehi-Sahlabadi, Sadat and Beigrezaei29) .
Coffee consumption was higher among controls. Coffee contains several bioactive compounds, including caffeine, chlorogenic acids and diterpenes such as cafestol and kahweol, which may influence liver metabolism(Reference Dranoff30,Reference Vargas-Pozada, Ramos-Tovar and Márquez-Quiroga31) . However, the effects of coffee may vary depending on the source and preparation method, making its overall impact on liver health difficult to determine(Reference Dranoff30). A meta-analysis reported no significant association between coffee consumption and MASLD prevalence, but suggested a potential association with reduced fibrosis risk(Reference Ebadi, Ip and Bhanji32).
Food groups
Participants with MASLD had lower adherence to recommended intakes of dairy products, fish, legumes, and fruit, while exceeding recommended grain consumption, suggesting a less favorable dietary pattern. Lower dairy intake among cases is consistent with previous studies reporting both reduced consumption in MASLD patients(Reference Chaturvedi, Tripathi and Vikram27) and an association between dairy intake and lower odds of MASLD(Reference Dai, Liu and Zhang2,Reference Keshavarz, Rahimlou and Farjam33) . The potential benefits of dairy products may be related to their Ca content, which has been linked to increased fat oxidation(Reference Schepp, Freuer and Wawro9), as well as their effects on inflammation and gut microbiota, particularly through probiotic components(Reference Keshavarz, Rahimlou and Farjam33,Reference Montemayor, Mascaró and Ugarriza34) . In addition, milk proteins such as casein may exert insulinotropic effects and positively influence lipid metabolism(Reference Yuzbashian, Fernando and Pakseresht35).
Lower consumption of fish, legumes and fruit among cases is also supported by previous literature. Fish intake, particularly due to its n-3 fatty acid content, has been associated with improvements in lipid metabolism and inflammation(Reference Montemayor, Bouzas and Mascaró8,Reference Schepp, Freuer and Wawro9) . Similarly, higher legume consumption has been linked to lower MASLD risk, potentially through beneficial effects on glucose and lipid metabolism(Reference Langmann, Jensen and Mortensen36). Fruit consumption may contribute to improved metabolic health through bioactive phytochemicals that influence key pathways related to obesity, dyslipidaemia and diabetes(Reference Pathak, Pathak and Saikia37). Grain consumption exceeded recommended levels among cases; however, the lack of differentiation between whole and refined grains limits interpretation. This distinction is important, as whole grain intake has been associated with lower odds of MASLD(Reference Schepp, Freuer and Wawro9), whereas refined grains have been linked to higher odds(Reference Riazi, Raman and Taylor12). Therefore, the findings related to grain consumption should be interpreted with caution, and future studies should distinguish between grain subtypes.
Energy and nutrient intake
Energy intake was higher among cases, consistent with previous studies linking excess energy intake to obesity and MASLD(Reference Aktary, Eller and Nicolucci38–Reference Tsompanaki, Thanapirom and Papatheodoridi40). It has been reported that reducing dietary energy intake is a critical factor in reducing fat accumulation in the liver(Reference Montemayor, Bouzas and Mascaró8,Reference Chiurazzi, Cacciapuoti and Di Lauro13,Reference Henney, Gillespie and Alam39) . Increased carbohydrate intake may contribute to intrahepatic TAG accumulation through de novo lipogenesis and inflammatory pathways(Reference Henney, Gillespie and Alam39,Reference Gao, Hua and Hu41) .
Protein intake was lower among cases and was associated with higher odds of MASLD in initial models; however, this association was attenuated after adjustment for BMI, suggesting a potential mediating role of adiposity. This finding is consistent with previous studies reporting lower protein intake was associated with higher odds of MASLD(Reference Charatcharoenwitthaya, Tansakul and Chaiyasoot42). Proteins play a key role in hepatocyte regeneration and may help prevent steatosis through their amino acid composition(Reference Ullah, Rauf and Nabi43). A meta-analysis reported no significant difference in total protein intake between MASLD and controls, although differences in protein sources were observed(Reference Tsompanaki, Thanapirom and Papatheodoridi40).
Although the contribution of fat to total energy intake was lower among cases, growing evidence suggests that fat quality may be more important than total fat quantity in MASLD(Reference Henney, Gillespie and Alam39). In this study, lower intake of unsaturated fatty acids (MUFA and PUFA) and a higher n-6/n-3 ratio were observed among cases, both of which may contribute to adverse metabolic outcomes. MUFA, a key component of the Mediterranean diet, may reduce lipogenesis and increase fatty acid oxidation, while PUFA are known to modulate lipid metabolism and inflammatory pathways through mechanisms involving hepatic PPARα activation(Reference Del Bo’, Perna and Allehdan7,Reference Aktary, Eller and Nicolucci38) . A lower dietary n-6/n-3 ratio has been associated with reduced accumulation of oxidised linoleic acid metabolites, which are implicated in the development of hepatosteatosis(Reference Pan, Sui and Xu10,Reference Chaturvedi, Tripathi and Vikram27) .
Ca intake was lower among cases, which may be related to lower dairy consumption. Ca has been associated with increased fat oxidation and may be beneficial in the context of MASLD(Reference Keshavarz, Rahimlou and Farjam33).
Multivariable models and interpretation
Multivariable analyses provided further insight into these associations. The attenuation of the relationship between protein intake and MASLD after BMI adjustment suggests that adiposity may mediate this association. In contrast, associations for fish, legumes and fruit consumption remained significant, indicating potential effects beyond body weight, possibly through improvements in insulin sensitivity, inflammation and lipid metabolism.
The stronger association observed for low dairy consumption after BMI adjustment should be interpreted cautiously due to the wide confidence interval, suggesting limited precision and potential residual confounding and highlighting a complex relationship between dairy consumption, adiposity and MASLD.
Validity of dietary assessment
The EI/BMR ratios in both groups were below the commonly accepted cut-off (∼1·35)(Reference Goldberg, Black and Jebb44), suggesting potential underreporting of dietary intake. This is consistent with previous literature indicating that underreporting is a common limitation of self-reported dietary assessment methods(Reference Bredin, Naimimohasses and Norris45). In addition, BMR was estimated using the Harris–Benedict equation, which may have limited accuracy in individuals with obesity. Alternative equations, such as the Mifflin–St Jeor equation(Reference Mifflin, St Jeor and Hill46), may provide more accurate estimates in such populations. Therefore, potential inaccuracies in BMR estimation should be considered when interpreting the EI/BMR ratio.
Dietary patterns and guidelines
International guidelines emphasise the importance of dietary modification in MASLD management. The EASL–EASD–EASO Clinical Practice Guidelines recommend dietary patterns consistent with the Mediterranean diet, characterised by higher consumption of olive oil, fruits, vegetables, legumes, fish and whole grains and reduced intake of refined sugars(1).
Some of the observed dietary patterns in this study are consistent with key components of the Mediterranean diet, suggesting that these habits may be associated with lower odds of MASLD. However, not all components were reflected in the findings, as no significant differences were observed for vegetable intake or saturated fat consumption.
Beyond individual nutrients and food groups, the observed differences may reflect broader dietary pattern differences. While the Mediterranean diet represents one well-established example, similar features are also emphasised in other dietary patterns such as the DASH diet, which promotes higher consumption of legumes and fruit and lower intake of added sugars(Reference Chiavaroli, Viguiliouk and Nishi47), and the MIND diet, which emphasiaes higher consumption of olive oil, fish and legumes(Reference Morris, Tangney and Wang48). As dietary pattern indices were not formally assessed, this interpretation should be considered exploratory.
Limitations and strengths
There are a few limitations that warrant discussion. The cross-sectional design precludes causal inference. Dietary intake was self-reported and may be subject to recall bias; in addition, the low EI/BMR ratios observed in both groups suggest the presence of underreporting. In addition, food subgroups such as yogurt, cheese, red meat, green leafy vegetables and whole grains were not evaluated separately, which may have limited the ability to detect more specific associations. Multiple statistical tests were performed without adjustment for multiple comparisons, which may increase the likelihood of type I error and chance findings, particularly in univariate analyses. Therefore, the findings should be interpreted cautiously. Although the primary multivariable analyses were based on a priori hypotheses, residual risk of false-positive findings cannot be excluded. In addition, psychological factors (e.g. stress and depression) and genetic predisposition were not assessed, which may have influenced eating behaviours and metabolic outcomes.
Despite these limitations, this study provides comprehensive data on eating habits, nutrient intake and food group consumption in relation to MASLD in a Turkish population, contributing to the limited evidence available in this field.
Conclusion
This study identified several differences in dietary intake and eating habits between individuals with MASLD and controls. Lower consumption of dairy products, fish, legumes, fruit and olive oil, together with higher carbohydrate intake, higher n-6/n-3 ratio, lower intake of unsaturated fatty acids and less favourable eating habits such as breakfast skipping and preference for frying and roasting methods, was more common among individuals with MASLD. In multivariable analyses, lower consumption of dairy products, fish, legumes and fruit remained associated with higher odds of MASLD even after adjustment for BMI.
Overall, the findings suggest that dietary patterns characterised by lower diet quality, rather than isolated nutrients, may be associated with MASLD. However, given the cross-sectional design and the limitations related to dietary assessment, the findings should be interpreted with caution. Further prospective studies and randomised controlled trials are needed to clarify the relationships between food groups, nutrient intake, eating habits, dietary patterns and MASLD.
Data availability statement
The data supporting the findings of study are available from the corresponding author upon reasonable request. The data are not publicly available due to ethical and privacy restrictions related to the participants’ personal information.
Acknowledgements
The authors thank all participants who took part in the study.
A.K. and Y.A. designed the study, analysed the data, interpreted the findings and drafted the manuscript. A.K. collected the data and was the principal investigator of the study. Both authors read and approved the final manuscript.
No financial support was received for this study.
The authors declare that they have no conflicts of interest.



 Open access

