
I. INTRODUCTION
Compared with conventional incandescent lighting, white-light-emitting diodes (w-LEDs) have attracted increasing attention due to their higher conversion efficiency in recent years. Reference Mi, Sun, Zhou, Zhou, Song, Li, Shang and Lin1,Reference Guo, Jing and Li2 In general, commercial w-LEDs are generated by a combination of a blue InGaN LED chip with a yellow-emitting YAG:Ce3+ phosphor. Reference Kang and Jeong3,Reference Jia, Wang, Guo, Li, Zou and Jia4 However, such w-LEDs have low color rendering index (CRI) because of the lack of red light in the emission spectra. Reference Xin and Zhu5 To improve the CRI value, w-LEDs fabricated using an InGaN-based LED chip combined with the tricolor phosphors blend have been investigated. Accordingly, finding novel phosphors that can be excited by the n-UV light has become one of the hot research topics in the phosphor community. Among them, Fluorapatite-based phosphors have attracted wide attention for solid state lighting due to their excellent luminescent characteristics, such as Ca9La(PO4)5(SiO4)F2:Dy3+, Reference Liu, Liao, Molokeev, Guo, Zhang and Mei6 La6Sr4(SiO4)6F2:Ce3+,Tb3+, Reference Guo, Liao, Molokeev, Mei and Liu7 Ca9Mg(PO4)6F2:Eu2+,Mn2+, Reference Li, Geng, Shang, Zhang, Lian and Lin8 Sr5(PO4)3F:Eu2+,Mn2+, Reference Feng, Huang, Liu, Liu and Yu9 Ba3NaLa(PO4)3F:Tb3+,Sm3+, Reference Liu, Liao, Chen, Guo, Zhang and Mei10 Sr3NaLa(PO4)3F:Eu2+,Mn2+. Reference Hu and Tang11
Rare earth ions play an irreplaceable and significant role in phosphors due to their 5d → 4f or 4f → 4f transitions. Reference Guo, Liao, Mei and Liu12,Reference Xie and Pan13 Among them, Eu2+ ions were used as activators with strong absorption in the UV and visible regions. Reference Li, Liu, Wang, Zhu, Wang and Wang14,Reference Bharat, Park and Yu15 Since the 5d orbital of Eu2+ are more sensitive to the ligand field and can be easily influenced by the surrounding environment, Eu2+ gives a wide range of emission color from blue to red.
Therefore, it is interesting to find novel hosts (new structures or phase) for Eu2+. In this paper, a novel fluorapatite KLaSr3(PO4)3F and its application in phosphor materials were prepared for the first time. The crystal structure and luminescence properties of KLaSr3(PO4)3F:Eu2+ are described in detail. KLaSr3−x (PO4)3F:xEu2+ phosphors exhibit a wide emission band ranging from 425 to 550 nm. The concentration quenching, fluorescence decay behavior, as well as the temperature dependent luminescence properties were investigated in detail. A w-LED device was obtained by coating KLaSr3(PO4)3F:Eu2+, commercial green [(Ba,Sr)SiO4:Eu2+] phosphor, and commercial red (CaAlSiN3:Eu2+) phosphor. All the results indicated that KLaSr3(PO4)3F is a good host and KLaSr3(PO4)3F:Eu2+ can be used for blue-emitting phosphors.
II. EXPERIMENTAL PROCEDURE
A. Materials and synthesis
KLaSr3(PO4)3F host and KLaSr3−x (PO4)3F:xEu2+ phosphors were prepared via a high temperature solid–state reaction. K2CO3 (Aldrich, 99.9%), SrCO3 (Aldrich, 99.9%), La2O3 (Aldrich, 99.995%), NH4H2PO4 (Aldrich, 99.9%), NH4HF2 (Aldrich, 99.9%), and Eu2O3 (Aldrich, 99.995%) were used as starting materials. Firstly, the raw materials were weighed and ground in an agate mortar according to the stoichiometric composition, and an excess of mol 15% of NH4HF2 was needed to compensate for the loss of F source during the heating process. Then, the mixture was placed into an alumina crucible and heated at 1100 °C for 5 h in a flowing reducing atmosphere of 10% H2 + 90% N2. Finally, the as-prepared samples were cooled to room temperature and ground again into powder for subsequent measurements.
B. Characterization
Phase structures of the as-prepared samples were checked by x-ray powder diffractometer (D/max-rA 12kw, Shimadzu Corporation, Kyoto, Japan) with Cu Kα radiation (λ = 1.5418 Å) from 20° to 70° (2θ). The x-ray diffraction (XRD) data for the Rietveld analysis were collected using a step scanning mode with a step size of 0.03° and counting time of 2 s per step (2θ ranging from 10° to 120°). Rietveld refinement was performed using the computer software: General Structure Analysis System (GSAS). Reference Larson and Von Dreele16 The photoluminescence excitation (PLE) and emission spectra were measured on a Hitachi F-4500 spectrophotometer (150 W Xe lamp as the excitation lamp; Hitachi Corporation, Tokyo, Japan). The temperature-dependent luminescence properties were also measured on the same spectrophotometer. Diffuse reflection spectra were investigated by a UV–Vis–NIR spectrophotometer (SHIMADZU UV-3600) attached with an integrating sphere, and BaSO4 was used as a standard reference. The luminescence decay curves were obtained on a spectro-fluorometer (HORIBA JOBIN YVON FL3-21), and a 370 nm pulse laser (370-nm Nano LED, model number 08254) was used as the excitation source. The morphology and the size of the KLaSr3(PO4)3F host were observed by scanning electron microscopy (Hitachis-520, Shimadzu). The quantum efficiency (QE) was obtained by the absolute photoluminescence quantum yield measurement system (Nanolog® FluoroLog-3-2-iHR320, Horiba Jobin Yvon) with F-3018 integral sphere.
III. RESULTS AND DISCUSSION
A. Crystal structure of KLaSr3(PO4)3F
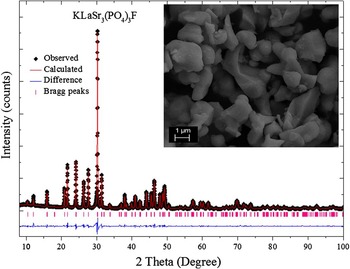
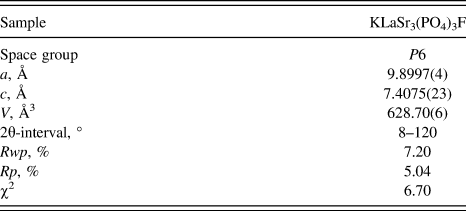
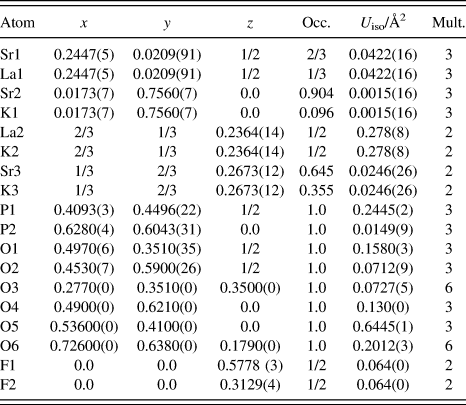
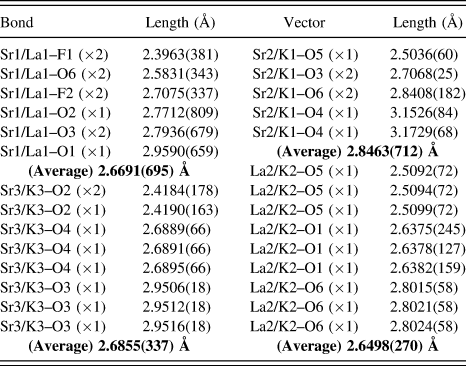
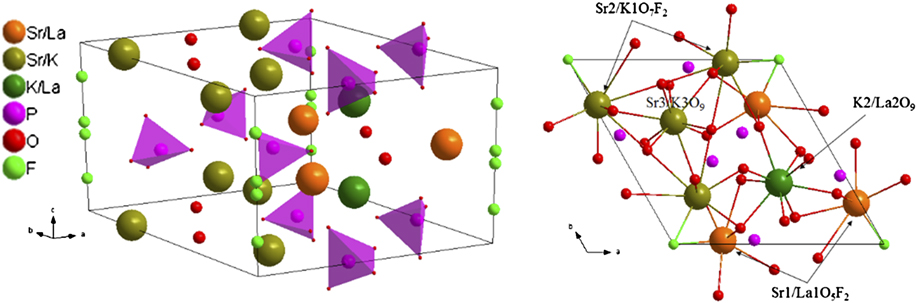
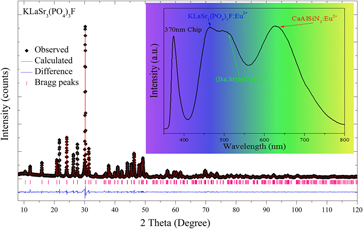
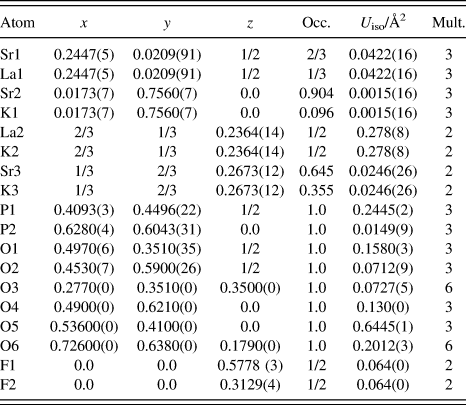
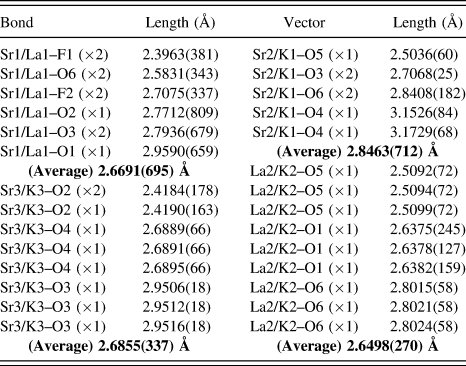
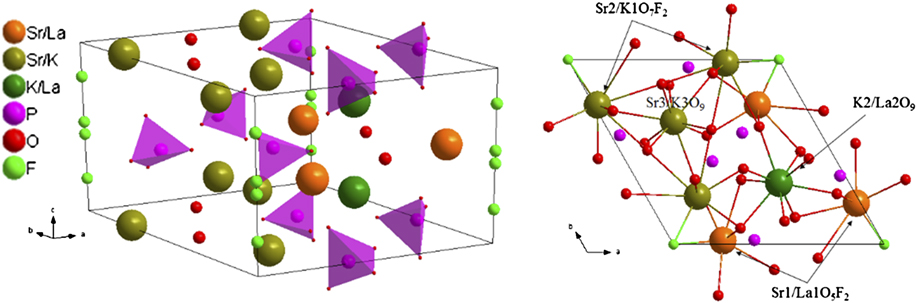
The Rietveld structural refinement of the XRD pattern of the KLaSr3(PO4)3F host was carried out using the GSAS program, which is depicted in Fig. 1. The red solid line, black spots, short pink verticals, and blue solid lines represent the calculated pattern, the observed pattern obtained from XRD measurements, the Bragg positions, and the difference between the observed and calculated patterns, respectively. Tables I and II list the crystallographic data, details on the data collection, refinement parameters, as well as the fractional atomic coordinates and isotropic displacement parameters obtained from the GSAS Rietveld refinement using x-ray powder diffraction data at room temperature. Table III shows bond lengths (Å) of Sr/La/K–O/F in KLaSr3(PO4)3F crystal lattice obtained from the GSAS Rietveld refinement using x-ray powder diffraction data at room temperature. On the basis of the results shown in Fig. 1 and Table I, the refinement for KLaSr3(PO4)3F host was stable and gives small R-factors, and the reliability parameters goodness of fitting (χ2) of refinement is χ2 = 6.70. The unit cell parameters for KLaSr3(PO4)3F are a = 9.8997 Å, c = 7.4075 Å, and V = 628.7 Å3. As illustrated in Table II, Sr1, Sr2, La2, and Sr3 have the same fractional atomic coordinates with La1, K1, K2, and K3, which means that Sr1–La1, Sr2–K1, La2–K2, and Sr3–K3 occupy the same crystallographic sites, respectively. As shown in the inset of Fig. 1, the particles of the sample have smooth morphology with the diameters ranging from 1 to 6 μm, and the particles are not uniformly ascribed to their agglomeration during heating process. The crystal structure diagrams of KLaSr3(PO4)3F viewed in different directions and the coordination environment of cation sites for activators are shown in Fig. 2. P and O forms [PO4] tetrahedral, which are separated and stacked together by sharing tetrahedral corners or edges with other polyhedra to form concise framework. There are three different crystallographic sites for Sr (Sr1, Sr2, and Sr3), two La sites (La1 and La2), and three K sites (K1, K2, and K3) in KLaSr3(PO4)3F. Moreover, Sr1/La1 positions were seven coordinated by five O atoms and two F atoms with a majority of Sr (2/3 Sr and 1/3 La). Sr2/K1 atoms have nine coordinations surrounded by seven O atoms and two F atoms. While, Sr3/K3 were nine coordinated by nine O atoms with the composition 64.5% Sr and 35.5% K. La2/K2 were also coordinated by nine O atoms, and the number of atoms for La and K is the same. Interesting luminescence behaviors may occur due to these rich crystallographic sites.
Powder XRD patterns for Rietveld structure analysis of KLaSr3(PO4)3F (The red solid line, black spots, short pink verticals, and blue solid lines represent the calculated pattern, the observed pattern obtained from XRD measurements, the Bragg positions, and the difference between the observed and calculated patterns, respectively), and the inset shows the scanning electron microscope image of KLaSr3(PO4)3F.

Refinement parameters for KLaSr3(PO4)3F obtained from the Rietveld refinement using x-ray powder diffraction data at room temperature.
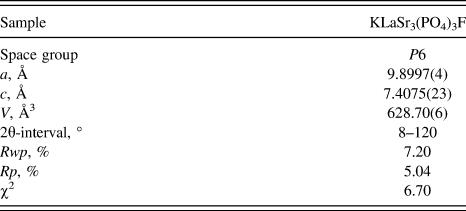
Fractional atomic coordinates, occupancies, and isotropic thermal parameters of KLaSr3(PO4)3F obtained from the GSAS Rietveld refinement using x-ray powder diffraction data at room temperature.
Bond lengths (Å) of Sr/La/K–O/F in KLaSr3(PO4)3F crystal lattice obtained from the GSAS Rietveld refinement using x-ray powder diffraction data at room temperature.
Crystal structure diagrams of KLaSr3(PO4)3F viewed in different directions and the coordination environment of cation sites for activators.
B. Crystal structure and luminescence properties of KLaSr3(PO4)3F:Eu2+
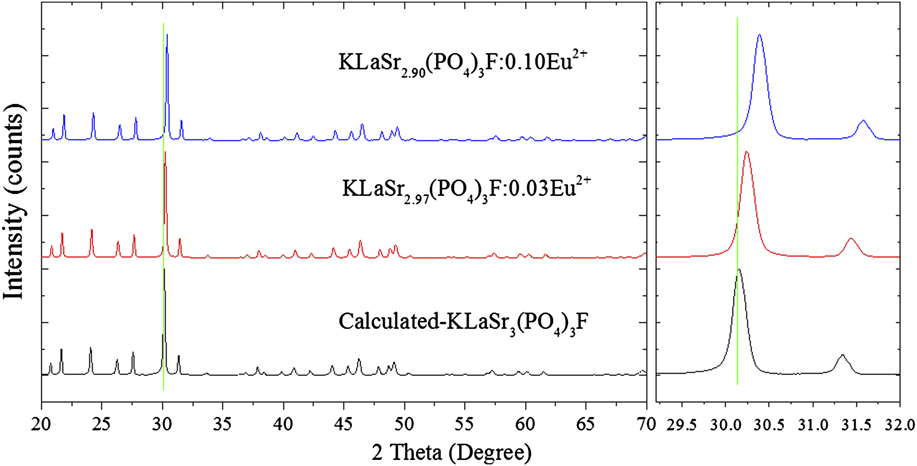
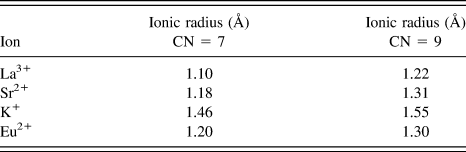
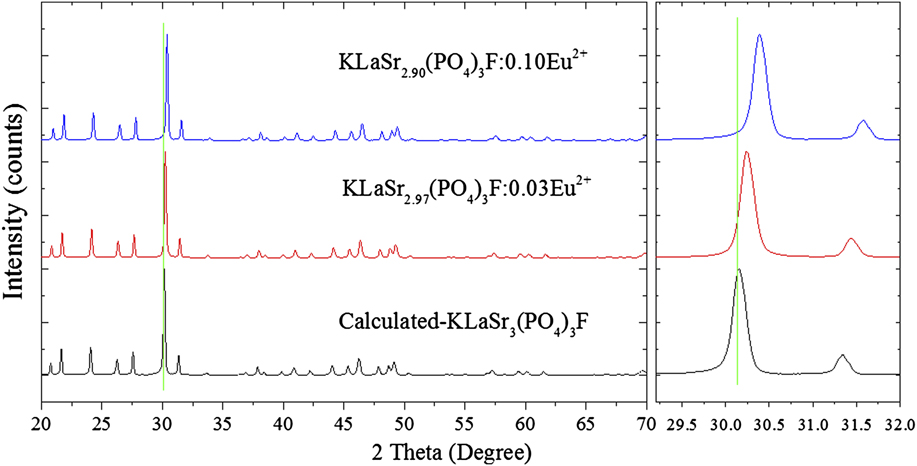
Figure 3 depicts the XRD patterns of KLaSr2.97(PO4)3F:0.03Eu2+ and KLaSr2.90(PO4)3F:0.10Eu2+ phosphors. It goes without saying that both the XRD patterns can be well fitted with that of KLaSr3(PO4)3F, making it clear that the doping of Eu2+ did not cause any significant changes in the structure of KLaSr3(PO4)3F. Furthermore, the diffraction peaks shift slightly to higher angles side with increasing Eu2+ concentration. As we know, the effective ionic radii for Eu2+ is similar with that of Sr2+ under the same coordination, Reference Shannon17 which can be seen in Table IV. Based on the ion radius and electric charge, Eu2+ ions should substitute for Sr2+ in KLaSr3(PO4)3F.
The XRD patterns of KLaSr2.97(PO4)3F:0.03Eu2+ and KLaSr2.90(PO4)3F:0.10Eu2+ and the simulated patterns for KLaSr3(PO4)3F are shown as a reference.
Ionic radius (Å) for given CNs (seven and nine) of Sr2+, La3+, K+, and Eu2+ ions.
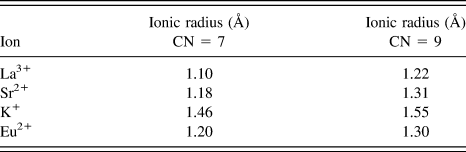
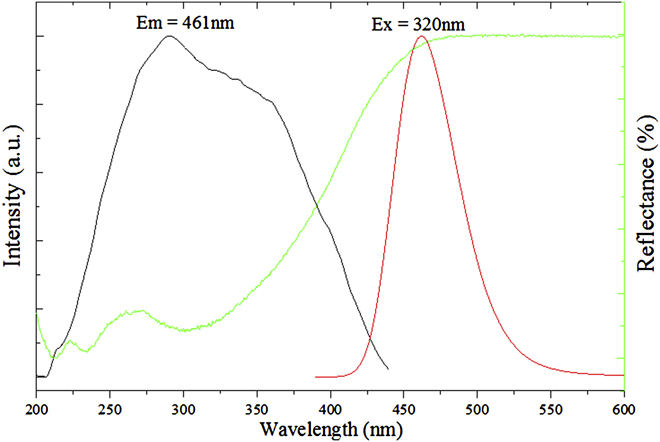
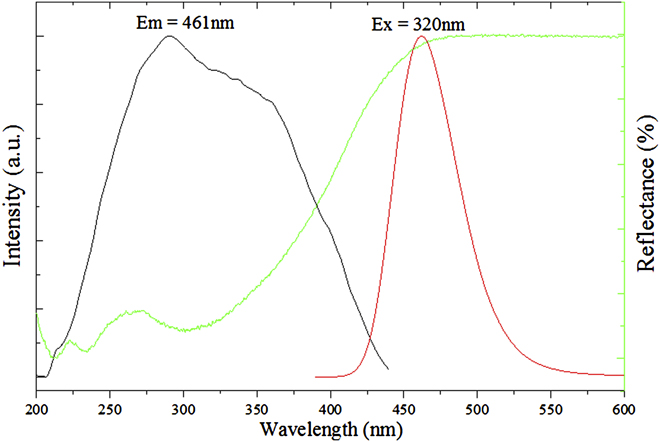
Figure 4 illustrates the diffuse reflectance, the PLE (λem = 461 nm) and emission (PL, λex = 320 nm) spectra of KLaSr2.97(PO4)3F:0.03Eu2+. The diffuse reflectance spectra of the sample show high reflection ranging from 200 to 450 nm ascribed to the 4f 7 → 4f 65d 1 absorption of Eu2+ ions. Reference Liu, Wang, Zhang, Cho, Dierre, Hirosaki, Sekiguchi and Xie18–Reference Rani and Lakshmanan21 The PLE spectrum of the phosphor gives a broad band ranging from 225 nm to 450 nm with a maximum at about 320 nm monitored at 461 nm, which is consistent with the diffuse reflectance spectra of the phosphor. Therefore, the KLaSr2.97(PO4)3F:0.03Eu2+ can be used as a potential phosphor with a broad excitation band. Under the excitation of 320 nm, the PL spectrum of the sample exhibits broad band with asymmetric shape centered at 461 nm assigned to the allowed 4f 65d 1 → 4f 7 transition of the Eu2+ ions. Reference Chen, Yin, Dong, Feng, Gao, He, Jia and Hintzen22,Reference Huang, Liu and Chen23 The Sr5(PO4)3F:Eu2+ phosphors have been reported to have blue emission centered at 440 nm. Reference Feng, Huang, Liu, Liu and Yu9 Compared with Sr5(PO4)3F:Eu2+, the emission of KLaSr3(PO4)3F:Eu2+ exhibits red-shift with a emission band at 461 nm, ascribed to the chemical unit change of Sr2+–Sr2+ to La3+–K+.
The diffuse reflectance, PLE (λem = 461 nm), and emission (PL, λex = 320 nm) spectra of KLaSr2.97(PO4)3F:0.03Eu2+.
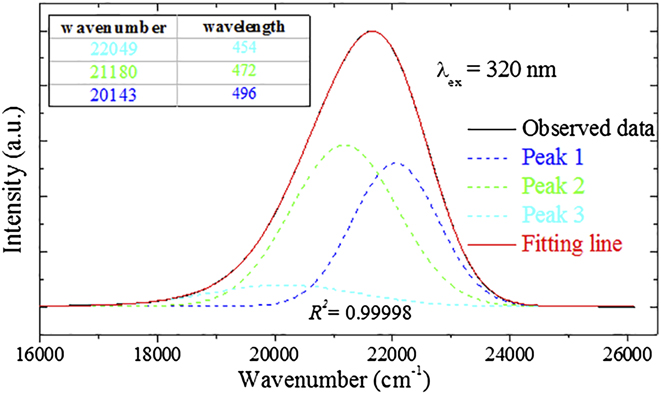
In addition, the asymmetric PL spectrum can be fitted well by three Gaussian peaks centered at 496 nm (peak 1), 472 nm (peak 2), and 454 nm (peak 3) with a perfect value of R 2 (R 2 = 0.9998), as illustrated in Fig. 5. To further understand the site occupation of Eu2+ ions in KLaSr3(PO4)3F, the Van Uitert equation was used as follows Reference Van Uiter24 :
 $$E = Q\left[ {1 - {{\left( {{V \over 4}} \right)}^{{1 \over V}}}{{10}^{ - {{n \times {E_{\rm{a}}} \times r} \over {80}}}}} \right]\quad ,$$
where E is the position of Eu2+ ion emission peak (cm−1), Q represents the position in energy of the lower d-band edge for the free ions (34,000 cm−1 for Eu2+), V stands for the valence of the “active” cation (V = 2 for Eu2+), n is the number of anions in the immediate shell around Eu2+ ion, r refers to the effective radius of the host cations (Sr2+) replaced by Eu2+ ions (Å), and E a is the electron affinity of the atoms that form anions in eV. For the same host, any parameters are equal except for n and r of host cations (Sr2+) in Eq. (1). Obviously, the bigger the value of n × r is, the bigger the value of E is. The values of n × r for Sr1, Sr2, and Sr3 are 8.26 (7 × 1.18), 11.79 (9 × 1.31), and 11.79 (9 × 1.31), respectively. Therefore, peak 1 centered at 496 nm is caused by Eu1. Besides, Eu2/Sr2 and Eu3/Sr3 has the same value of n × r, and coordination. As shown in Table III, the average length with surrounding anions for Sr1 is 2.8463(712) Å smaller than that of 2.9516(18) Å. Thus, Eu2/Sr2 is more stable with a higher energy than Eu3/Sr3. According to the discussion above, peak 2 (472 nm) and peak 3 (454 nm) can be ascribed to Eu3 and Eu2. The three emission bands peaked at 496 nm (peak 1), 472 nm (peak 2), and 454 nm (peak 3) originate from the change in the crystal field strength as the following Reference Rack and Holloway25 :
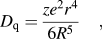 $${D_{\rm{q}}} = {{z{e^2}{r^4}} \over {6{R^5}}}\quad ,$$
where D q stands for the crystal field strength, e is the charge of an electron, r represents the radius of the central ions, d is the wave function, z expresses the charge or valence of the anion, and R is the bond distance between the central ion and ligands. Based on this equation, a shorter bond length increases the crystal field strength when the crystal environment is homologous. The average bond length with their surrounding anions for Sr1, Sr2, and Sr3 are 2.6691 (Å), 2.8463 (Å), and 2.6855 (Å), respectively. Therefore, three Gaussian peaks centered at 496 nm, 472 nm, and 454 nm, can be owed to Eu1, Eu3, and Eu2, respectively.
PL spectrum of KLaSr2.97(PO4)3F:0.03Eu2+ fitted by Gaussian functions under 320 nm excitation.
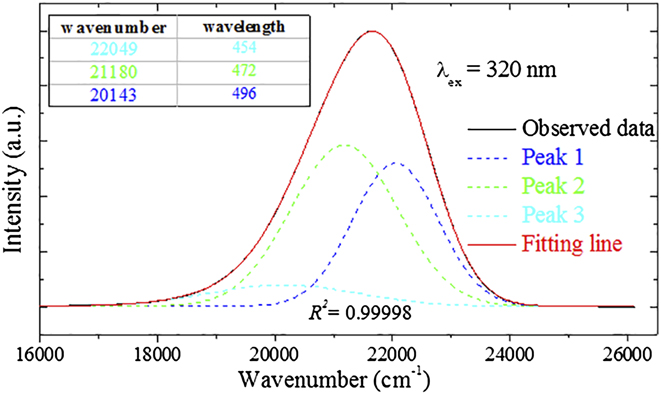
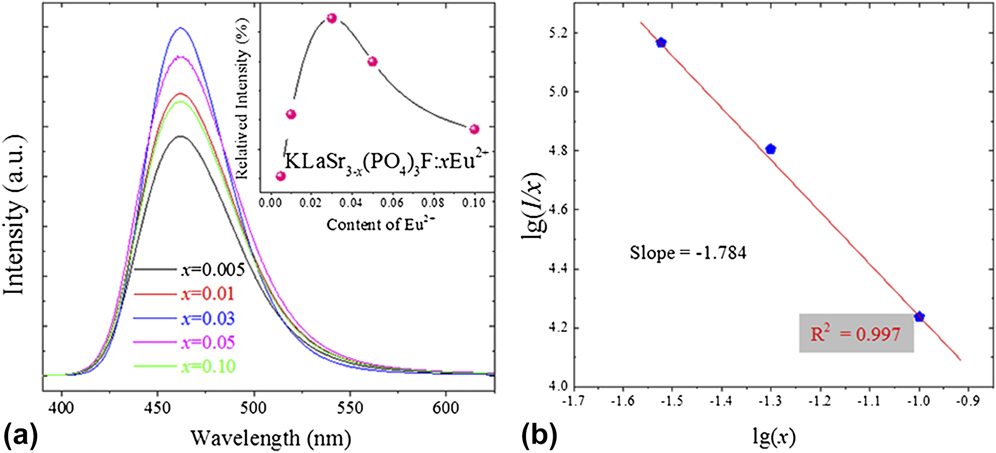
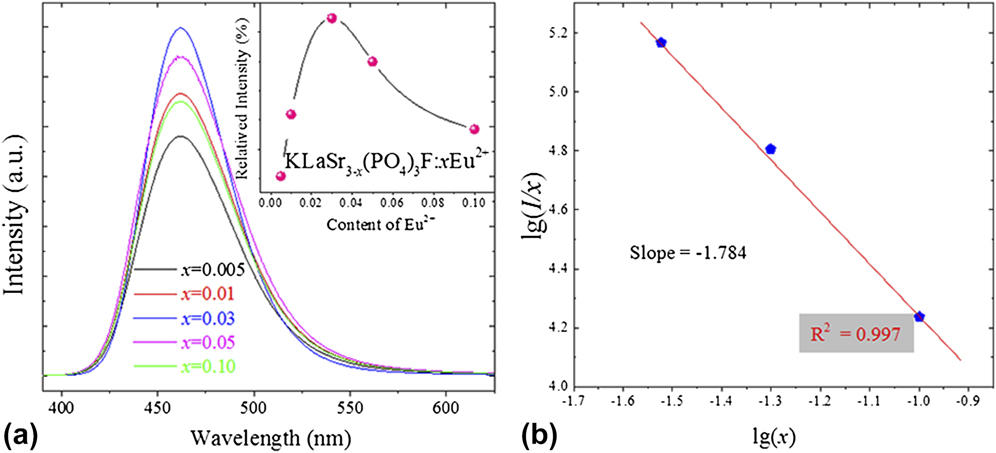
Figure 6(a) illustrates the PL spectra of the KLaSr3−x (PO4)3F:xEu2+ phosphors (x = 0.005, 0.01, 0.03, 0.05, and 0.10) under 320 nm excitation, and the inset shows the relative PL intensity as a function of Eu2+ concentration. As shown in Fig. 6(a), the relative PL intensity increases firstly with the value of x (Eu2+ ions concentration), and reached a max when x = 0.03, and then decreases with further increasing Eu2+ concentration as a result of the concentration quenching effect. Reference Zeuner, Schmidt and Schnick26 Thus, the optimum Eu2+ concentration is determined to be 0.03. It is well known that the concentration quenching phenomenon will not occur when the average distance between the identical Eu2+ ions is big enough. Therefore, the critical distance (R C) is a significant parameter to study the energy transfer between Eu2+ ions, and R C can be estimated using the concentration quench equation proposed by Blasse Reference Blasse27 :
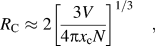 $${R_{\rm{C}}} \approx 2{\left[ {{{3V} \over {4\pi {x_{\rm{c}}}N}}} \right]^{{1 \mathord{\left/ {\vphantom {1 3}} \right. \kern-\nulldelimiterspace} 3}}}\quad ,$$
where V stands for the volume of the unit cell, x c represents the atom fraction of activator at which the quenching occurs, and N is the number of host cations in the unit cell. For KLaSr3(PO4)3F, x c is 0.03 (the optimum Eu2+ concentration), N equals 10 in unit cell, and V is determined as 628.70(6) Å. According to Eq. (3) and the values of the above parameters (N, V, and x c), R C for KLaSr3(PO4)3F can be calculated to be about 15.88 Å. The electric multipolar–multipolar interaction took place as the main part of the nonradiative energy transfer between Eu2+ ions in KLaSr3−x (PO4)3F:xEu2+ phosphors under the condition that R C is larger than 5 Å. Moreover, the interaction type between sensitizers or between sensitizer and activator can be calculated by the following equation based on Dexter theory Reference Dexter28 :
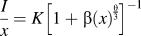 $${I \over x} = K{\left[ {1 + \beta {{\left( x \right)}^{{\theta \over 3}}}} \right]^{ - 1}}$$
in which I is the emission intensity, x represents the activator concentration, k and β are constants for each type of interaction in the same structure, and θ stands for an indication of electric multipolar character. Frequently, θ = 6, 8, 10 were assigned to dipole–dipole (d–d), dipole–quadrupole (d–q), quadrupole–quadrupole (q–q) interactions, respectively. It can be well fitted linearly that the values of log(I/x) versus log(x) for the emission bands at 461 nm of KLaSr3−x (PO4)3F:xEu2+ beyond the quenching concentration, which is illustrated in Fig. 6(b). The slope −(θ/3) was determined as −1.784 with a value of R 2 (0.997), and the value of θ can be calculated to be 5.352. Therefore, electric dipole–dipole interactions should be mainly responsible for the concentration quenching of Eu2+ ions in KLaSr3−x (PO4)3F:xEu2+.
The PL spectra of the KLaSr3−x (PO4)3F:xEu2+ phosphors (x = 0.005, 0.01, 0.03, 0.05, and 0.10) under 320 nm excitation (a), and the inset shows the relative PL intensity in dependence of the Eu2+ concentration; The values of log(I/x) versus log(x) for the emission bands at 461 nm of KLaSr3−x (PO4)3F:xEu2+ under 320 nm beyond the quenching concentration (b).
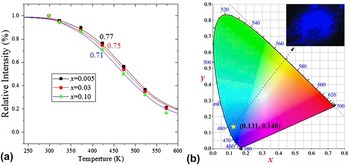
On the one hand, thermal stability is one of the most important properties for phosphors. Reference Zhong, Zhuang, Xing, Liu, Li, Liu and Hu29,Reference Zhang, Cheng, Wu, Guo, Zhuang, Lu, Li and Chen30 KLaSr3−x (PO4)3F:xEu2+ (x = 0.005, 0.03, and 0.10) phosphors were selected for PL measurement under different temperatures ranging from 300 K to 573 K. As shown in Fig. 7(a), the PL intensities of all the samples decrease gradually with temperature. When the temperature increases to 423 K, the emission intensities for KLaSr3−x (PO4)3F:xEu2+ are found to be 0.77 (x = 0.005), 0.75 (x = 0.03), and 0.71 (x = 0.10) of the values at 300 K, respectively. On the other hand, QE is another significant factor for phosphors. Reference Zheng, Wu, Chen, Dang, Zhuang, Guo, Lu, Cheng and Chen31 The absolute QE of KLaSr2.97(PO4)3F:0.03Eu2+ phosphor was investigated. Upon 320 nm excitation, the absolute QE for the phosphor was determined to be 65.20%. The KLaSr3(PO4)3F:Eu2+ have relatively high thermal stability and QE compared with Ca5(PO4)3Cl:Eu2+ phosphor (apatite). Reference Zheng, Wu, Chen, Dang, Zhuang, Guo, Lu, Cheng and Chen31
The relative emission intensities of the selected KLaSr3−x (PO4)3F:xEu2+(x = 0.005, 0.03, and 0.10) sample as a function of temperature in the range from 300 K to 573 K (a); The CIE chromaticity diagram of KLaSr2.97(PO4)3F:0.03Eu2+ phosphor under 320 nm excitation calculated by PL spectrum (b), and the insets shows the digital image of the selected sample under 365 nm UV lamp excitation.

The Commission Internationale de L'Eclairage (CIE) chromaticity diagram of KLaSr2.97(PO4)3F:0.03Eu2+ phosphor under 320 nm excitation calculated by PL spectrum is depicted in Fig. 7(b), and the insets illustrate the digital image of the selected sample under 365 nm UV lamp excitation. It can be easily seen that the CIE values of KLaSr2.97(PO4)3F:0.03Eu2+ is (0.131, 0.140) located in blue region, and the phosphor emits an intense blue emission under 365 nm excitation, which can be detected clearly by the naked eye.
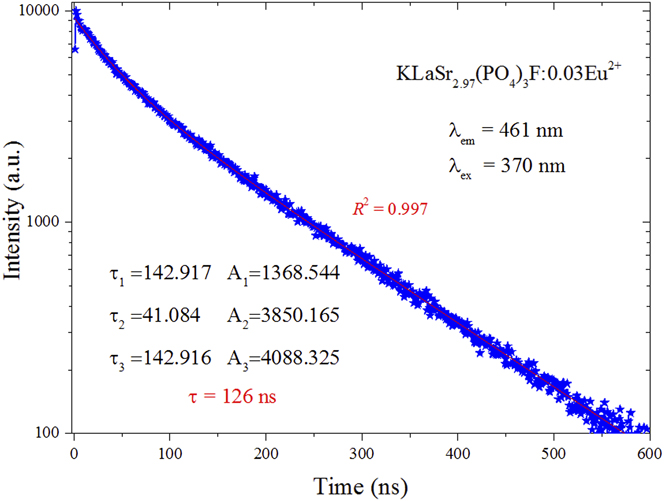
The PL decay curves and lifetimes of Eu2+ for KLaSr2.97(PO4)3F:0.03Eu2+ phosphor under the excitation of 370 nm by monitoring at 461 nm is shown in Fig. 8. The decay curves can be well fitted with a third-order exponential decay mode, which can be expressed as Eq. (5):
 $$I\left( t \right) = {A_1}\exp \left( { - t/{\tau _1}} \right) + {A_2}\exp \left( { - t/{\tau _2}} \right) + {A_3}\exp \left( { - t/{\tau _3}} \right)\quad ,$$
where I(t) is the luminescence intensities at times t, A 1, A 2, and A 3 are fitting constants, and τ1, τ2, and τ3 stand for the decay times for the exponential components. Accordingly, the average lifetimes (τ*) can be calculated based on Eq. (5):
 $${\tau ^*} = {{\left( {{A_1}\tau _1^2 + {A_2}\tau _2^2 + {A_3}\tau _3^2} \right)} \mathord{\left/ {\vphantom {{\left( {{A_1}\tau _1^2 + {A_2}\tau _2^2 + {A_3}\tau _3^2} \right)} {\left( {{A_1}{\tau _1} + {A_2}{\tau _2} + {A_3}{\tau _3}} \right)}}} \right. \kern-\nulldelimiterspace} {\left( {{A_1}{\tau _1} + {A_2}{\tau _2} + {A_3}{\tau _3}} \right)}}\quad .$$
The decay curves of KLaSr2.97(PO4)3F:0.03Eu2+ were measured excited at 370 nm and monitored at 461 nm.
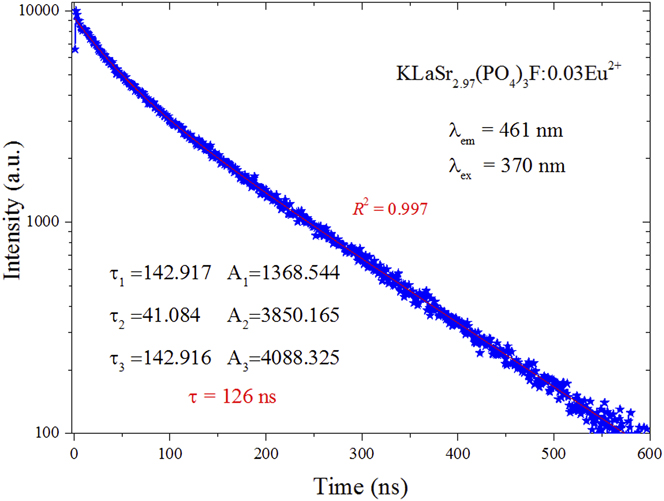
As shown in Fig. 8, the value of R 2 is 0.997, indicating that fitting is relatively good. Therefore, the τ* can be determined as 126 ns according to Eq. (6) by using the fitting values of other parameters. It is true that the lifetime (126 ns) of the KLaSr2.97(PO4)3F:0.03Eu2+ sample is short enough for potential applications in w-LED phosphors.
C. Electroluminescence (EL) spectrum of the self-fabricated LED
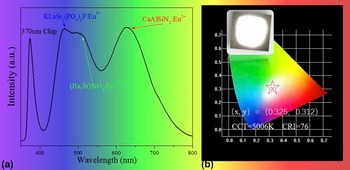
To better understand the potential application of KLaSr3(PO4)3F:Eu2+ phosphor in warm w-LED, a w-LED device was self-fabricated by coating blue-emitting KLaSr3(PO4)3F:0.03Eu2+, green-emitting (Ba,Sr)SiO4:Eu2+, and red-emitting CaAlSiN3:Eu2+ on an 370 nm near-UV chip. Figure 9(a) shows the EL spectrum of the self-fabricated LED device driven by a 60 mA current. The EL spectrum consists of four main emission bands at about 370, 461, 520, and 630 nm, respectively. The band at 370 nm was attributed to 370 near-UV chip, while the other three bands are the three emission peaks of Eu2+ in the three phosphors. The CIE color coordinates of the self-fabricated w-LED device were calculated to be (0.325, 0.312) as illustrated in Fig. 9(b). The inset of Fig. 9(b) shows the image of the LED device in operation. It is clear that the self-fabricated KLaSr3(PO4)3F:Eu2+ phosphor-converted LED device emits bright white light with high CRI value of 76 and appropriate color temperature (CCT) value of 5006 K. All the above results indicated that KLaSr3(PO4)3F:Eu2+ can be used as blue-emitting phosphor for w-LEDs.
The EL spectrum of the self-fabricated LED device driven by a 60 mA current (a); The CIE color coordinates of the self-fabricated w-LED device (b), and the inset shows LED device in operation.

IV. CONCLUSIONS
In summary, the new single-phase KLaSr3−x (PO4)3F:xEu2+ phosphors were prepared by high temperature solid state reaction in a reducing atmosphere for the first time. The KLaSr3(PO4)3F host contains three different crystallographic Sr sites, two La sites, and three K sites. The PLE of KLaSr3−x (PO4)3F:xEu2+ samples have broad band ranging from 225 nm to 450 nm with a maximum at about 320 nm, making them potential phosphors used for w-LED. Upon the excitation of 320 nm, the KLaSr3−x (PO4)3F:xEu2+ phosphors exhibit a wide emission band ranging from 425 to 550 nm. The electric dipole–dipole interactions are mainly responsible for the concentration quenching of Eu2+ ions in KLaSr3−x (PO4)3F:xEu2+. Besides, KLaSr3−x (PO4)3F:xEu2+ phosphors have excellent thermal stabilities and quantum efficiency (65.20%). In addition, a white light LED device was obtained by coating KLaSr3(PO4)3F:Eu2+, commercial green [(Ba,Sr)SiO4:Eu2+] phosphor, and commercial red (CaAlSiN3:Eu2+) phosphor. The CIE color coordinate, CCT, and CRI of the fabricated w-LED device were calculated to be (0.325, 0.312), 5006 K, and 76, respectively. All the results demonstrate that the blue KLaSr3(PO4)3F:Eu2+ phosphor has great potential to be an efficient candidate in the application of w-LEDs.
Conflict of Interest
Author Libing Liao has received research grants from National Natural Science Foundations of China. The authors declare that they have no conflict of interest.
ACKNOWLEDGMENTS
This present work is supported by the National Natural Science Foundations of China (Grant No. 41172053), and Qingfeng Guo thanks Chinese Scholarship Council.