Why did Obama defeat McCain in 2008? As with any national election outcome, the immediate culprit that comes to mind is economic performance. When the U.S. is prosperous, the electorate votes the incumbent presidential party back into office. When the U.S. economy sours, the incumbent (or incumbent party) loses. In 2008, the application of this rule led to a correct prediction once again. Economy up, Republicans out. It is difficult to challenge this conventional wisdom that the economy contributed to the transfer of the White House from the Republicans to Democrat Obama.
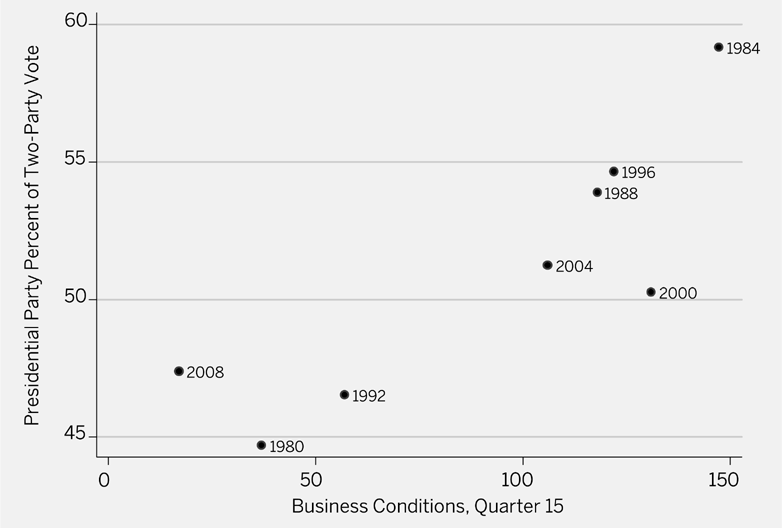
Perhaps the simplest evidence that the economy matters is the relationship between public beliefs about the economy and the vote for president. Figure 1 presents one demonstration. The dependent variable is the vote for the president's party over the eight elections from 1980–2008. The independent variable, from the University of Michigan's Survey of Consumers, is the net response to the survey question whether business conditions have improved or gotten worse over the previous year. The timing of the survey data is for the third quarter of the election year. The correlation (r = +.88) is impressive. From 1980 through 2004 the observations are virtually on a straight line. Only 2000 stands out as an outlier, serving to highlight once again that Gore “should” have won and won handily (not just in a popular-vote squeaker).
Predicting the Vote from Quarter 15 Perceived Current Business Conditions, 1980–2008
Quarter 15 is the third quarter of the election year. The business conditions question was: “Would you say that at the present time business conditions are better or worse than they were a year ago?” The scale is (percent better − percent worse) + 100.

In the third quarter of 2008, even with most readings before the September crash, the public's estimate of business conditions was the worst ever recorded for an election campaign. With the 1980–2004 observations in Figure 1 as a guide, one could have forecast for 2008 a Democratic win of almost 60–40, or true landslide proportions. By this benchmark, losing “only” about 53.7 to 46.3 (as the percent of the two-party vote), McCain got more votes than he “deserved.” Thus the economy mattered, with the only question being why it did not drag down the Republican presidential ticket even more.
THE CAMPAIGN AND ECONOMIC VOTING
It is often said that voters learn about the economy from the campaign. Before the formal campaign starts, potential voters are not thinking much about the connection between economic conditions and their future vote choices. As the campaign evolves, voters begin to take the economy into account. In this way the campaign brings the economy (and other fundamentals) to the voters (Bartels Reference Bartels, Johnston and Brady2006).
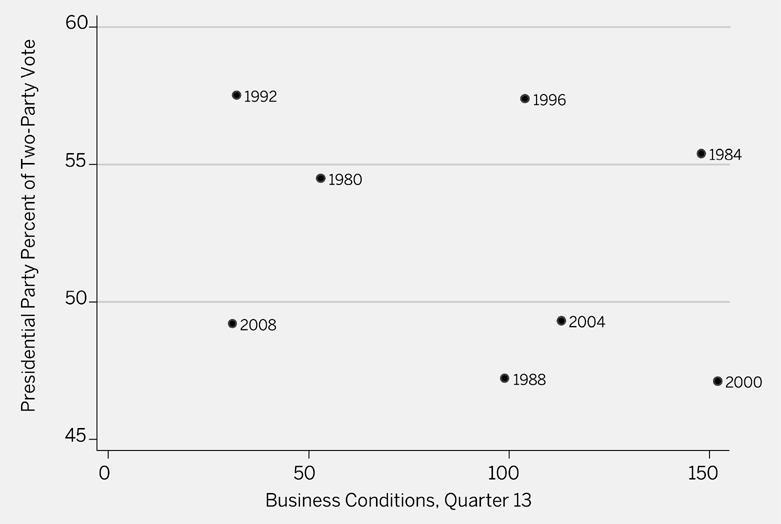
Figure 2 dramatically illustrates the importance of the campaign to generate economic voting. It replicates the scatterplot of Figure 1, this time relating poll results in April of the election year to economic perceptions in the first quarter of the election year.Footnote 1 The relationship between economic perception and vote choice—so strong by Election Day—has not yet made an appearance as of April. In fact, for the eight elections shown in Figure 2, the relationship is slightly negative. While economic perceptions in the first quarter of the election year provide forecasters an early indication of the election result to come, voters in the spring have not yet begun to take the economy into account when asked about their November votes.
Predicting Presidential Preferences in Trial-Heat Polls in Early April from Quarter 13 Perceived Business Conditions, 1980–2008
Quarter 13 is the first quarter of the election year. Trial-heat results are based on trial heats of the eventual candidates averaged for days 200 to 215 before Election Day. The business conditions question was: “Would you say that at the present time business conditions are better or worse than they were a year ago?” The scale is (percent better − percent worse) + 100.

Somehow, as the campaign evolves, the electorate begins to shift its vote in the direction of its assessment of economic conditions—toward the incumbent party if favorable, against if not. We might expect that we can observe this shift as a time series. As the economic outlook changes day to day, so might the presidential polls. For most election years such an exercise can only be a dream because there is not the density of polling to measure movement on anything like a daily basis. And for most years, there are no great sudden shifts in the economy that could register a voter upheaval.
The 2008 campaign provides an exception on both grounds. The economic meltdown of mid-September led an already pessimistic public to get more negative in its economic evaluation. Meanwhile McCain lost support in the polls. From September 15 through November 4, we have daily readings of both economic opinion and the election polls.
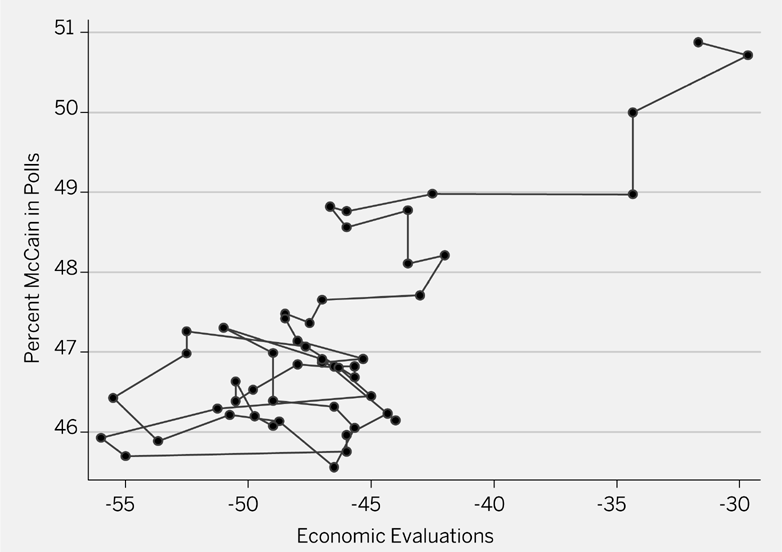
Figure 3 provides the time series. The x axis shows the electorate's net belief about the economy. The scale is percent claiming the economy is “excellent” or “good” minus the proportion saying it is “poor.” (“Fair” is the in-between option.) The vote estimate is the RealClearPolitics (RCP) average for McCain (transformed into a two-party vote) for the date. Because the RCP measure is an average of recent polls from different houses, I matched each date's average vote with the average economic evaluation in polls conducted three days earlier.
Vote by Economic Evaluations, September 15–November 4, 2008; Daily Readings
Vote is McCain's percent of the two-party vote in the RealClearPolitics average reported for the date. Economic evaluations are averaged percent excellent or good minus percent poor in polls reported at Pollster.com, lagged three days. Economic evaluations are averages of each poll encompassing the date.

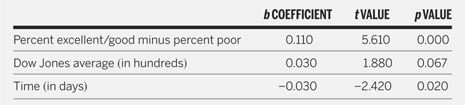
Note the positive relationship. The evidence begins on September 15 (in the upper-right-hand corner) back when McCain was competitive. It ends in the cloud of observations on the lower left. As perceptions of the economy sank, so did McCain's fortunes in the polls. Interestingly a further regression analysis, shown in Table 1, suggests that economic evaluations were causally responsible for the vote shift. The equation predicted the daily trial-heat poll margins from economic evaluations plus the latest Dow Jones closing average and a time trend. Economic perceptions and (to a lesser extent) time are statistically significant. The Dow Jones average does not quite pass the significance test. The downward slide of McCain's poll numbers was a direct response to the public's growing economic pessimism.
Predicting the Daily Vote, September 15–November 4, 2008

N = 54. Adjusted R-squared = .809. Intercept not shown. Economic evaluations and Dow Jones average are lagged three days since the RealClearPolitics vote average is based on reported past polls.
So far we have seen that the economy matters and affects the trajectory of the intended vote over the course of the campaign. The lesson is not to force the untenable idea that the economy accounts for all or nearly all the variance in the vote. It is sufficient to show that the degree of economic prosperity conditions the electoral success of the presidential party. Of that fact there can be little doubt. Less clear is the process by which the economy shapes presidential outcomes.
Understanding the causal mechanism by which voters respond to the economy requires an understanding of voter psychology. A key aspect is the level of sophistication that drives the collective decisions of voters when they, in some fashion, respond to the economy. At one extreme, we can envision voters behaving as primitive peasants, rewarding or punishing the government for the quality of their lives void of any thought either of whether the government is responsible or about the economic consequences of their actions other than simple retrospection. At the other extreme, voters act as rational economic actors guiding future government policy strategically by their thoughtful electoral decisions.
A BASELINE MODEL
The obvious starting point to model economic voting would be to have voters overtly deciding how to cast their ballots directly based from their assessments of the economy. We can imagine our voters asking, as Election Day approaches, “how is the economy doing?” If they see the economy as looking good or getting better, they vote to return the incumbent party to office. If they observe it to be bad or getting worse, they vote to throw the incumbent party out. The key for our baseline model is that no more is required of the voter other than the ability to discern the goodness or badness of the times. The content of policy is irrelevant. This baseline model traces back to the American Voter (Campbell et al. Reference Campbell, Converse, Miller and Stokes1960) authors who were receptive to the idea that electoral change could be driven by assessments of presidential performance by the least politically aware segment of the electorate. For instance, Angus Campbell (Reference Campbell1964, 755) explains the 1952 electoral tide sweeping Republican Dwight Eisenhower into office after 20 years of Democratic presidents: “The voters were not asking for any specific platform of legislation; they just wanted a new bunch of fellows to run things better.” If that explanation fit in the past, was the voters' logic in 2008 equally simple?
This baseline model is reinforced by standard interpretations of macro-level models of the vote. Forecasters typically model the vote as a function of the economy often accompanied by presidential approval or a measure of relative liking of the two major-party candidates. (e.g., Tufte Reference Tufte1978; Erikson Reference Erikson1989). The high R-squareds can imply that the independent variables of the model correctly target the major causes of voter decision making—as if voters decide by asking how things are going economically plus who they like and don't like among the candidates.
We could ask which voters are the deciders—switching party choice in elections based on their economic assessments. The evidence is not all reassuring. Zaller (Reference Zaller, Saris and Sniderman2004) shows that the floating voters who switch their votes from one election to the next based on the economy tend to be at the lower end of the knowledge ladder. Thus, it is possible that the voters who are most ignorant about the economy are the ones deciding based on the economy.
A strong theoretical basis exists for Zaller's result. As The American Voter (Campbell et al. Reference Campbell, Converse, Miller and Stokes1960) describes the process (updated by Lewis-Beck et al. Reference Lewis-Beck, Jacoby, Norpoth and Weisberg2008), while the most attentive voters hold steady partisan attitudes, the less attentive voters are stimulated by “short-term forces” to become floating voters. This is The American Voter's classic “nature of the times” model at work. Among nature-of-the-times types, their level of political cognition is no higher than their evaluation of the parties' and candidates' recent performances.
So we have unsophisticated voters responding to imperfect estimates of the economy, thereby deciding elections. If this scenario makes one uncomfortable with how democratic accountability works, it can get worse. Bartels's (Reference Bartels2008) Unequal Democracy reports that when one relates the national vote to national income growth, it is the income growth of the highest-income voters that matters the most. If this finding holds up to further scrutiny, it means that the least knowledgeable voters are somehow convinced to decide elections in such a way as to reward or punish the incumbent party based on how it treats the economic interests of the wealthy.
The defining aspect of this baseline model is that voters, perhaps consciously, decide how to vote based on economic results, not policy content. Their cognition goes, “I vote this way because of economic conditions.” As the vast literature on economic voting shows, the baseline model can come in many flavors. According to the current state of the literature (see Lewis-Beck and Stegmaier Reference Lewis-Beck and Stegmaier2000 for one review), voters respond somewhat rationally to the economy. They do not respond directly to their personal financial situation (“pocketbook voting”), which would make little sense because most economic fortune cannot be attributed to government decision making. Instead, voters respond sociotropically to their perceptions of the economy as a whole. Sociotropic voting is more uplifting. If it does not mean that voters are altruistic (still one credible interpretation), it means that voters judge their personal successes or failures at the government's hands on the degree to which the economy rises or falls—lifting or sinking all boats, including their own.
One debate has been whether voters are entirely retrospective, when voting on the economy, or prospective, based on their evaluations of the future. And if they learn information about the future apart from past performance, do they incorporate this information when they vote or do they throw it away? Put simply, do voters see the economic future at all or are their visions confined, in the mode of adaptive expectations, to information from the past? Much of the literature takes the position that to the extent voters are retrospective (that is, take the recent economic history into account), they do so for prospective reasons.Footnote 2
Not all analysts subscribe to this consensus. One can find serious researchers (e.g., Achen and Bartels Reference Achen and Bartels2002; Bartels Reference Bartels2008) who view economic voting as primitive retrospective behavior. Clearly there are varieties of the basic model, depending perhaps in part on what one prefers to think are the cognitive capabilities of our typical voter. The key point of the basic model is that it has the economic voter directly observe the economy and vote according to its positive or negative valence. There remains a stubborn variation in how thorough and sophisticated this process would be. Conceivably, economic voters could be reasonably rational actors, making good use of the information at hand, or they could be the proverbial peasants with pitchforks, responding to primitive emotional reactions to events, void of serious consideration of attribution or consequence.
INDIRECT EFFECTS: THE MACRO POLITY STORY
In this section I present an alternative to the baseline model. The baseline model has voters acting as politically neutral economic observers who vote passively for the economy when times are good but against it when times are bad, responding to economic conditions independent of their partisan or ideological beliefs. Instead, suppose that the economy affects voters more indirectly. By this alternative model, voters still are influenced directly by the economy but they respond by changing their partisan or ideological beliefs. In turn, these changed beliefs influence the vote. For instance, consider the possible future scenarios about how the Obama presidency will affect the 2012 election. By scenario A, Obama's policies will turn the economy around and he will be hailed as a savior. If so, people will find reason to hold allegiance to the Democrats and/or to accept the liberal agenda for economic recovery. These shifts in opinion would lead to voting for the incumbent presidential party following a period of relative prosperity. Suppose we have scenario B where the economy fails to recover and Obama's programs are seen by the public as a failure. The public would turn sour on the Democrats and reject liberal economic policies. These shifts in opinion would result in votes for the out party following an economic downturn.
To the extent prosperity increases, voters learn to believe that the presidential party protects their interests. To the extent prosperity increases, voters learn that the ideological agenda of the presidential party makes sense. Is there any evidence for this view? If we turn to the macro level of analysis, we can find a surprising and perhaps compelling degree of support.
In the Macro Polity (Erikson, Mackuen, and Stimson Reference Erikson, Mackuen and Stimson2002), our team introduces a macro-level model of the vote that traces to standard micro-level modeling of the vote but without the economy as part. This standard model for micro-analysis of surveys has the vote as a function of party identification plus its relative policy proximity to the candidates. The macro-level extension has macro-partisanship, Stimson's mood,Footnote 3 plus a measure of the parties' mean platform ideological positions as proxies for perceived party positions. The Democratic vote rises with Democratic partisanship, liberal mood, and conservative platforms. (The combination of mood and platform effects can be thought of as the proxy for relative candidate proximity.)
The model works remarkably well, explaining 93% of the variance in the vote from 1952–1996 and 91% through 2004, with all three variables highly significant. While the data for 2008 are not yet ready to input, undoubtedly they will be consistent with this model, given recent rises in Democratic partisanship and mood.Footnote 4
But what about the economy? As described in Erikson et al. (Reference Erikson, Mackuen and Stimson2002), the economic effect is encompassed by the variables of the Macro Polity model. When the predictions of the presidential party vote from the economic model are transformed into predictions of the Democratic vote, they do not significantly add to the vote predictions from the Macro Polity model. Where did the economy go?
What we know is that predictions from the economy and from the Macro Polity model go together. For instance, the 1956–2004 predictions based on third-quarter perceived business conditions correlate with the Macro Polity predictions of the election result at .70, almost as large as their correlation with the election result itself.Footnote 5 Speculatively, economic conditions do much of their work via affecting peoples' partisan and ideological tastes.
With only 14 or 15 cases, we can go only so far in terms of tying the economy to partisanship and policy preferences. While the data suggest a connection, this is not to say it must be the only connection. The Macro Polity model of economic voting can coexist with the tradition baseline model. The difference is that the former implies intervening attitude adjustments in terms of partisanship or ideology between economic cognitions and the vote, while the latter does not.
CONCLUSIONS
This article has attempted to put into perspective the role of the economy in the 2008 election. Much more will be learned as survey data from the 2008 campaign are analyzed. While there is a lot that we think we know about economics and the vote that can be applied to the case of 2008, there interestingly remains a lot that we do not fully understand about how voters respond to the economy.
Imagine that instead of being in 2009 we were back in the dark economic climate in the aftermath of the 1932 election of Franklin Roosevelt as president. While people generally were wondering what would happen next with the economy, politically attuned observers must have also been asking what the political consequences would be. Those observers would have learned a lot by the time of the Roosevelt's 1936 reelection. In 2009 we face a similar position. We wonder not only about the economic but also the political future. By 2012 the changing circumstances should allow the focus to be clearer concerning how voters respond to changes in economic conditions.