

Introduction
Cancer therapy is a multi-modal process that nowadays almost always involves local and systemic therapies. Systemic therapies beyond chemotherapy such as targeted therapy (Ref. Reference Zhong1) and especially immunotherapy (Ref. Reference Gonzales Carazas, Pinto and Casado2) have recently enormously progressed. Radiotherapy, the non-invasive local treatment for the primary tumour, has also evolved remarkably thanks to improved image-guidance and to accelerated charged particles (Ref. Reference Durante, Debus and Loeffler3), which make the treatment more safe and effective. Because radiation may elicit an immune reaction (Refs Reference Formenti and Demaria4, Reference Abuodeh, Venkat and Kim5), it has been proposed that it can be the ideal partner in combination with checkpoint inhibitors (Refs Reference Ngwa6, Reference Grassberger7). This hypothesis has been supported by recent clinical trials in non-small-cell lung cancer (NSCLC) (Refs Reference Faivre-Finn8, Reference Antonia9), prostate (Ref. Reference Fizazi10) and pancreas cancer (Ref. Reference Zhu11), reporting improved overall survival or progression-free survival in patients treated with a combination of immunotherapy and radiotherapy, compared to patients receiving radiotherapy alone. However, despite these successes, the mortality of these patients remains high, and other trials gave disappointing results (Refs Reference Theelen12, Reference Reardon13). Many patients do not respond, or their response is short. Identifying those patients that have higher benefit from the combined treatment, apparently those with low-baseline PD-L1 expression (Ref. Reference Breen14) or increased serum interferon-β (Ref. Reference Formenti15).
Improving combination therapy strongly depends on a deeper understanding of the molecular mechanisms underlying the possible synergism between immunotherapy and radiotherapy. While many of these studies are ongoing (Refs Reference Yu16, Reference Hou17), we will focus here on accelerated charged particles. Even if only a small fraction of cancer patients are treated with charged particles, the field is rapidly growing with excellent results (Ref. Reference Durante, Orecchia and Loeffler18). Particle radiation has both physical and biological differences compared to X-rays. Both have an impact on the interaction of the radiotherapy treatment with drugs. An appropriate choice of the molecule, of the radiation dose and of the timing of radiation and drug deliver is of critical importance to improve the success rate in combination treatments.
Molecular radiobiology of high- and low-LET radiation
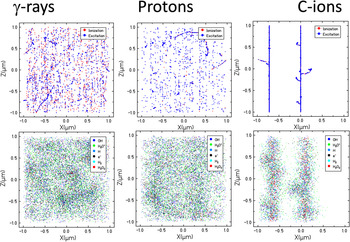
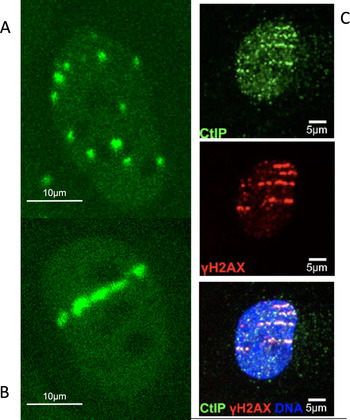
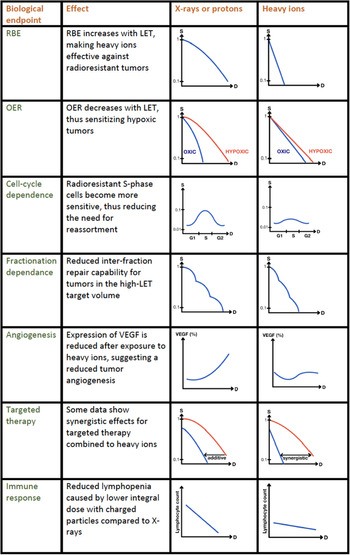
In radiotherapy it is often assumed that all charged particles have high linear energy transfer (LET), being therefore densely ionising, whereas X-rays have low-LET and are sparsely ionising (Fig. 1). DNA lesions induced by sparsely ionising radiation are ‘simple’ and can be easily repaired, while those induced by particles are ‘clustered’ (or ‘complex’) and are difficult to repair (Fig. 2). The impaired DNA repair leads eventually to a number of distinct biological consequences (Fig. 3) that make particles drastically different from X-rays. This classical dogma is an oversimplification that can lead to wrong conclusions. The definition itself of ‘clustered’ or ‘complex’ DNA lesions is somehow vague, and generally defined in detail only in Monte Carlo simulations, where a precise definition is needed for counting DNA breaks of different types (Refs Reference Nikjoo19, Reference Douglass, Bezak and Penfold20). In general, as shown in Figure 2, for clustered lesions we mean a localised presence of different DNA lesions (one or more double-strand breaks (DSBs), single-strand breaks, or base damages), within one helical turn (10 base pairs) or one nucleosome (around 10 nm). But the damage density is dependent on many physical and biological characteristics.
Simulation of ionisation/excitation events (upper row; physical stage) and production of free radicals (bottom row; chemical stage) after a dose of 2 Gy in a 10 μm3 volume. The distribution of reactive species is described at a time of 1 μs, the approximate duration of the chemical stage, assuming that the tracks appear simultaneously in the volume. Left column: γ-rays (LET in water = 0.2 keV/μm). Middle column: 200 MeV protons (LET in water = 0.45 keV/μm). Right column 80 MeV/n 12C-ions (LET in water = 31 keV/μm). Simulation by Monte Carlo code TRAX courtesy of Dr Daria Boscolo.

Impact of track structure on DNA damage in U2OS osteosarcoma cells. The left panels show the different distribution of the DSB, visualised by the 53BP1 repair protein recruitment, after exposure to sparsely and densely ionising radiation. (a) X-rays (LET in water = 2 keV/μm). (b) 15 MeV/n C-ions (LET in water = 122 keV/μm). (c). Demonstration of the use of the DNA resection pathway after exposure to very heavy ions (11 MeV/n 238U-ions, LET in water = 10 000 keV/μm), producing very clustered DSB. The three pictures show immunofluorescence with CtIP (marker of resection), γH2AX (marker of DSB) and fused image. Cells were fixed 30 min after exposure. Plots from GSI collection, courtesy of Dr Burkhard Jakob.

Differences in biological effects between sparsely and densely ionising radiation. S, survival; D, dose; RBE, relative biological effectiveness; OER, oxygen enhancement ratio; VEGF, vascular endothelial growth factor. Figure from (Ref. Reference Durante, Debus and Loeffler3), reproduced with permission of Nature Publishing Group.

First of all, not all particles are densely ionising: it depends on their energy and charge (Fig. 1) (Ref. Reference Durante and Paganetti21). Protons, the most used charged particle in radiotherapy nowadays (Ref. Reference DeLaney22), have for instance an LET close to that of X-rays in most of the irradiated volume. Neutrons, used in the past for radiotherapy (Ref. Reference Specht23), have high-LET everywhere, both in the normal tissue and in the tumour. Carbon ions were selected for radiotherapy in Japan (Ref. Reference Kamada24) and Europe (Ref. Reference Kraft25) because they have a relatively low-LET in the entrance channel (normal tissue) and quite high in the tumour (target region) (Ref. Reference Durante, Debus and Loeffler3). Ions as heavy as 20Ne were used in the past at the Lawrence Berkeley Laboratory (Ref. Reference Linstadt, Castro and Phillips26), but the use of ions heavier than oxygen increases the risk of high-LET toxicity in the normal tissue, similarly to the problems that led to the discontinuation of fast neutron therapy. Consequently, radiobiology of protons, carbon or oxygen ions, neutrons or α-particles are all different, and it should be mentioned that even for X-rays the megavoltage photons have different properties than orthovoltage tubes, as it became clear in the clinical practice with the introduction of the high-energy linacs.
In the context of the current particle radiotherapy worldwide, limited to protons and carbon ions (and soon oxygen and helium ions ion at the Heidelberg Ion Therapy centre (Ref. Reference Dokic27)), it is more appropriate to talk of low to moderate LET. There is no doubt that even at these values charged particles kill the same number of cells with a lower dose than for X-rays (the relative biological effectiveness (RBE) – see first panel in Fig. 3). It is also clear that, at least for light (Refs Reference Limsirichaikul28, Reference Oike29, Reference Bobkova30) and very heavy ions (Refs Reference Asaithamby, Hu and Chen31, Reference Splinter32) there is indeed a higher fraction of clustered DNA lesions that can contribute to their increased RBE. Nevertheless, mammalian cells rejoin very efficiently the DNA DSBs produced by therapeutic beams of protons (Ref. Reference Ibañez33) or carbon ions (Ref. Reference Averbeck34). It is likely that the increased RBE observed in clinical practice derives by a different dose distribution pattern both at the nm- and at the μm-level, as reflected by chromosome aberration studies (Ref. Reference Cornforth35).
DNA repair pathways
In combination therapy, the question is whether the different radiation quality (Fig. 2) translates into different DNA damage signalling pathways, thus opening distinct opportunities for targeting with specific molecules. Because DNA repair is a typical target for small molecule therapies (Ref. Reference Huang and Zhou36) and is involved in response to immunotherapy (Ref. Reference Pilger, Seymour and Jackson37), we will focus here on the DNA damage-repair pathways after low- and high-LET radiation.
The two main DNA DSB repair pathways are non-homologous end joining (NHEJ) and homologous recombination (HR), the latter only active in S and G2-phases of the cell cycle. It has been hypothesised that the production of DSB clusters by densely ionising radiation triggers alternative, error-prone DNA damage repair (DDR) pathways (Refs Reference Iliakis, Mladenov and Mladenova38, Reference Yajima39, Reference Iliakis, Murmann and Soni40), sometimes named alt-NHEJ or slow subpathway of the canonical NHEJ (c-NHEJ) (Ref. Reference Shibata and Jeggo41). A known alternative NHEJ pathway exploits DNA end-resection followed by microhomology-mediated recombination (Ref. Reference Sallmyr and Tomkinson42). The microhomology pathway is intrinsically error-prone and may lead to the formation of translocations (Refs Reference Zhang and Jasin43, Reference Lee-Theilen44). Whilst resection is used in S/G2-phases as part of HR, it is never used in canonical G1-phase DDR pathway. It has been shown that resection in G1 increases with LET, but it is significantly high only at LET exceeding 100 keV/μm (Fig. 2c) (Ref. Reference Averbeck45). Therefore, a large fraction of DSB induced by charged particles is still processed by c-NHEJ, similarly to X-rays.
Some data show that mammalian cells resort more often to HR than NHEJ to process clustered DNA lesions (Refs Reference Jeggo, Geuting and Löbrich46, Reference Nickoloff, Sharma and Taylor47, Reference van de Kamp48). Surprisingly, measuring DSB repair kinetics in repair-deficient cell lines, some authors found that after proton therapy (low-LET, similar to X-rays), there was an almost complete shift from NHEJ to HR (Refs Reference Fontana49, Reference Grosse50, Reference Deycmar51). While little differences are observed between C-ions and X-rays in the DNA repair pathway choice (Ref. Reference Gerelchuluun52), even smaller should be observed between protons and photons. The situation is further complicated by recent observations that the pathway repair choice may be dose-dependent, with more breaks being processed by NHEJ at high doses, when HR becomes saturated (Ref. Reference Soni53).
The repair pathway choice is an important point to clarify in particle therapy, because it directly affects the therapeutic strategy: should HR inhibitors be used in particle therapy, rather than NHEJ inhibitors? If true, charged particles should be very effective against cancers with HR defects, which are indeed very sensitive to PARP-inhibitors (Refs Reference Dias54, Reference Curtin55). Despite some evidence shown above, mostly from a single laboratory, the current data do not really support this hypothesis: most data show that NHEJ inhibitors are more effective than HR inhibitors after heavy ion irradiation (Refs Reference Takahashi56, Reference Ma57, Reference Liu58). The potentially different DNA repair pathway choice remains, however, a very important issue that starts to be addressed also with in vivo models (Ref. Reference Zhou59).
Epigenetic regulation of DNA repair
Beyond the proteins directly involved in DNA DSB rejoining, it is possible that epigenetic regulation of DNA repair (Refs Reference Christmann and Kaina60, Reference Fernandez61) is radiation-quality-dependent. DNA methylation pattern of cells surviving exposure to charged particles or X-rays is apparently significantly different (Ref. Reference Goetz, Morgan and Baulch62), and in some cases hypermethylation was observed after X-rays and hypomethylation after exposure to high-LET Fe-ions (Ref. Reference Aypar, Morgan and Baulch63). However, a recent comprehensive review of the published data (Ref. Reference Miousse, Kutanzi and Koturbash64) shows a very complex picture of methylation after exposure to low- or high-LET radiation, and especially the importance of specific methylation or demethylation in selected genes or repetitive elements, making therapeutic targeting of methylation after particle irradiation still baffling. The studies were performed at doses <5 Gy, and the comparison between high- and low-LET radiation was generally carried out at iso-survival dose levels.
The ubiquitin proteasome pathway is also involved in DNA repair. Recently it has been shown that histone H2B ubiquitylation promotes repair of clustered DNA lesions, thus leading to improved survival after exposure to high-LET radiation (Ref. Reference Carter65). Therefore, targeting ubiquitination pattern can sensitise the tumour (high-LET) but not the normal tissue (low-LET) during heavy ion therapy, thus widening the therapeutic window. In this context, it is very interesting that silencing ubiquitin-specific protease 9X (USP9X) increase killing of cancer cells with α-particles and slow protons, while has no impact on fast (low-LET protons) (Ref. Reference Nickson66).
Ubiquitination can indeed be a key pathway in processing DNA lesions induced by high-LET radiation. Resection-relevant factors such as CtIP (Fig. 2c) become ubiquitinated in order to orchestrate their presence at DSBs (Ref. Reference Himmels and Sartori67). RNF138 ubiquitin ligase is needed to remove the resection antagonist Ku80 from DSBs and to recruit the resection factor CtIP to DSBs (Ref. Reference Schmidt68). Moreover, ubiquitination is a key process in base excision repair (BER) (Refs Reference Grundy and Parsons69, Reference Hughes and Parsons70). BER seems to be involved in a sub-class of DSB generated by charged particles, that are visualised with a substantial delay compared to prompt DSB in live cell microscopy (Ref. Reference Jakob71). The delay in the recruitment of DNA DSB repair proteins has been observed after exposure to ultra-soft X-rays (Ref. Reference Kochan72). Using high-energy heavy ions, live cell imaging shows prompt DNA DSB repair protein recruitment along the primary track (Fig. 2b) but the lesions produced by secondary electrons (δ-rays) are delayed, possibly because they are processed by BER and transformed in DSBs (Ref. Reference Jakob73). Taken together, these results suggest that ubiquitination can be a key epigenetic pathway for targeting in particle therapy.
Little is known about the role of acetylation in DNA repair after radiation of different qualities (Ref. Reference Averbeck and Durante74), but it has been recently shown that histone deacetylase inhibitors seem to enhance cell death more effectively after proton (Ref. Reference Choi75) or carbon ion (Ref. Reference Ferrari76) irradiation than after X-rays.
Targeted therapies different from DNA damage response
In addition to DNA damage, monoclonal antibodies or small molecules can be used to target other pathways associated to radioresistance, such as hypoxia-inducible factor 1 (HIF-1) and vascular endothelial growth factor (VEGF), involved in hypoxia; epidermal growth factor receptor and PI3K/AKT/mTOR pathway that improve proliferation and evade cell death; heat shock protein 90, NFκB- and Hedgehog-signalling pathway, promoting resistance to stress and inhibiting apoptosis. Many of these pathways are targeted in conventional radiotherapy (Ref. Reference Selzer and Kornek77) and pre-clinical radiobiology research is acknowledged as essential to improve the therapeutic combinations (Ref. Reference Wilson, Bentzen and Harari78). Some radiobiological data are available also with charged particles and have been recently elegantly summarised in (Ref. Reference Konings79), so the reader is referred to that review for a comprehensive list of the data. Considering the use of different particles, doses, fractionation, drugs, concentrations and biological systems, it is not surprising that a review of the total results does not show any evidence of a special behaviour of charged particles in combination with targeted therapies, in comparison with X-rays. Generally speaking, charged particles offer the physical advantage of a reduced integral dose. Therefore, drugs that synergise with radiation damage and cannot be specifically targeted in the tumour will be used more safely in a particle therapy setting, simply because less normal tissue is irradiated. From the biological differences, we have discussed above how different qualities of DNA lesions can help selecting appropriate small molecules in combination with particles. For the other pathways, it is not clear whether they are really different between high- and low-LET radiation. Again, the choice should be guided by radiobiology. For instance, HIF-1 or VEGF inhibitors are still useful in particle irradiation but can be more advantageous for protons than for C-ions, because high-LET heavy ions can overcome hypoxia at the physico-chemical stage (Ref. Reference Scifoni80). On the other hand, because C-ions can induce p53-independent apoptosis (Refs Reference Mori81, Reference Maalouf82), targeting pathways blocking apoptosis can work effectively in p53-mutated tumours exposed to heavy ions.
Immunotherapy: physical parameters
In the Introduction, we have discussed the clinical trials combining radiotherapy to immunotherapy using checkpoint inhibitors, that is, drugs targeting PD-1, PD-L1 or CTLA-4. Considering the promising results of the combination of X-rays with checkpoint inhibitors, the question is whether particle therapy can present additional advantages, and result in better outcomes (Refs Reference Durante, Brenner and Formenti83, Reference Van Limbergen84).
Particle therapy was historically introduced by physicists, looking at the favourable depth-dose distribution provided by the Bragg peak. This results in a much lower number of beams needed in particle therapy compared to photon radiotherapy, especially the modern techniques where the high conformity is obtained at the expenses of large dose baths in the patient normal tissue. The sparing of normal tissue may represent per se an advantage of particle therapy in combination with immunotherapy. In fact, more immune cells of the patient survive and can be exploited to enkindle a systemic response against the invasive malignancy (Refs Reference Durante and Formenti85, Reference Lambin86). This hypothesis is supported by the observation of reduced lymphopenia in oesophageal cancer treated with protons (Ref. Reference Davuluri87) or C-ions (Ref. Reference Durante88) compared to conventional X-ray therapy. Recent studies have shown reduced lymphopenia after proton therapy in patients treated for glioblastoma (Ref. Reference Mohan89), NSCLC (Ref. Reference Kim90) and hepatocellular carcinoma (Ref. Reference De91). As lymphopenia is often a negative prognostic factor for cancer patients (Refs Reference Venkatesulu92, Reference Chen93), this is an interesting working hypothesis that remains to be verified in clinical trials.
Along similar lines, experimental data highlight the importance of the draining lymph nodes in immunotherapy and the relevance of sparing during irradiation (Refs Reference Fransen94, Reference Marciscano95). Therefore, sparing draining lymph nodes is particularly attractive, and requires a high-precision treatment, only attainable exploiting the Bragg peak.
Another physical advantage of particle therapy is that it makes easier hypofractionation even in tumours of moderate size, again thanks to increased sparing of the normal tissue. But is immune response better stimulated by few, high-dose fractions, or many low-dose fractions? A few pre-clinical studies address the impact of fractionation regime on the immune response (Refs Reference Walshaw, Honeychurch and Illidge96, Reference Demaria and Formenti97, Reference Formenti98, Reference Dewan99, Reference Schaue100, Reference Reijmen101), and in most cases the dose per fraction is much higher than conventional 1.8–2 Gy used in clinical practice. Most of the data suggest that moderate dose per fraction (such as 3 × 8 Gy) elicit stronger systemic responses than single high doses. However, in a recent study where mice carrying mammary or colorectal cancers were irradiated with different fractions spanning from 9 × 4 to 1 × 20 Gy, it was shown that low- and high-dose per fraction had different effects depending on the ability of the tumours to activate Treg response (Ref. Reference Sia102). Interestingly, it was shown that a biologically effective dose (BED) >36 Gy was necessary to elicit anti-tumour NK cell response independently of the dose per fraction, but 1 × 20 Gy shows better synergism with anti-PD-1 than 9 × 4 Gy, even if the two schedules have similar BED. This reflects the importance of both tumour and stroma in the response to radioimmunotherapy. In fact, in a lung adenocarcinoma mouse model, it was shown that high dose (3 × 12 Gy) to the tumour combined with low dose (2 × 1 Gy) to the secondary tumour 3 days after the first irradiation gave optimal results in combination with anti-CTLA-4 and anti-PD1 (Ref. Reference Barsoumian103). Moreover, low-dose (0.5–2 Gy) whole abdominal radiotherapy induces immune-cell infiltration and increase response to immunotherapy in a murine ovarian cancer model (Ref. Reference Herrera104). Taken together, the data seem to suggest that both high doses and low doses are important, and in this repose a combination of a particle boost with low-dose conventional irradiation can be an interesting strategy.
Immunotherapy: biological differences
Ionising radiation alone can elicit a potent immune response (abscopal effect (Ref. Reference Abuodeh, Venkat and Kim5)), but unfortunately this systemic effect is seldom and generally overwhelmed by anti-immunity signals associated to radiation exposure. Immunotherapy is supposed to potentiate and stabilise immune response (Ref. Reference Ngwa6). Beyond the Bragg peak physical advantages, the question remains whether particles can potentiate immunotherapy more than protons or X-rays exploiting the unique high-LET radiobiology described in Figure 3.
The first basis of the potential biological difference is again related to DNA repair mechanisms, discussed above. In fact, accumulating evidence shows that DDR signalling is involved in immune response modulation (Refs Reference Chabanon105, Reference Uchihara106). The expression of PD-L1 in cancer cells is upregulated in response to DNA DSB through the ATM/ATR/Chk1 kinase pathway (Ref. Reference Sato107). Similar upregulation of PD-L1 has been recently shown in melanoma cells exposed to UV radiation (Ref. Reference Wang108). The PD-L1 upregulation has also been recently shown in samples from patients treated with C-ions for uterine adenocarcinoma, compared to the expression before radiotherapy (Ref. Reference Iijima109). Activation of different DNA damage response pathways at high-LET, such as resection (Ref. Reference Roobol110), may have different effects on the expression of immune receptors. It is presently not known whether the radiation-induced upregulation of PD-L1 will actually translate into response to checkpoint inhibitors, but certainly this topic deserves a great attention (Ref. Reference Shevtsov111).
Recently, the development of certain cyclin-dependent kinase 4 (CDK4) and CDK6 inhibitors and their application in trials on oestrogen receptor-positive breast cancer or other solid tumours have raised the interest in CDK4/6 as targets for molecular therapy (Ref. Reference Petroni112). Pre-clinical data suggest a potential for combination with radiotherapy (Refs Reference Hashizume113, Reference Fernández-Aroca114). A recent study underlines such potential even in cells lacking p53 (Ref. Reference Petroni115), hence pointing to a combination with C-ions, which can induce p53-independent apoptosis as described above.
The immunogenicity of a (radiation-)induced cell death, that is, the ability of the cell death mode to drive adaptive immunity (Ref. Reference Galluzzi116), depends on the related adjuvanticity and antigenicity.
Adjuvanticity describes the release of danger signals, referred to as damage-associated molecular patterns (DAMPs), leading to recruitment and maturation of antigen-presenting cells (APCs) with ATP, calreticulin (CRT) and high mobility group box 1 (HMGB1) representing the most prominent among them. Golden et al. (Ref. Reference Golden117) have shown that photon radiation results in an increased release (HMGB1, ATP) or presentation on the cell surface (CRT) of DAMPs. Only a few studies have addressed the adjuvanticity of charged particle radiation in vitro. The immunogenic modulation of protons with respect to CRT presentation has been described being comparable to photons (Ref. Reference Gameiro118). Following exposure to physical isodoses of photons, protons or C-ions, a differential pattern was reported as compared to protons and photons, with C-ions being more effective at certain doses (Ref. Reference Huang119). A higher efficiency in CRT translocation induction was described also elsewhere (Ref. Reference Ando120). Along similar lines, C-ions were reported to induce HMGB1 release at levels comparable or partly even more efficient as compared to photons when iso-effective doses with respect to clonogenic cell survival were tested (Refs Reference Ando120, Reference Yoshimoto121). Onishi et al. (Ref. Reference Onishi122) reported an increased release of HMGB1 with a higher LET when comparing typical LET values for entrance channel or SOBP. This underlines the potential especially of C-ions with respect to adjuvanticity and a putative subsequent immune response. Of note, Takahashi et al. found increased levels of HMGB1 in the serum of mice bearing LM8 osteosarcoma tumours 14 days following tumour treatment with 5.3 Gy of C-ions (Ref. Reference Takahashi123).
Antigenicity is the second important component of immunogenicity (Ref. Reference Galluzzi116) with respect to irradiation that refers to the neoantigen repertoire, increasing the mutational burden of a tumour, capable of triggering an immune response. It is well known that the cancer mutational burden is essential for the response to checkpoint inhibitors, and tumours with low neoantigen burden are resistant to immunotherapy (Refs Reference Rizvi124, Reference Lhuillier125). DNA misrepair of radiation-induced DSB generates mutations, and in fact irradiation induces mutations in tumour cells lacking neoantigens that function as targets for CD8+T cells, resulting in increased immunogenicity of tumour cells (Ref. Reference Lussier126). Because charged particles are more effective than X-rays in the induction of mutations (Ref. Reference Kiefer127) and chromosome aberrations (Ref. Reference Ritter and Durante128), and the mutations induced by low- and high-LET radiation are also qualitatively different (Ref. Reference Rose Li129), it is likely that charged particles can further improve the mutagenic landscape of cold tumours.
A further possible mechanism of immune response in tumours is mediated by the cGAS-STING innate immunity pathway (Refs Reference Jiang130, Reference Chen, Sun and Chen131, Reference Bakhoum132, Reference Hopfner and Hornung133). Sensing radiation-induced cytosolic DNA fragments has been shown to elicit a strong interferon-mediated immune response, which is compromised at high doses by the action of TREX1 exonuclease (Refs Reference Vanpouille-Box134, Reference Vanpouille-Box, Formenti and Demaria135). Since heavy ions induce smaller DNA fragments than sparsely ionising radiation (Ref. Reference Pang136), which can more easily leak into the cytoplasm through the nuclear membrane, it has been hypothesised that the innate immune pathway mediated by the cGAS-STING cytoplasmic DNA recognition can be increased after exposure to particles (Ref. Reference Durante and Formenti137). Cytosolic DNA can in fact derive either by formation of micronuclei (Ref. Reference Harding138) following mitosis or by direct leaking of small DNA fragments via transient nuclear envelope ruptures (Ref. Reference Ungricht and Kutay139). The latter mechanism is not dependent on mitosis, and may therefore be very relevant after high-dose irradiation, where cancer cells can undergo G2-block. The hypothesis that charged particles can increase cytosolic DNA and therefore increase interferon response remains to be experimentally tested.
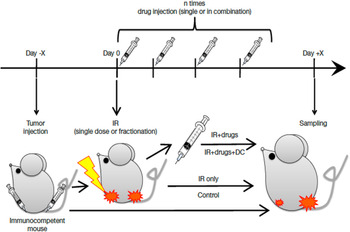
Only a handful of in vivo experiments were carried out so far to compare charged particles and X-rays in combination with checkpoint inhibitors. Generally a target and an abscopal tumour are implanted in the hind limbs, only one is irradiated and different combinations and timing of drug injection are tested (Fig. 4). Endpoints include the response of the abscopal tumour and the growth of distal metastases (Ref. Reference Ebner140). Pre-clinical studies of the type described in Figure 4 on the combination of immunotherapy with heavy ions have shown promising results. First, an increased second tumour rejection was observed following injection of pre-treated dendritic cells (Refs Reference Ohkubo141 and Reference Shimokawa142). Also, such combination reduced tumour formation after secondary challenge with tumour cell injection and resulted in increased specific lysis activity of cytotoxic T cells (Ref. Reference Matsunaga143). Second, reduced lung metastases were measured after combination of C-ions with anti-CTLA4 and anti-PD-1 checkpoint inhibitors (Ref. Reference Takahashi123), and the effect was stronger when using C-ions than X-rays (Ref. Reference Helm144). These results should be confirmed and can drive clinical trials.
Typical protocol used in various laboratories for pre-clinical studies comparing charged particles to X-rays in combination to immunotherapy. Reproduced from (Ref. Reference Ebner140), distributed under Creative Commons CC-BY.

However, the timing of drug administration in protocols like those described in Figure 4 is not well defined. A few new pre-clinical studies have addressed the issue of the timing between irradiation and checkpoint inhibitor administration. A recent study (Ref. Reference Wei145) with a protocol like in Figure 4 with a colorectal cancer mouse model used a single 8 Gy dose to one tumour, and looked at the abscopal response in the unirradiated tumour. The authors show a potent abscopal response when anti-PD-1 was administered after irradiation, while when the checkpoint inhibitor was given before irradiation, there was increased CD8+ T-cell radiosensitivity and apoptosis, and no abscopal response. Interestingly, also in the successful PACIFIC trial, the anti-PD-L1 durvalumab was given to the patient following chemoradiotherapy for NSCLC (Refs Reference Faivre-Finn8, Reference Antonia9). Moore et al. (Ref. Reference Moore146) also extensively studied the time factor between irradiation and administration of checkpoint inhibitors in a colon (hot) or lung (cold) carcinoma mouse model. They also found better results with fractionation and anti-PD-L1 post-irradiation, but interestingly the best results were obtained when fractions were spaced 10 days for both immunogenically cold and hot tumours, a scheme that the authors named PULSAR-stereotactic ablative radiotherapy.
The PULSAR protocol can be applied also to metastatic patients (Ref. Reference Morris147). In fact, it has been proposed that repeated exposure to tumour antigens over long time may amplify the adaptive immune response by expanding the tumour-specific immune cell receptors, the production of high-affinity tumour antibodies, and the generation of memory lymphocytes and thereby improve immune control of systemic disease (Ref. Reference He148). In this pulsed-radiotherapy protocol, it is important to note that more than one metastasis should be irradiated to overcome the heterogeneity of tumour-associated antigens (Ref. Reference Brooks and Chang149). This issue is interesting for charged particle therapy, because it is easier with Bragg-peak therapy to irradiate multiple lesions in the patient remaining below the tolerance dose for the normal tissue (Ref. Reference Anderle150).
The complexity of the interplay of so many different factors in radiation plus immunotherapy combination experiments really requires some biophysical modelling to guide experiments. Several models have been proposed to describe the interaction of ionising radiation and checkpoint inhibitors, to interpret results stemming from in vivo models and guide the clinical trials (reviewed in (Ref. Reference Friedrich, Henthorn and Durante151)). However, more experimental data are needed to provide realistic estimates of the models' parameters.
Conclusions
The central question addressed in this review was whether anti-cancer modern pharmaceutical approach should be different when combined with conventional X-ray therapy or accelerated charged particle therapy. The evidence summarised in this review shows that indeed there is a number of molecular mechanisms that differ between high-LET charged particles and X-rays, and therefore beg for different molecular medicine combinations.
It should be clear though that not all particles are the same. As shown in Figure 1, not all particles have physico-chemical characteristics at the nano-scale level different from X-rays. These means that the biological differences shown in Figure 3 are more typically seen after heavy ions than protons, and even carbon ions are more ‘moderate’ LET than really high-LET such as α-particles (Ref. Reference Tinganelli and Durante152). Therefore, targeted therapy approach used in conventional radiotherapy will work to a great extent or particle therapy as well. Nevertheless, we have pointed to some molecular mechanisms that are more likely to be seen with particles – for example, clustered DNA lesions, different DDR pathways, smaller DNA fragments, enhanced immunogenic cell death. This mechanism can be favourably exploited in molecular medicine.
In some cases, it is the physical characteristics of particles, which is shared by any ions, that can be favourably exploited. The reduced integral dose leads to sparing of the lymphocytes, and allow hypofractionation and treatment of multiple metastases on oligometastatic patients. This can be very useful in combination with immunotherapy.
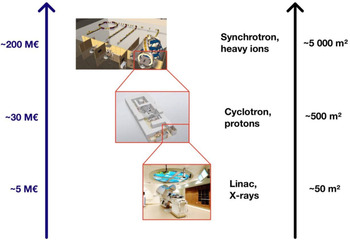
We argue that the topic of combined therapy is currently the most important for the future of particle therapy. In fact, particle therapy is more expensive than X-ray therapy (Fig. 5) and notwithstanding the current efforts to produce more compact accelerators to reduce the footprint, it will probably always remain so (Ref. Reference Durante, Debus and Loeffler3). Modern radiotherapy will be more and more used in combination with targeted and immune drugs, especially for the benefit of the patients with treatment-resistant or metastatic malignancies (Ref. Reference Baumann153). Even if particle therapy has already demonstrated improved tumour control (Ref. Reference Kamada24) and reduced normal tissue toxicity (Ref. Reference Baumann154) in a few specific cases, the lack of randomised comparative trials remains a problem for wider acceptance in the medical community (Ref. Reference Durante, Orecchia and Loeffler18). The more successful trials with combination trials will come in the coming years with conventional radiotherapy, the less justified will be the extra cost of particle therapy. It is therefore urgent to show whether the pre-clinical rationale of an improved effectiveness of combination therapy using particles rather than X-rays is supported by pre-clinical experiments and finally clinical trials. There is a large, interdisciplinary scientific community actively working on biomedical applications at accelerators (Ref. Reference Durante155). It would be desirable that these research efforts can be coordinated and concentrated on studying this very important topic.
The impact of advancing technology on footprint and costs of radiotherapy facilities. Size and prices can have large variation, but the image gives an indication of the increase in footprint and price. Figure from (Ref. Reference Durante, Debus and Loeffler3), reproduced with permission of Nature Publishing Group.