Introduction
The World Health Organization (WHO) defines adolescents as individuals aged 10–19 years. There are 1.2 billion adolescents in the world today, making up 16% of the world’s population (United Nations, 2019). Adolescence is one of the most rapid phases of human development (WHO, 2018). This phase of growth comes after two significant periods of growth, i.e. the growth before birth and the growth during the childhood, and the adolescent phase involves rapid physical growth along with psychosocial and cognitive development (WHO, 2006; Cusick & Kuch, Reference Cusick and Kuch2012). Hence, the public health policies of a country should give significant attention to adolescents to prevent them from entering adulthood with malnourishment (WHO, 2014).
According to the Comprehensive National Nutrition Survey in India, ‘every second Indian adolescent is either too short or too thin or overweight/obese’ (Sethi et al., Reference Sethi, Lahiri, Bhanot, Kumar, Chopra and Mishra2019). Both undernutrition and overnutrition pose a threat to adolescents. Undernutrition, specifically stunting, indicates ‘poor nutrition, infection and environmental stress’ from birth to adolescence (Christian & Smith, Reference Christian and Smith2018). In low- and middle-income countries, large numbers of women get married at a young age resulting in a large percentage of adolescent pregnancies. Undernutrition leads to poor pregnancy outcomes, like small-for-gestational age and pre-term births, and also passes on malnourishment to future generation by the birth of low birth weight babies (Thurnham, Reference Thurnham2013; Christian & Smith, Reference Christian and Smith2018; Lillie et al., Reference Lillie, Lema, Kaaya, Steinberg and Baumgartner2019). Overweight and obese adolescents have increased risk of developing non-communicable diseases and also psychological problems such as lack of self-confidence (Teferi et al., Reference Teferi, Atomssa and Mekonnen2018).
Even though many clinical and biochemical techniques are available to assess nutritional status, anthropometry, which involves the use of body measurements, has proven to be the most practical method (Gorstein & Akré, Reference Gorstein and Akré1988). In the year 2007, the WHO introduced growth references for the different anthropometric measurements, including BMI-for-age, height-for-age and weight-for-age for both males and females aged 5–19 years (Mramba et al., Reference Mramba, Ngari, Mwangome, Muchai, Bauni and Walker2017). Body mass index (BMI), calculated from an individual’s weight and height, remains the most common tool used for assessment of nutritional status in adolescents, as in any other age group, as the method is inexpensive, non-invasive and easy to measure (Dasgupta et al., Reference Dasgupta, Butt, Saha, Basu, Chattopadhyay and Mukherjee2010; Bhattacharya et al., Reference Bhattacharya, Pal, Mukherjee and Roy2019; Das et al., Reference Das, Saimala, Reddy, Mishra, Giri and Kumar2020). However, there are many disadvantages to this method. Oedema, ratio of sitting height to standing height, loss of fat-free mass and gain of fat mass with increasing age are some of the factors that affect the accuracy and efficiency of BMI as an indicator (Mramba et al., Reference Mramba, Ngari, Mwangome, Muchai, Bauni and Walker2017; Bhattacharya et al., Reference Bhattacharya, Pal, Mukherjee and Roy2019; Lillie et al., Reference Lillie, Lema, Kaaya, Steinberg and Baumgartner2019).
Given this context, mid upper arm circumference (MUAC) – the circumference of the arm halfway between the tip of the elbow and the tip of the shoulder – has the potential to offer a simple alternative or supplement to BMI in assessing nutrition in adolescent populations (Lillie et al., Reference Lillie, Lema, Kaaya, Steinberg and Baumgartner2019). It is used as one of the main indicators of nutritional status of children below 5 years of age (Das et al., Reference Das, Saimala, Reddy, Mishra, Giri and Kumar2020). This measure requires less equipment compared with BMI (Bhattacharya et al., Reference Bhattacharya, Pal, Mukherjee and Roy2019). While measuring BMI involves use of a stadiometer and functioning weighing scale, MUAC only requires a standard tape created for MUAC measurements. This makes it simple to measure and hence advantageous in situations where large samples need to be covered in resource-scarce countries; it also makes it applicable to both clinical and non-clinical settings (Cogill, Reference Cogill2003; Jeyakumar et al., Reference Jeyakumar, Ghugre and Gadhave2013; Cashin & Oot, Reference Cashin and Oot2018; Lillie et al., Reference Lillie, Lema, Kaaya, Steinberg and Baumgartner2019). While BMI can be affected by oedema, MUAC is not (Lillie et al., Reference Lillie, Lema, Kaaya, Steinberg and Baumgartner2019). Subcutaneous fat and arm muscle are proved to be the determinants of survival during starvation. MUAC provides both measures, which makes it a better anthropometric measure (Bhattacharya et al., Reference Bhattacharya, Pal, Mukherjee and Roy2019).
The World Health Organization does not provide growth references for MUAC for the age group 5–19 years, and there are currently no globally accepted references or studies connecting health outcomes to either BMI or MUAC for this age group (Tang et al., Reference Tang, Dong, Deitchler, Chung, Maalouf-Manasseh, Tumilowicz and Wanke2013; Mramba et al., Reference Mramba, Ngari, Mwangome, Muchai, Bauni and Walker2017). Standardized cut-offs for MUAC in adolescent populations have not been established due to a lack of studies and country-level MUAC measurement data for adolescents (Lillie et al., Reference Lillie, Lema, Kaaya, Steinberg and Baumgartner2019). There have been very few studies proving a correlation between MUAC and BMI among adolescents, or examining the link between these indicators and health outcomes among adolescents (Tang et al., Reference Tang, Dong, Deitchler, Chung, Maalouf-Manasseh, Tumilowicz and Wanke2013; Mramba et al., Reference Mramba, Ngari, Mwangome, Muchai, Bauni and Walker2017). The main aims of this study were therefore to determine the relationship between BMI and MUAC for adolescent males and females, and to examine whether arm circumference effectively represents the nutritional status of adolescents of India.
Methods
Data source
The study used data from India’s National Family Health Survey (NFHS)-4 conducted in 2015–16. The NFHS is a large-scale survey conducted through multiple rounds among representative sample households in India. The International Institute for Population Sciences (IIPS) is designated as the nodal agency by the Ministry of Health and Family Welfare, Government of India, to conduct the NFHS, which is the Indian equivalent of the Demographic Health Surveys of other countries. This survey provides data on maternal and child health, fertility preferences, HIV and other STIs (sexually transmitted infections), nutrition and so on. The NFHS-4 also aimed to provide vital estimates of the prevalence of malnutrition, anaemia, hypertension, HIV and high blood glucose levels through a series of biomarker tests and measurements (IIPS & Inner City Fund, 2017). The data collected through this survey are widely used in policy formulation as well as in the monitoring of ongoing programmes in the health sector in India.
Study sample
This study was based on data from the women’s and men’s interview schedules in the NFHS. The survey gives information on women aged 15–49 years and men aged 15–54 years. However, the sample used for analysis only included adolescent males and females aged 15–19 years. The final weighted study sample comprised 91,315 female adolescents (who were currently not pregnant and who have never had any births) and 14,893 male adolescents. Following the literature, respondents from both the male and female data sets whose BMI-for-age Z-scores lay outside the range of –5 to +5 standard deviations from the median and whose height-for-age Z-scores values lay outside –6 and +6 standard deviations were removed from the analysis.
Anthropometric and demographic variables
The MUAC was measured on the bare arm of each participant halfway between the tip of the elbow and the tip of the shoulder. The NFHS-4 gives MUAC measurement in centimetres. Three different forms of MUAC classification were used in the study: 1) NACS (Nutrition Assessment, Counselling, and Support) classification, in centimetres, 2) Mramba et al. (Reference Mramba, Ngari, Mwangome, Muchai, Bauni and Walker2017)’s classification, in centimetres, and 3) Mramba et al. (Reference Mramba, Ngari, Mwangome, Muchai, Bauni and Walker2017)’s classification, in MUAC-for-age Z-scores. The cut-offs for these classifications are shown in Table 1.
Cut-offs for the different MUAC classifications

NACS: Nutrition Assessment, Counselling and Support; MUAC: mid upper arm circumference; SD, standard deviation.
Moderate acute malnutrition and severe acute malnutrition were considered together as ‘undernourished’. As recommended by NACS, MUAC cut-offs for 15- to 17-year-olds were as follows: normal: ≥22.0 cm; undernourished: < 22.0 cm (moderate acute malnutrition: 18.5–22.0 cm; severe acute malnutrition: <18.5cm) (Lillie et al., Reference Lillie, Lema, Kaaya, Steinberg and Baumgartner2019). MUAC was also transformed into MUAC-for-age Z-scores, calculated following T.J. Cole’s method (Cole, Reference Cole1990). MUAC (cm) and MUAC Z-scores were then classified on the basis of the study by Mramba et al. (Reference Mramba, Ngari, Mwangome, Muchai, Bauni and Walker2017) on growth references for MUAC among school age children and adolescents. Following Mramba et al. (Reference Mramba, Ngari, Mwangome, Muchai, Bauni and Walker2017), cut-offs for 15, 16, 17, 18, 19 years of age were at 18.7 cm, 19.3 cm, 19.9 cm, 20.4 cm and 21.0 cm, respectively. Respondents with a MUAC of below the respective cut-off value were considered ‘undernourished’ and those with a MUAC above the cut-off value were considered ‘normal’. The MUAC-for-age Z-score classification as per Mramba et al. was: normal: Z-score ≥–2 SD; and undernourished: Z-score <–2 SD.
The study sample characteristics were assessed by selected socio-demographic and economic variables. These included: current age of respondent, urban/rural place of residence, religion, caste, number of years of education, status in wealth quintile, sources of drinking water and sanitation, region of residence and food frequency score. A food frequency score was calculated from the respondent’s reply to a question on how often they consumed various food items in the following seven food groups: pulses, dairy, meat, fish, eggs, vegetables and fruit. Responses for each food group were noted separately. If the response was ‘daily’, then a score of 3 was given to the respondent. For a response of ‘weekly’, ‘occasionally’ and ‘never’, the scores were 2, 1 and 0, respectively. The cumulative score for the seven groups was then calculated resulting in a value ranging from 0 to 21. This was then categorized into low, medium and high food frequency tertiles (Young et al., Reference Young, Nguyen, Tran, Avula and Menon2020).
Data analysis
Descriptive statistics and cross-tabulation were used to understand the characteristics of the sample population. The NFHS-4 dataset provides MUAC measured in centimetres for both men and women. The degree of relationship between MUAC and BMI was established through correlation analysis. Respondents with BMI-for-age Z-scores <–2 SD, i.e. adolescents who were thin according to the WHO growth reference for 5–19 years (WHO, 2007), were classified as ‘undernourished’ and everybody else was considered ‘normal’. Then, for the three different classifications of MUAC, sensitivity and specificity were calculated in comparison to BMI-for-age Z-score classification to study how well they correctly identified the undernourished and normal adolescents. Sensitivity is the proportion of individuals identified as undernourished by the BMI criterion that were also identified as undernourished by the particular MUAC cut-off, and specificity is the proportion of individuals identified as not undernourished by the BMI criterion that were also identified as not undernourished by the particular MUAC cut-off.
WHO ‘Anthroplus’ software was used to create BMI-for-age Z-scores for the study sample. This is an application tool provided by the WHO for global application of the WHO Reference 2007 for 5–19 years to monitor the growth of school-age children and adolescents. Microsoft Excel was used in the calculation of MUAC-for-age Z-scores and STATA version 13 was used for all the statistical analysis.
Results
Study population characteristics
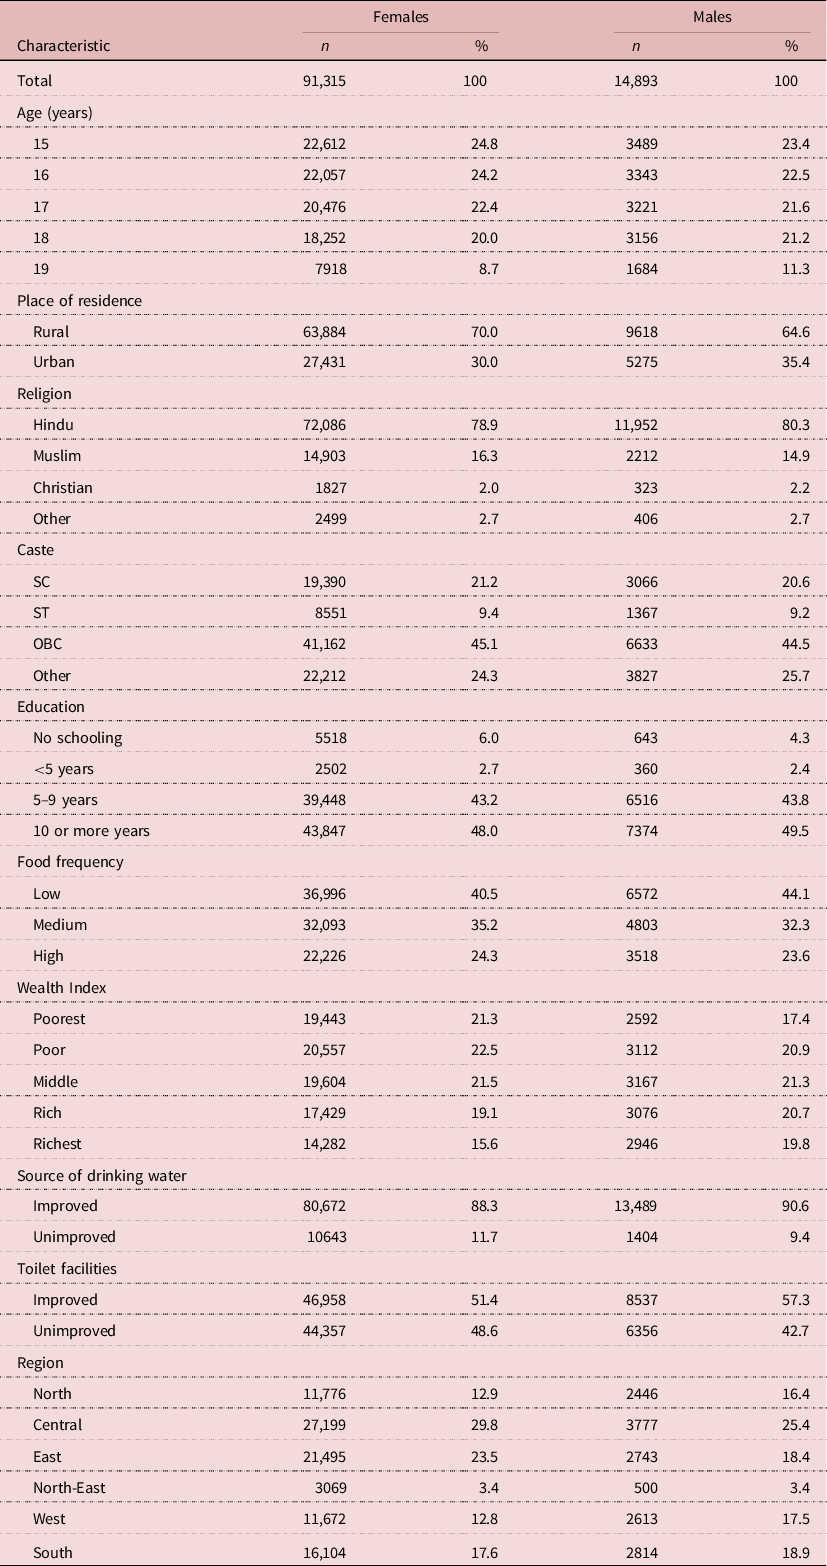
The characteristics of the individuals included in the study are shown in Table 2. Among the adolescent females, 70% were from rural areas and the majority followed Hinduism (78.9%). The largest proportion of the sample females belonged to Other Backward Classes (OBC, 45.1%). Most had more than 5 years of education. There was around 20% representation each from the ‘poorest’, ‘poor’, ‘middle’ and ‘rich’ categories of household wealth index and the richest category had 15.6% of adolescent females. The food frequency classification showed that only 24.3% of females had high food frequency. The majority of adolescent females (88%) had households with an improved source of drinking water and 51.4% used improved toilet facilities.
Characteristics of respondents aged 15–19 years by sex, India, 2015–16

Source: authors’ calculation using NFHS-4 data.
SC: Scheduled Caste; ST: Scheduled Tribe; OBC: Other Backward Class.
Among the males (aged 15–19) selected for the study, the place of residence of the majority was rural (64.6%). The male study sample had a majority of Hindu respondents (80.3%) and around 44.5% were from OBCs. Almost half of the boys had more than 10 years of education and another 43.8% had attained 5–9 years of education. There were approximately equal percentages of male respondents from all categories of wealth index ranging from poorest to richest. Similar to the female sample, the majority of males also had low and medium food frequency. Almost 91% of adolescent males had access to an improved source of drinking water and 57.3% had access to improved toilet facilities.
Relationship between BMI and MUAC
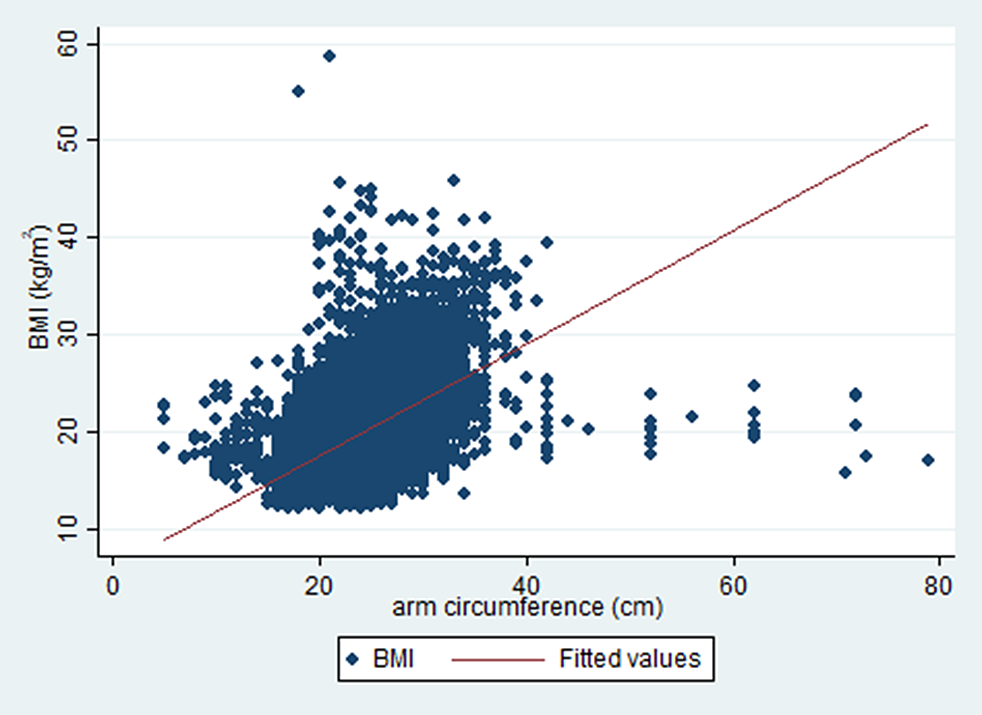
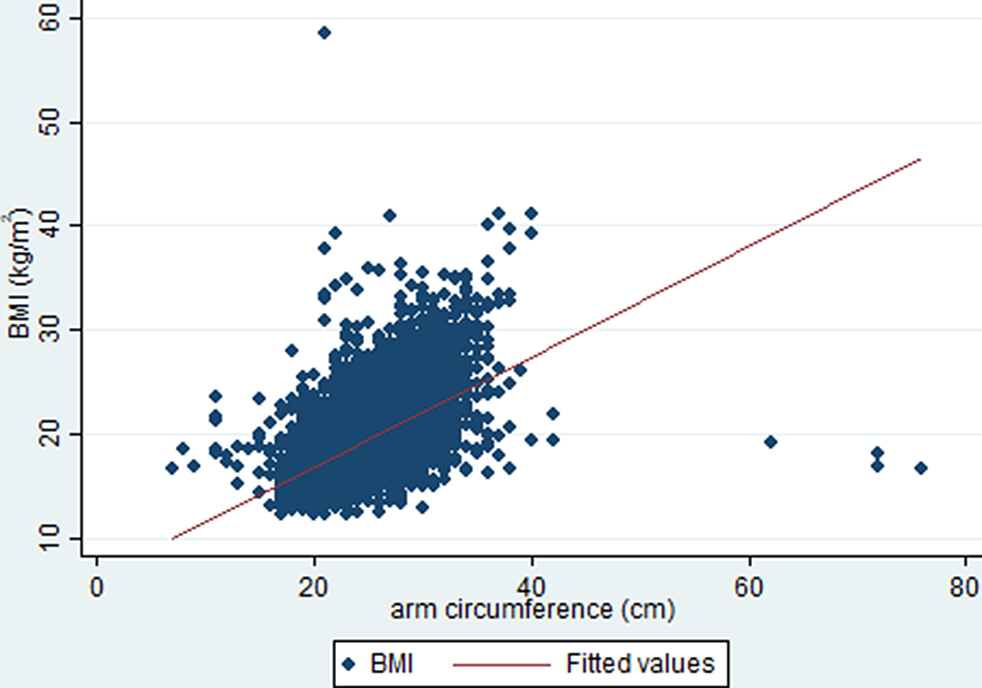
The correlation analyses indicated that the respondents’ BMI and MUAC measurements showed a positive correlation for both females and males (males: r=0.54; females: r=0.55, both statistically significant at p<0.01). Exploratory sub-group analyses based on BMI-for-age cut-offs revealed that, in males and females who were undernourished, the correlation between BMI and MUAC decreased to 0.44 and 0.37 respectively. In males, the correlation between BMI and MUAC remained significant at p<0.01 after categorizing between those who were stunted (r=0.46) and those who were not stunted (r=0.56). In females also, the correlation between BMI and MUAC remained significant at p<0.01 after categorizing between those who were stunted (r=0.51) and those who were not stunted (r=0.59). The relationships between BMI and MUAC for adolescent females and males are shown in Figure 1 and Figure 2 respectively.
Relationship between BMI and MUAC in adolescent females, India.

Relationship between BMI and MUAC in adolescent males, India.

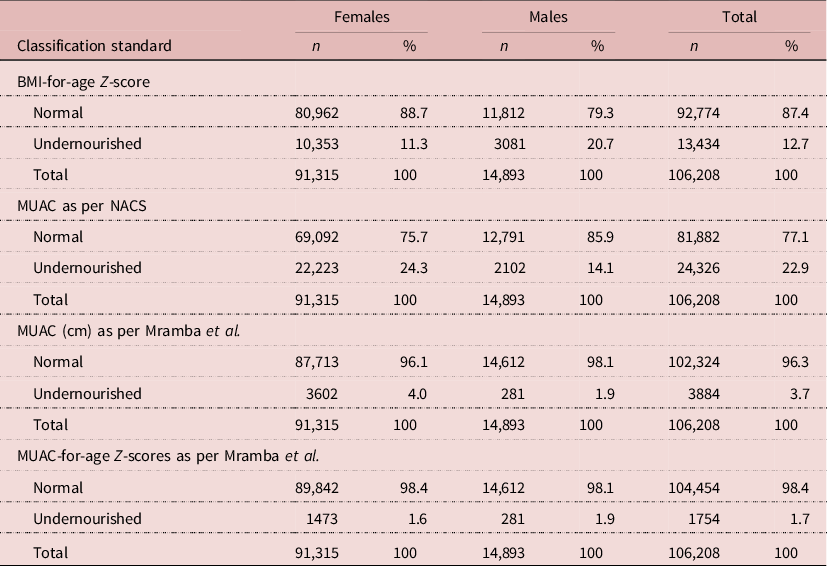
Table 3 shows how the respondents were classified as undernourished or normal according to different classifications. With the BMI-for-age Z-score classification, 87.4% of the adolescents fell into normal and 12.7% into the undernourished categories. When the MUAC classification as per NACS was used, the percentage classified as normal decreased, and more adolescents were now falling into the undernourished category (77.1% normal, 22.9% undernourished). Using the MUAC classification using the cut-offs provided by Mramba et al. (Reference Mramba, Ngari, Mwangome, Muchai, Bauni and Walker2017), 96.3% were normal and 3.7% were undernourished. Finally, using the MUAC-for-age Z-score classification, 98.4% were normal and 1.7% were undernourished.
Percentage of adolescents classified as undernourished or normal using different classification standards, India, 2015–16

Source: authors’ calculations using NFHS-4 data.
Comparison of available MUAC cut-offs
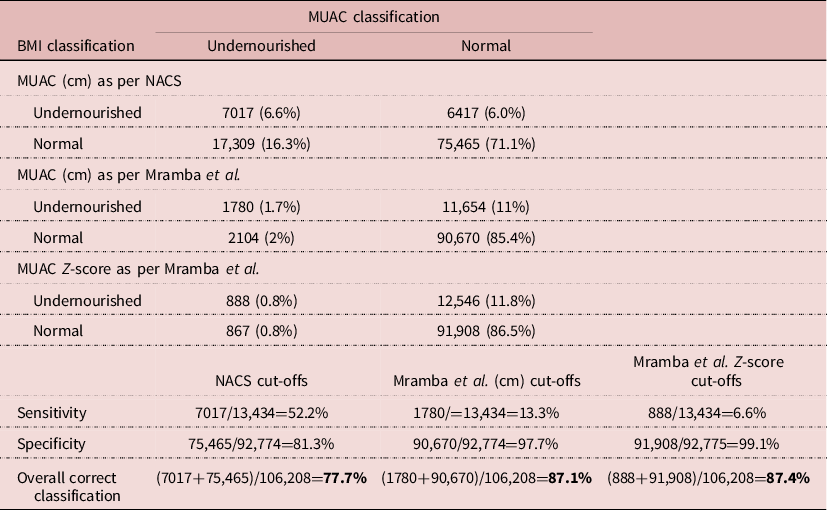
In previous studies, MUAC cut-offs have generally been compared with BMI-for-age Z-score classifications. Sensitivity and specificity were calculated for the NACS classification of MUAC and the Mramba et al. (Reference Mramba, Ngari, Mwangome, Muchai, Bauni and Walker2017) classification of MUAC (cm) and MUAC-for-age Z-scores. The sensitivity and specificity were calculated for each of the available MUAC classifications when compared with BMI-for-age Z-scores (Table 4).
Comparison of MUAC cut-offs with BMI cut-offs

Source: authors’ calculation using NFHS-4 data.
Sensitivity indicates the ability of the classification to correctly identify the individuals who were undernourished, and specificity indicates the ability of the classification to correctly identify the individuals whose nutritional status was normal. The sensitivity and specificity of MUAC cut-offs as per the NACS guidelines were 52.2% and 81.3% respectively. The MUAC cut-offs as per the method adopted by Mramba et al. (Reference Mramba, Ngari, Mwangome, Muchai, Bauni and Walker2017) had a sensitivity and specificity of 13.3% and 97.7%, respectively. Finally, the MUAC-for-age Z-score classification had a sensitivity and specificity of 6.6% and 99.1%, respectively, when compared with BMI-for-age Z-scores. The overall correct classifications of NACS cut-offs, Mramba et al. (cm) cut-off and Z-score cut-off were 77.6%, 87.0% and 87.3%, respectively.
Discussion
Mid upper arm circumference (MUAC) is a widely used anthropometric measure to assess childhood malnutrition and to decide children’s eligibility for feeding programmes (Abdel-Rahman et al., Reference Abdel-Rahman, Bi and Thaete2017). The reasons for considering it as a preferred measure are that is does not require expensive equipment, its ease of use and the fact that it can reliably be performed by community health workers and primary caregivers (Sadler et al., Reference Sadler, Puett, Mothabbir and Myatt2011; Blackwell et al., Reference Blackwell, Myatt, Allafort-Duverger, Balogoun, Ibrahim and Briend2015; Abdel-Rahman et al., Reference Abdel-Rahman, Bi and Thaete2017). Previous studies have provided evidence that MUAC is highly predictive of morbidity and mortality. In addition, it has been proved to perform better than other measures such as BMI and weight-for-height Z-scores (Myatt et al., Reference Myatt, Khara and Collins2006; Briend et al., Reference Briend, Maire, Fontaine and Garenne2012; Walters et al., Reference Walters, Sibson and McGrath2012; Garenne et al., Reference Garenne, Maire, Fontaine and Briend2013; Abdel-Rahman et al., Reference Abdel-Rahman, Bi and Thaete2017).
In an effort to understand the usability of MUAC as an anthropometric measure of adolescent nutrition, correlation analysis and exploratory sub-group analysis have shown a moderate positive correlation between MUAC and BMI among both adolescent males and females. A statistically significant positive correlation between MUAC and BMI has been established in many earlier studies (Lillie et al., Reference Lillie, Lema, Kaaya, Steinberg and Baumgartner2019; Das et al., Reference Das, Saimala, Reddy, Mishra, Giri and Kumar2020). In two separate prospective cohorts, it was found that ‘MUAC-for-age Z-score was at least as good as the existing body mass index-for-age z score reference for assessing mortality risks associated with undernutrition among African school aged children and adolescents’ (Mramba et al., Reference Mramba, Ngari, Mwangome, Muchai, Bauni and Walker2017). The correlation analysis, and sensitivity and specificity tests, performed in this study using different classifications of MUAC (NACS guidelines and Mramba et al. classifications), while considering BMI-for-age Z-score classifications as gold standard, indicate that MUAC does correctly identify the true negative cases as indicated by the specificity values. Even though the sensitivity values of MUAC classification using the Mramba et al. classification were very low, the sensitivity values of the MUAC classification using NACS guidelines were moderately good. Since specificity and sensitivity exist in a state of balance, low sensitivity is an expected trade-off for a test that has high specificity. All the MUAC cut-offs had higher specificity, meaning the cut-offs did a good job in ruling out people who were not undernourished. Sensitivity and specificity are dependent on the cut-off level chosen for classification. The high specificity of the cut-offs considered in the study, but low sensitivity, may be contributed by the absence of a country-specific and sex-specific cut-off for the study population, and thus may mean that these are not the best choice of cut-off for the Indian population. The unavailability of specific cut-offs for identifying undernourished and overnourished populations may also have contributed to the high specificity, but low sensitivity, values of the MUAC cut-offs.
The sensitivity and specificity results from the existing literature show that there was inconsistency between the different cut-offs (Lillie et al., Reference Lillie, Lema, Kaaya, Steinberg and Baumgartner2019). The NACS cut-off was taken from the NACS job aid and manual for the FANTA project, whose focus countries were Bangladesh, Botswana, Cote d’lvoire, Democratic Republic of Congo, Ethiopia, Ghana, Guatemala, Haiti, Lesotho, Madagascar, Malawi, Mozambique, Namibia, Nigeria, Swaziland, Tanzania, Uganda, Vietnam and Zambia. Therefore, the use of this cut-off for the Indian population may not be as appropriate as using a country-specific cut-off. The probable reasons for the variations in the classification of respondents into different categories of nutritional status using the different methods of classification considered in the study when compared with BMI could be the lack of country-specific and sex-specific cut-offs for India and the deviation from the standard procedure for measuring MUAC in NFHS.
This study aimed to determine the efficiency of MUAC as an alternative measure of malnourishment among adolescents, as has been proven in the case of children. For the study sample, MUAC identified undernourished and normal respondents with moderate efficiency. If further studies prove that MUAC does efficiently depict the nutritional status of adolescents, then this can be used in situations with fewer resources and where BMI cannot be measured. To further establish the usability of MUAC, a global growth reference standard for the MUAC of adolescents should be developed and country- and sex-specific reference standards developed. In situations where both BMI and MUAC are available, which would be best to use, and which will provide most scope to assess the connection of nutritional status to related morbidities, are some of the questions that need to be asked.
The study had its limitations. A major limitation was that arm circumference was only measured in the NFHS-4 to choose the size of instrument to check a participant’s blood pressure. Thus, the measurement of arm circumference was not according to standard procedures prescribed when studying nutritional status. This may have affected the MUAC values. Also, the MUAC-for-age Z-scores were not subject to external or internal validation. Validation would have assured the usability of the Z-scores created. Finally, the available MUAC cut-offs only categorized those who were undernourished and did not provide cut-offs for those who were overnourished. In future studies, it will be important to include more aspects and variables to better understand the effect of those variables on the relationship between BMI and MUAC.
Inexpensive and simple methods for diagnosing malnutrition can be really useful, particularly in resource-poor settings. This study is a contribution towards generating an evidence base on MUAC assessments as an indicator of nutritional status among adolescents, though this needs to be further tested with more nutritionally and demographically diverse populations.
Acknowledgments
The authors appreciate the help of the International Institute for Population Sciences for granting access to the NFHS-4 data used in this study. In addition, the authors are thankful to Mr Ajit Jaiswal for his feedback, which enriched this paper technically, as well as for the comments of the reviewer.
Funding
This research received no specific grant from any funding agency, commercial entity or not-for-profit organization.
Conflicts of Interest
The authors have no conflicts of interest to declare.
Ethical Approval
The authors assert that all procedures contributing to this work comply with the ethical standards of the relevant national and institutional committees on human experimentation and with the Helsinki Declaration of 1975, as revised in 2008.