Clostridium difficile infection (CDI) is a frequent cause of healthcare-associated diarrhea. It is associated with an infection-related mortality of 5%, and has an all-cause mortality of 15%–20%.Reference Lessa, Mu and Bamberg 1 , Reference Leffler and Lamont 2 The epidemiology of CDI has changed since the emergence of the B1/NAP1/027 strain in the early 2000s. This ribotype has been responsible for an increase in incidence and severity of CDI.Reference O’Connor, Johnson and Gerding 3 Current guidelines for the treatment of CDI recommend metronidazole for mild-to-moderate infection and vancomycin for severe infection.Reference Cohen, Gerding and Johnson 4 A first recurrence is usually treated with vancomycin, and subsequent recurrences are treated with a tapered regimen of vancomycin, fidaxomicin or fecal microbiota transplantation (FMT).Reference Cohen, Gerding and Johnson 4 , Reference Keller and Kuijper 5 Fidaxomicin and FMT both appear to lead to fewer recurrences.Reference van Nood, Vrieze and Nieuwdorp 6 , Reference Louie, Miller and Mullane 7
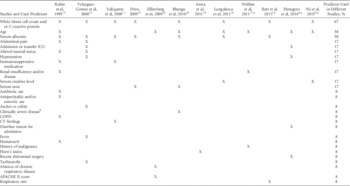
Early identification of patients at risk of a complicated course or death could help clinicians inform patients and might help doctors guide antibiotic treatment. Several scoring systems to predict a complicated course of CDI have been developed (Table 1).Reference Hensgens, Dekkers, Goorhuis, LeCessie and Kuijper 8 – Reference Butt, Foster and Keedwell 19 However, none has gained widespread clinical acceptance due to lack of external validation, the retrospective study design, or the limited numbers of patients on which they are based.Reference Abou Chakra, Pepin and Valiquette 20 To our knowledge, to date, only 1 study has been externally validated.Reference Toro, KM, Rocha-Rodriguez and Gutierrez-Nunez 21 In 4 studies, internal validations were performed.Reference Hensgens, Dekkers, Goorhuis, LeCessie and Kuijper 8 , Reference Na, Martin and Sethi 9 , Reference Welfare, Lalayiannis, Martin, Corbett, Marshall and Sarma 17 , Reference Butt, Foster and Keedwell 19 Between May 2013 and July 2014, the frequency of CDI cases increased above our usual endemic levels due to an outbreak of C. difficile ribotype 027.Reference van Beurden, Dekkers and Bomers 22 The aims of the current study were to test published prediction models for complicated CDI for clinical use and to provide external validation for existing prediction models.
Prediction Tools for a Complicated Course of Clostridium difficile Infection

NOTE. ICU, intensive care unit; COPD, chronic obstructive pulmonary disease; CT, computed tomography; APACHE: Acute Physiology And Chronic Health Evaluation.
a Validated prediction models in this manuscript.
b Clinically severe disease: sepsis, peritonitis, and/or ≥10× diarrhea in 24 h.
MATERIAL AND METHODS
Source of Data
We searched PubMed and Embase for studies on prediction tools for a severe or complicated course of CDI up to February 2016 (Appendix A). We selected studies that (1) predicted at least 1 relevant outcome (ie, severity, complications, mortality) and (2) developed a prediction model or risk score. Only completed studies were included. Prediction tools that used a selected patient group (eg, only ICU patients), included nonquantitative parameters (eg, Horn’s index, mental status), or parameters that were not available at the day of diagnosis in our cohort (eg, radiological findings or albumin concentration) were excluded.
Patient Validation Cohort and Data Collection
All consecutive hospitalized patients (≥18 years) diagnosed with CDI between May 2013 and March 2014 at the VU University medical center (VUmc), a 750-bed tertiary care center in Amsterdam, The Netherlands, were eligible. Patients diagnosed at the outpatient clinic, and patients who were lost to follow up were excluded. CDI was defined as the presence of diarrhea (ie, ≥3 stools per 24 hours) in combination with a positive C. difficile toxin test (VIDAS C. difficile A&B test, bioMèrieux, Marcy-l'Étoile, France). All isolates of C. difficile are routinely typed in our microbiology laboratory by amplified fragment-length polymorphism, which permits differentiation between the different ribotypes. Medical charts were reviewed for demographic and clinical characteristics. For every participant, we recorded data for the predicting variables used in the different prediction models (Table 1): age, department of CDI diagnosis, presence of hypotension (systolic blood pressure below 100 mmHg and/or diastolic blood pressure below 60 mmHg), diarrhea as the reason for hospital admission, recent abdominal surgery, peak white blood count, peak creatinine level (ie, between 5 days before and 2 days after the diagnostic stool sample was obtained, as suggested by the original prediction model), and presence of renal disease or cancer (following the definitions used in the Charlson comorbidity indexReference Charlson, Pompei, Ales and MacKenzie 23 ). In addition, data related to gender, Charlson comorbidity index,Reference Charlson, Pompei, Ales and MacKenzie 23 and C. difficile ribotype (outbreak strain ribotype 027 vs other ribotypes) were recorded. The study was approved by the VUmc Medical Ethics Committee.
Outcome
A course of CDI was considered complicated if any of the following criteria were met within 30 days after the diagnosis of CDI: (1) death as a direct or indirect consequence of CDI, (2) admission to the ICU for treatment of CDI or its complications, (3) surgery (colectomy) for toxic megacolon, perforation or refractory colitis.Reference Kuijper, Coignard and Tull 24 , Reference McDonald, Coignard, Dubberke, Song, Horan and Kutty 25 This definition of a complicated course of CDI was identical to the definition used in the prediction rules by Hensgens et alReference Hensgens, Dekkers, Goorhuis, LeCessie and Kuijper 8 and by Na et al.Reference Na, Martin and Sethi 9 In addition, we collected data on all cause 30-day mortality for validation of the prediction score by Welfare et al.Reference Welfare, Lalayiannis, Martin, Corbett, Marshall and Sarma 17 Whether the course of CDI was considered complicated was assessed by the study physician after chart review.
Missing Data
Most predictors had <1% missing data. However, 7%–10% of values were missing for blood pressure on the day of diagnosis, white blood count, and serum creatinine level. When both diastolic and systolic blood pressure measurements were missing, we presumed that the patients had no hypotension on the day of diagnosis. To account for missing data on white blood count (n=14) and serum creatinine level (n=10), values were imputed using multiple imputation (10 imputed datasets).Reference Sterne, White and Carlin 26 The predictors in the selected studies, the outcome variable, and 5 additional variables (sex, Charlson comorbidity index,Reference Charlson, Pompei, Ales and MacKenzie 23 CDI due to ribotype 027, temperature ≥38.5°C, ward of CDI diagnosis) were included in the imputation procedure.
Statistical Analysis
Using the same multivariable models as used in the original studies, demographic characteristics and risk factors were compared between patients with and without the outcome to give insight in the association between predictors used in the different prediction models and the outcome in our validation cohort. These procedures were conducted using standard logistic regression. Risk scores were calculated for each patient by adding the allocated points for each variable according to the respective prediction model. To quantify how close predictions are to the actual outcome (calibration), we plotted the observed number of complicated cases against the predicted number of complicated CDI courses in the simplified risk categories provided by the original studies. The ability of the prediction models to discriminate between those with and without a complicated CDI course was assessed by calculating the area under the receiver operating characteristic (ROC) curve (AUC), which ranges from no discrimination (0.5) to perfect discrimination (1.0).Reference Tazhibi, Bashardoost and Ahmadi 27 Because all prediction models were developed in an endemic setting, in a second step, we reexamined calibration and discrimination within the group of patients who had been diagnosed with CDI due to endemic strains (ie, strains that had never caused outbreaks in our hospital). SPSS version 22 software (IBM, Armonk, NY) was used for statistical analysis.
RESULTS
Selection of Prediction Models
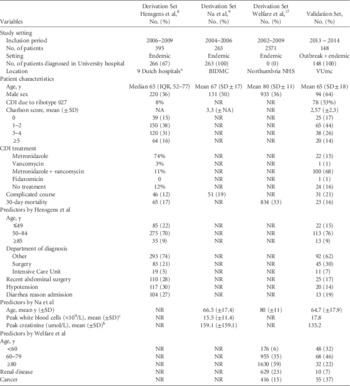
We identified 12 papers presenting a prediction model for a complicated course of CDI (Table 1),Reference Hensgens, Dekkers, Goorhuis, LeCessie and Kuijper 8 – Reference Zilberberg, Shorr, Micek, Doherty and Kollef 18 of which 8 studies were excluded because they included a selected patient group,Reference Zilberberg, Shorr, Micek, Doherty and Kollef 18 used nonquantitative parameters (eg, altered mental status, Horn’s index),Reference Arora, Kachroo, Ghantoji, Dupont and Garey 10 – Reference Velazquez-Gomez, Rocha-Rodreiguez, Toro, Gutierrez-Nun, Gonzalez and Saavedra 12 or used variables that were not available in our cohort on the day of CDI diagnosis (eg, serum albumin, radiological findings).Reference Velazquez-Gomez, Rocha-Rodreiguez, Toro, Gutierrez-Nun, Gonzalez and Saavedra 12 – Reference Bhangu, Bhangu, Nightingale and Michael 16 , Reference Butt, Foster and Keedwell 19 Age, white blood count, and albumin level were used in the prediction model in >50% of the studies. All other 24 predictors were used in only 10% or 20% of models. In this study, we sought to validate 3 prediction models from 3 different studies. Study and patient characteristics of the 3 derivation studies, and of our validation cohort are shown in Table 2.
Study and Patient Characteristics of the Derivation and Validation Sets

NOTE. NR, not reported; BIDMC, Beth Israel Deaconess Medical Center, Boston, MA; NHS: National Health Service, United Kingdom, comprising 3 general hospitals and 7 community hospitals; VUmc, VU University medical center, Amsterdam, The Netherlands; CDI, Clostridium difficile infection.
a 5 university and 4 community hospitals.
b During a 7-d time period from 5 days before to 2 days after the diagnostic stool sample was obtained.
Prediction model by Hensgens et al. Reference Hensgens, Dekkers, Goorhuis, LeCessie and Kuijper 8
The prediction model developed by Hensgens et al calculates the probability to develop a complicated course. Based on total points, Hensgens et al defined 4 risk categories: no risk (<0 points), low risk (0–1 point), medium risk (2–3 points), and high risk (≥4 points).
Prediction model by Na et al. Reference Na, Martin and Sethi 9
The prediction model developed by Na et al calculates the probability to develop a severe clinical course of CDI. Based on total points, Na et al defined 2 risk categories: low risk (0–1 points), and high risk (2–3 points).
Prediction model by Welfare et al. Reference Welfare, Lalayiannis, Martin, Corbett, Marshall and Sarma 17
The prediction model developed by Welfare et al estimates all-cause mortality risk at 30 days. Based on total points, Welfare et al defined 3 risk categories: low risk (0–3 points), medium risk (4–7 points), and high risk (8 points).
Patient Characteristics of the Validation Cohort
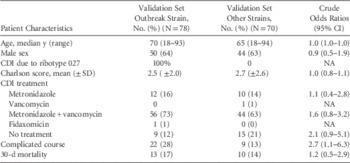
Patient characteristics are shown in Table 2. In total, 148 CDI patients were included in the validation set, of which 78 patients diagnosed with CDI due to the outbreak strain ribotype 027, and 70 patients with CDI due to other ribotypes (Table 3). In general, no differences were observed between the derivation study cohorts of Hengens et al and of Na et al and the validation cohort in age, gender, or Charlson comorbidity index. The derivation cohort of Welfare et al differed from the validation cohort in mean age and gender.
Patient Characteristics of the Validation Cohort: Patients Diagnosed with Clostridium difficile Infection (CDI) Due to the Outbreak Strain Ribotype 027 Versus Other Strains

NOTE. CI, confidence interval; NA, not applicable; SD, standard deviation.
In the total validation cohort, 84% of patients received antibiotic treatment for CDI. Most frequently, a combination of metronidazole and vancomycin was used (68%). This differs from the derivation cohort of Hensgens et al, where metronidazole monotherapy was used most frequently (74%). No information regarding antibiotic treatment was available for the cohorts of Na et al or of Welfare et al.
A complicated course due to CDI was observed in 31 patients (21%), and 23 patients (16%) died within 30 days after CDI diagnosis; death was CDI related in 13 of these cases. Because of severe pseudomembranous colitis, 1 patient with CDI underwent a colectomy. Overall, 20 patients were admitted to the ICU after CDI diagnosis; 13 of these cases were related to CDI.
Model Performance
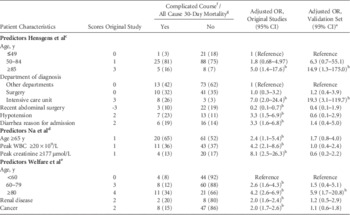
The association between predictors and a complicated course of CDIReference Hensgens, Dekkers, Goorhuis, LeCessie and Kuijper 8 , Reference Na, Martin and Sethi 9 or 30-day mortalityReference Welfare, Lalayiannis, Martin, Corbett, Marshall and Sarma 17 in the validation cohort was analyzed by multivariable logistic regression using the same multivariable models as the original studies (Table 4).
Multivariable Analysis of Predictors Identified by the Different Prediction Tools Compared to Multivariable Odds Ratios of the Original Prediction Studies

NOTE. CDI, Clostridium difficile infection; OR, odds ratios; CI, confidence interval; WBC, white blood cell count.
a Multivariable models using the same variables as used in the original studies.
b Statistically significant.
c Data included age, department, hypotension measured on the day of CDI diagnosis, recent abdominal surgery gathered from the 3 months prior to the start of diarrhea.
d Data included age on the day of CDI diagnosis, peak WBC, and peak creatinine measured between 5 d before to 2 d after the diagnostic CDI stool sample was obtained.
e Data measurements were taken on the day of CDI diagnosis.
f For the prediciton tools of Hensgens et al and Na et al.
g For the prediction tool of Welfare et al.
Prediction model by Hensgens et al. Reference Hensgens, Dekkers, Goorhuis, LeCessie and Kuijper 8
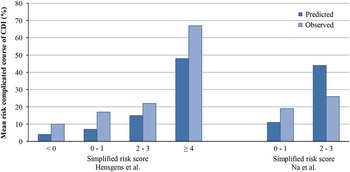
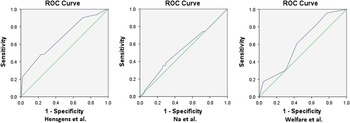
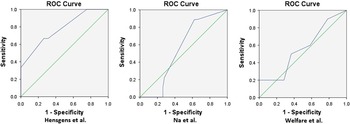
In the validation cohort, the median score using the prediction tool developed by Hensgens et al was 1 (range, −3 to 6). Age and department of diagnosis (ICU) were significantly associated with a complicated course of CDI in our cohort. We compared the observed and predicted outcomes for the different risk groups defined by the prediction rule (Figure 1 and Appendix B). In the validation cohort, a higher score corresponded with a higher chance of a complicated course. This finding is similar to the results of the pilot external validation performed in the original manuscript. With an estimated AUC of 0.68 (95% CI, 0.57–0.79), discrimination between patients with and without a complicated course of CDI was poor (Figure 2.1).Reference Tazhibi, Bashardoost and Ahmadi 27 Analysis restricted to patients with CDI due to nonoutbreak strains (n=70) showed fair discrimination, with an AUC of 0.78 (95% CI, 0.61–0.95) (Figure 2.2).Reference Tazhibi, Bashardoost and Ahmadi 27
Validation of the prediction tools developed by Hensgens et alReference Hensgens, Dekkers, Goorhuis, LeCessie and Kuijper 8 and by Na et al.Reference Na, Martin and Sethi 9 Observed versus predicted complicated course per simplified risk group following their prediction scores.

Pooled ROC curve performance prediction models, using the original scores. Hensgens et al prediction model: AUC 0.68 (95% CI, 0.57–0.79); Na et al prediction model: AUC 0.54 (95% CI, 0.42–0.65); Welfare et al prediction model: AUC 0.61 (95% CI, 0.50–0.73).

Pooled ROC curve prediction models (only non-027), using the original scores. Hensgens et al prediction model: AUC 0.78 (95% CI, 0.61–0.95); Na et al prediction model: AUC, 0.55 (95% CI, 0.40–0.70); Welfare et al prediction model: AUC, 0.56 (95% CI, 0.37–0.76).

Prediction model by Na et al. Reference Na, Martin and Sethi 9
The median score, using the prediction tool developed by Na et al in the validation cohort, was 1 (range, 1–3). No statistically significant association was identified in a multivariable model between the predictors by Na et al and a complicated course of CDI in our cohort. We compared the observed and predicted outcomes for the different risk groups defined by the prediction rule (Figure 1 and Appendix C). Discrimination of the prediction model failed (AUC, 0.53; 95% CI, 0.42–0.65; Figure 2.1).Reference Tazhibi, Bashardoost and Ahmadi 27 Analysis restricted to patients with CDI due to nonoutbreak strains, also showed very poor discrimination (AUC, 0.54; 95% CI, 0.39–0.70; Figure 2.2).
Prediction model by Welfare et al. Reference Welfare, Lalayiannis, Martin, Corbett, Marshall and Sarma 17
In the validation cohort, the median score using the prediction model of Welfare et al was 3 (range, 0–6). Only age ≥80 years was significantly associated with 30-day mortality. We were not able to compare the observed outcome in our cohort with the predicted outcome defined by the prediction rule due to lack of data in the original study by Welfare et al (Appendix D). Therefore, the prediction model developed by Welfare et al was not included in Figure 1. Discriminatory power of the prediction tool was poor (AUC 0.61; 95% CI, 0.50–0.73; Figure 2.1).Reference Tazhibi, Bashardoost and Ahmadi 27 Analysis restricted to patients with CDI due to non-outbreak strains showed similarly poor discrimination (AUC, 0.56; 95% CI, 0.37–0.76; Figure 2.2).
DISCUSSION
In this study, we validated 3 prediction models, all designed to identify patients at risk for a complicated course of CDI or death within 30 days after diagnosis, using a validation cohort in which approximately half of patients were part of a CDI outbreak caused by ribotype 027. When applied to our total cohort (outbreak strain and non-outbreak strains), all 3 prediction models performed poorly. However, because the prediction tools were derived in endemic settings and because infection with C. difficile ribotype 027 has been associated with more severe outcomes,Reference Loo, Poirier and Miller 28 – Reference Pepin, Valiquette, Gagnon, Routhier and Brazeau 31 we also tested the prediction models on our cohort excluding patients infected with the outbreak strain C. difficile ribotype 027. In this restricted analysis, the prediction model developed by Hensgens et al performed much better, with an AUC of nearly 0.8. This refinement provided strength to our study, showing that a prediction rule can only be applied in a cohort that is comparable with the derivation cohort.
The recent guideline of the Infectious Diseases Society of America (IDSA) recommends that age, peak leucocyte count, and peak serum creatinine level could be considered as indicators of a complicated course of CDI when treatment is started.Reference Cohen, Gerding and Johnson 4 Na et al used these 3 variables in their prediction model. However, our study findings did not support their prediction tool, which seems counterintuitive. This difference may be due to the dichotomized scoring system or to the chosen cutoff points of the different variables. In addition, it has been suggested that measurements of leucocyte count and serum creatinine level at different times around the day of CDI diagnosis lead to different severity classifications in many cases.Reference Bauer, Hensgens and Miller 32 Na et al used a time interval of 7 days for the measurement of peak leucocyte count and serum creatinine level, which could have contributed to the poor performance of their prediction rule. The prediction model developed by Hensgens et al was constructed using adequate methodology: the predictors were selected using backward selection, and bootstrapping techniques were used to adjust for overfitting.Reference Steyerberg 33 Additionally, this scoring system was based on clinical parameters that are available after the completion of medical history and physical examination, which enables the attending physician to use it for treatment guidance.Reference Hensgens, Dekkers, Goorhuis, LeCessie and Kuijper 8 Welfare et al also based their prediction tool on clinical parameters that are readily available at a patient’s bedside. They performed the largest study on comorbidities as predictors of 30-day mortality in patients with CDI, and they developed the age, renal disease, and cancer (ARC) score to predict 30-day mortality. Welfare et al reported a mortality rate of 33%, which is double the mortality rate in our validation cohort. The mean age of the cohort of Welfare et al was 15 years higher than that of our cohort, and our cohort did not contain patients in the highest risk category. Additionally, in our cohort, data on clinical diagnoses were obtained from medical charts, which differs from the derivation study in which administration codes were used. These differences are a limitation of our study, and they could have influenced the performance of their prediction tool in our cohort. Unfortunately, the number of patients in the older age category in our validation cohort was too small to allow a validation in this subset.
A second limitation of our study was the difference between the validation and derivation cohorts: the derivation cohorts consisted of patients diagnosed with CDI in an endemic setting, whereas our validation cohort consisted of all patients diagnosed with CDI (due to the outbreak strain, and due to other strains) during an outbreak of C. difficile ribotype 027. The number of patients who developed a complicated course of CDI was significantly higher among patients diagnosed with CDI due to ribotype 027 than among non-027 CDI patients. Third, we used existing patient data files; therefore, some data were missing. We found 12 studies on prediction rules for a complicated course of CDI. Due to missing data for several variables per prediction tool, we were not able to validate all 12 different prediction tools. However, as shown in Table 1, except for number of leucocytes, serum albumin (which is not measured routinely in our hospital), and age, there was much heterogeneity in the variables used in the various scores. In addition, inclusion of nonquantitative parameters and parameters that are not routinely available at time of diagnosis limits the use of prediction tools in clinical practice. Importantly, a recent systematic review showed that most prediction tools presented several methodological limitations and weak validities, which lead to suboptimal quality and debatable utility in clinical settings.Reference Abou Chakra, Pepin and Valiquette 20 , Reference Justice, Covinsky and Berlin 34 Fourth, the relatively small sample size affected the precision of the estimates. Missing data were imputed using multiple imputation; when data on blood pressure measurements were missing, we made the assumption that patients had no hypotension on the day of diagnosis. Although we feel that these corrections for missing data were accurate, this factor could have influenced the results. Finally, different antibiotic regimens may have different risks for the development of a complicated course of CDI.Reference Stevens, Nelson and Schwab-Daugherty 35 , Reference Nelson, Suda and Evans 36 Data on CDI treatment were missing for both the derivation cohort of Na et al and that of Welfare et al; CDI treatment regimens used in the study by Hensgens et al differed from the regimens used in the validation cohort. These differences made it difficult to fully assess similarities between the validation cohort and the derivation cohorts.
In conclusion, our study shows that a prediction rule can only be used in a cohort comparable with the derivation cohort. The performance of all 3 validated prediction models was disappointing in a combined epidemic/endemic setting, and can therefore not be used during a CDI outbreak to predict a complicated course of CDI. The prediction model by Hensgens et al performed relatively well, however, to identify patients with CDI at risk for a complicated course when the validation cohort was restricted to patients with CDI due to non-outbreak strains. This prediction model can therefore be used in an endemic setting to identify patients at risk for CDI complications, aiding clinicians in deciding which patients to monitor closely for CDI-related complications. Future clinical trials should be directed at determining whether early treatment and choice of treatment directed by the severity score improves patient outcomes.
ACKNOWLEDGMENTS
Financial support: No financial support was provided relevant to this article.
Potential conflicts of interest: All authors report no conflicts of interest relevant to this article.
SUPPLEMENTARY MATERIAL
To view supplementary material for this article, please visit https:/doi.org/10.1017/ice.2017.89